| Param | Original file | Final file |
|---|---|---|
| Filename | modeM0/AS1A11_008T06_9000004762_33116cztM0_level2.evt | modeM0/AS1A11_008T06_9000004762_33116cztM0_level2_quad_clean.evt |
| Size (bytes) | 575,020,800 | 74,577,600 |
| Size | 548.4 MB | 71.1 MB |
| Events in quadrant A | 2,616,871 | 505,007 |
| Events in quadrant B | 3,965,219 | 478,779 |
| Events in quadrant C | 3,079,707 | 493,571 |
| Events in quadrant D | 7,386,973 | 401,873 |
| Mode M9 | |||
|---|---|---|---|
| Quadrant | BADHDUFLAG | Total packets | Discarded packets |
| A | 0 | 30 | 0 |
| B | 0 | 30 | 0 |
| C | 0 | 30 | 0 |
| D | 0 | 31 | 0 |
| Mode SS | |||
|---|---|---|---|
| Quadrant | BADHDUFLAG | Total packets | Discarded packets |
| A | 0 | 110 | 0 |
| B | 0 | 110 | 0 |
| C | 0 | 110 | 0 |
| D | 0 | 110 | 0 |
| Mode M0 | |||
|---|---|---|---|
| Quadrant | BADHDUFLAG | Total packets | Discarded packets |
| A | 0 | 11041 | 3 |
| B | 0 | 15072 | 2 |
| C | 0 | 12426 | 2 |
| D | 0 | 25815 | 2 |
| Quadrant | Total seconds | Saturated seconds | Saturation percentage |
|---|---|---|---|
| A | 5404 | 12 | 0.222058% |
| B | 5404 | 425 | 7.864545% |
| C | 5404 | 84 | 1.554404% |
| D | 5404 | 1258 | 23.279053% |
Noise dominated data is calculated using 1-second bins in cleaned event files. If a bin has >2000 counts, and if more than 50% of those come from <1% of pixels, then it is considered to be noise-dominated and hence unusable.
| Quadrant | # 1 sec bins | Bins with >0 counts | Bins with >2000 counts | High rate bins dominated by noise | Noise dominated (total time) | Noise dominated (detector-on time) | Marked lightcurve |
|---|---|---|---|---|---|---|---|
| A | 7167 | 5405 | 0 | 0 | 0.00% | 0.00% | 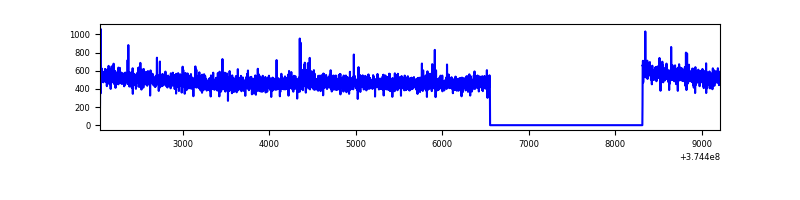 |
| B | 7167 | 5405 | 309 | 309 | 4.31% | 5.72% | 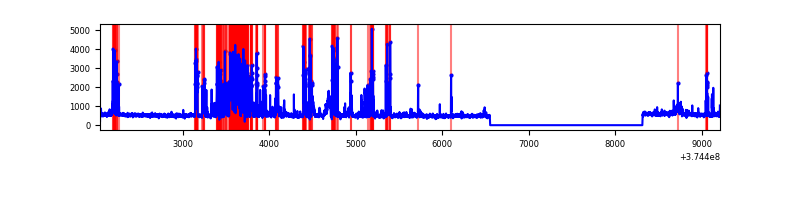 |
| C | 7167 | 5405 | 58 | 58 | 0.81% | 1.07% | 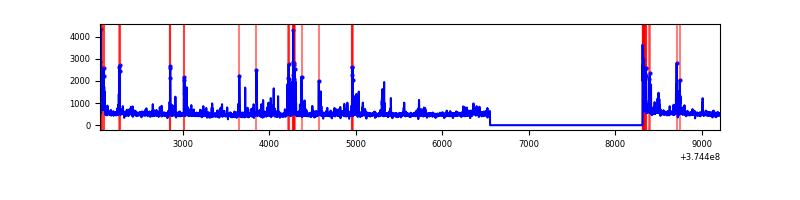 |
| D | 7167 | 5405 | 1185 | 1185 | 16.53% | 21.92% | 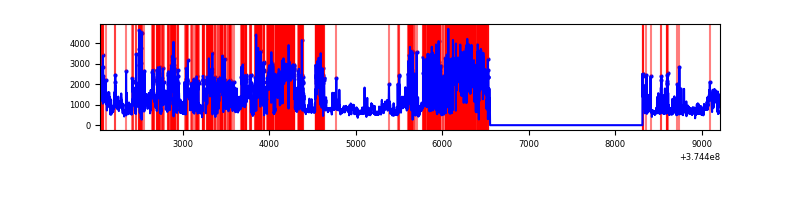 |
Top three noisy pixels from each quadrant. If the there are fewer than three noisy pixels in the level2.evt file, extra rows are filled as -1
| Pixel properties | Quadrant properties | ||||||
|---|---|---|---|---|---|---|---|
| Quadrant | DetID | PixID | Counts | Sigma | Mean | Median | Sigma |
| A | 7 | 16 | 9825 | 68.84 | 672 | 659 | 133.1 |
| A | 13 | 254 | 9807 | 68.71 | 672 | 659 | 133.1 |
| A | 3 | 137 | 5995 | 40.08 | 672 | 659 | 133.1 |
| B | 5 | 172 | 1206796 | 9901.41 | 644 | 629 | 121.8 |
| B | 5 | 255 | 62863 | 510.88 | 644 | 629 | 121.8 |
| B | 0 | 197 | 25942 | 207.79 | 644 | 629 | 121.8 |
| C | 8 | 111 | 220831 | 1500.43 | 640 | 649 | 146.7 |
| C | 7 | 221 | 150466 | 1020.92 | 640 | 649 | 146.7 |
| C | 0 | 10 | 144775 | 982.14 | 640 | 649 | 146.7 |
| D | 7 | 223 | 3389258 | 23692.2 | 589 | 577 | 143.0 |
| D | 8 | 195 | 660151 | 4611.46 | 589 | 577 | 143.0 |
| D | 12 | 6 | 328928 | 2295.69 | 589 | 577 | 143.0 |
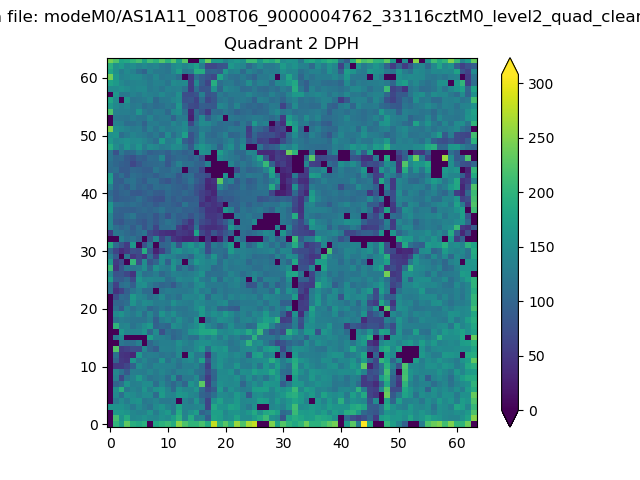
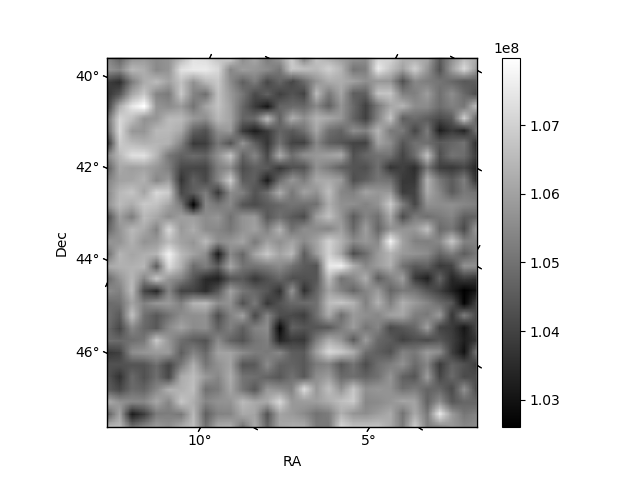
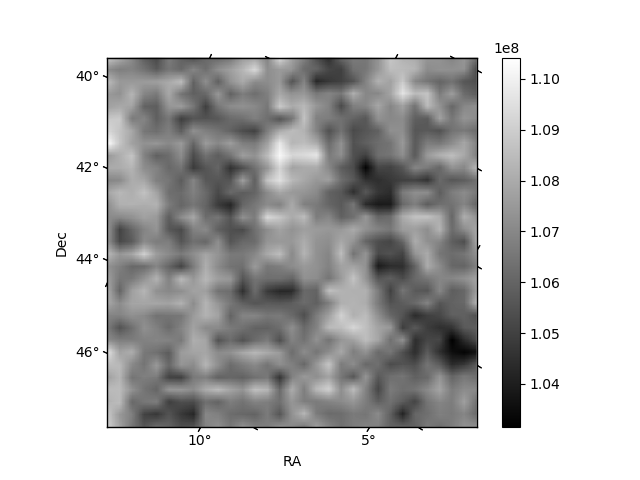
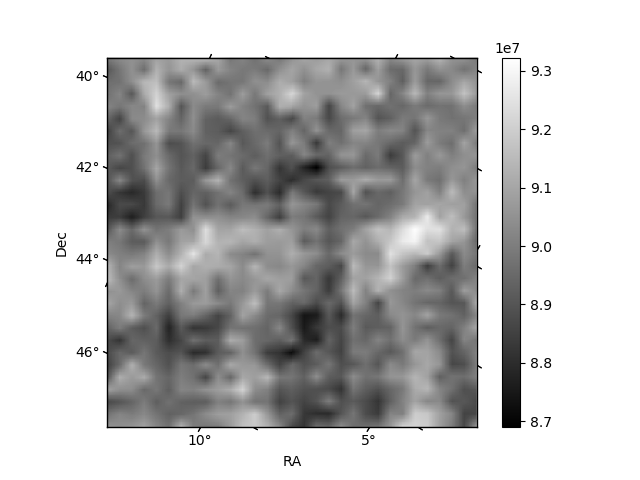
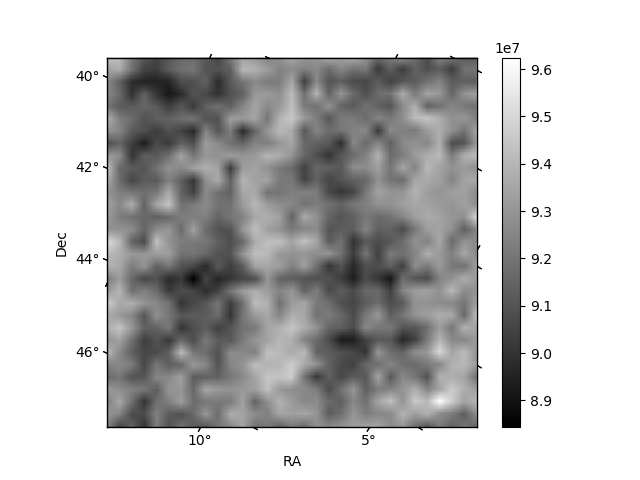
Histogram calculated using DETX and DETY for each event in the final _common_clean file
| Quadrant A | 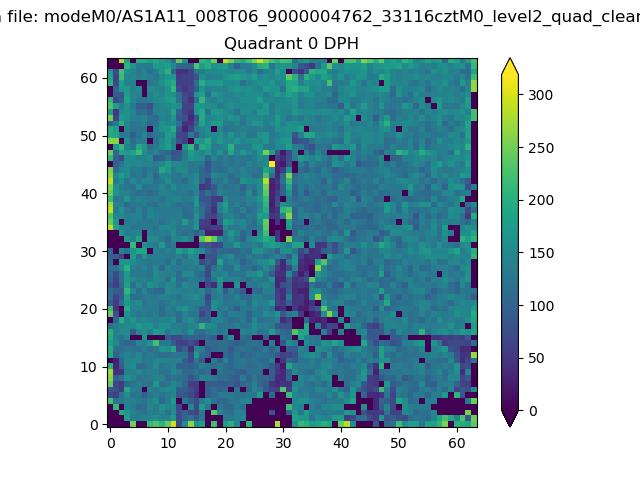 |
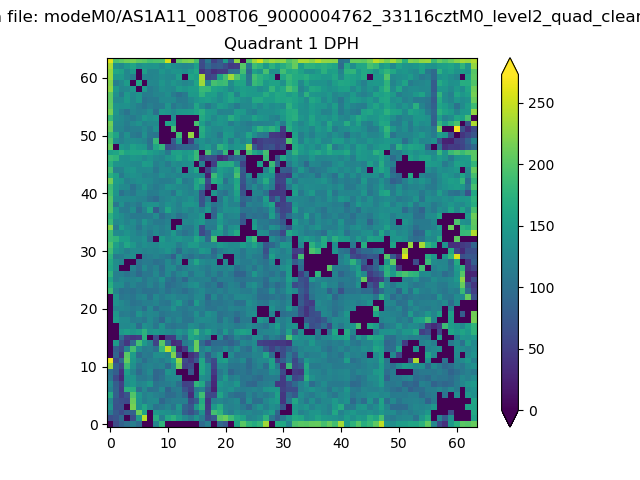 |
Quadrant B |
|---|---|---|---|
| Quadrant D | 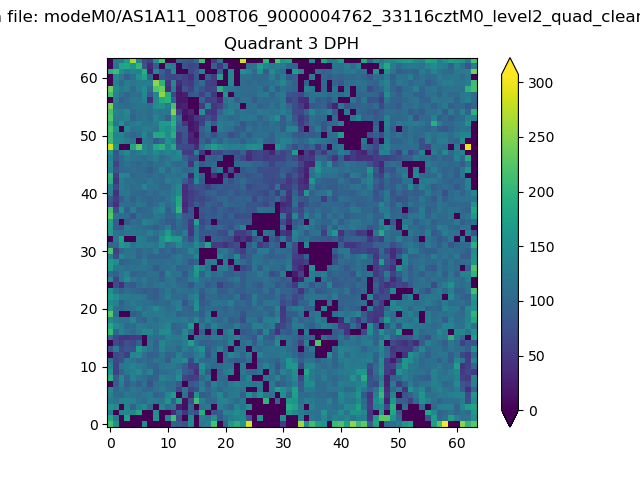 |
 |
Quadrant C |
| Plot type | Count rate plots | Images |
|---|---|---|
| Comparison with Poisson distribution Blue bars denote a histogram of data divided into 1 sec bins. Red curve is a Poisson curve with rate = median count rate of data. |
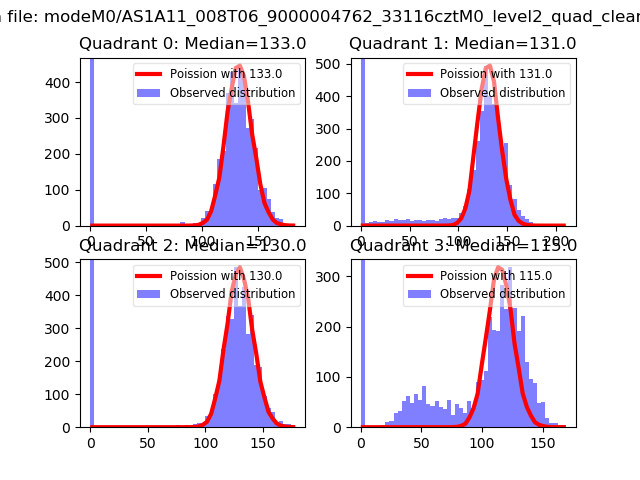 |
 |
| Quadrant-wise count rates Data is divided into 100 sec bins |
 |
|
| Module-wise count rates for Quadrant A Data is divided into 100 sec bins |
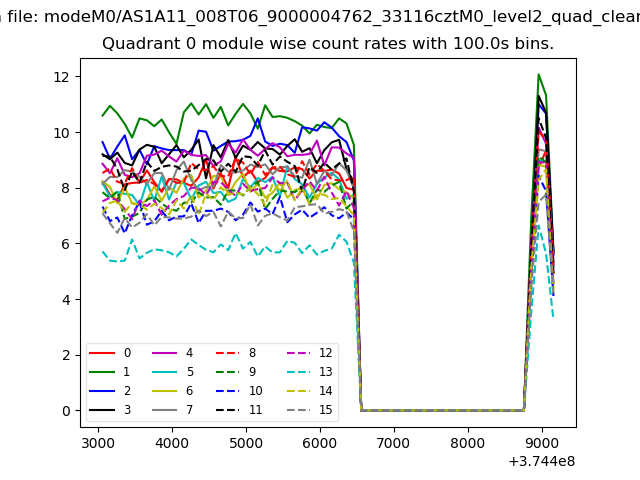 |
 |
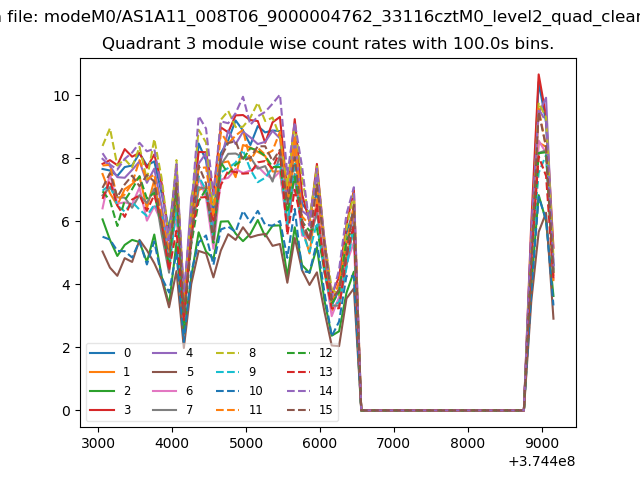
| Module-wise count rates for Quadrant B Data is divided into 100 sec bins |
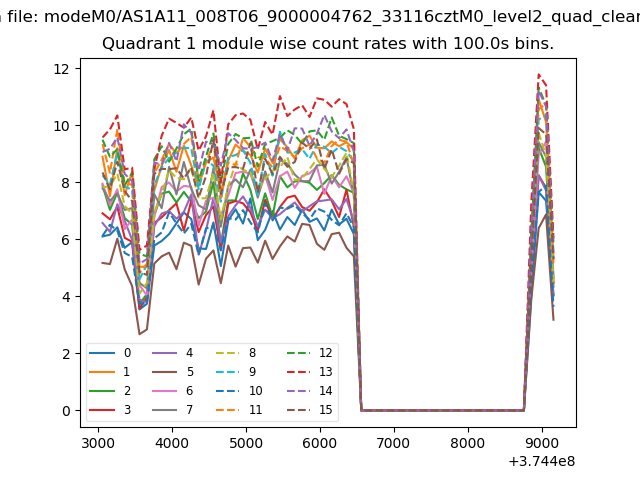 |
 |
| Module-wise count rates for Quadrant C Data is divided into 100 sec bins |
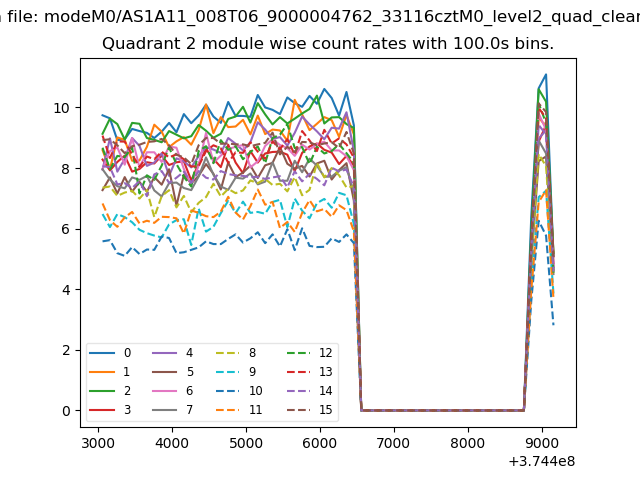 |
 |
| Module-wise count rates for Quadrant D Data is divided into 100 sec bins |
 |
 |
| Parameter | Plot |
|---|---|
| CZT HV Monitor | 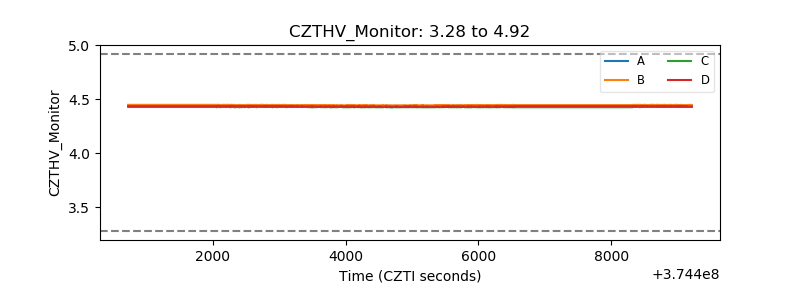 |
| D_VDD | 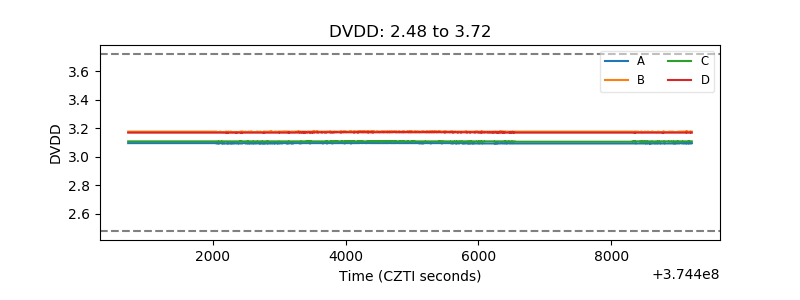 |
| Temperature 1 | 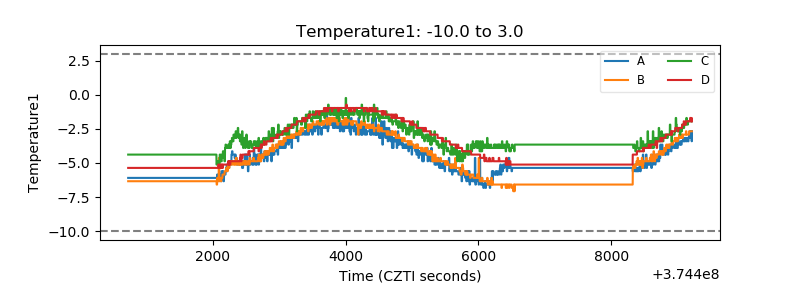 |
| Veto HV Monitor | 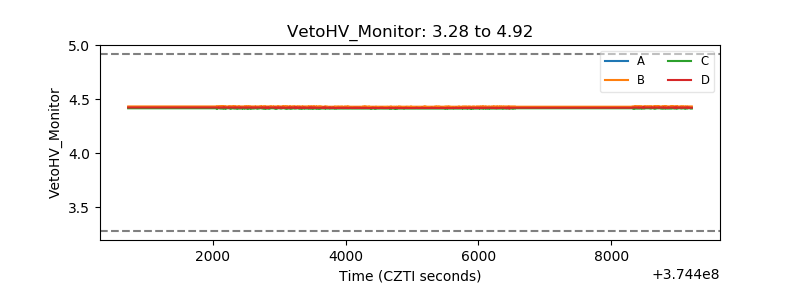 |
| Veto LLD | 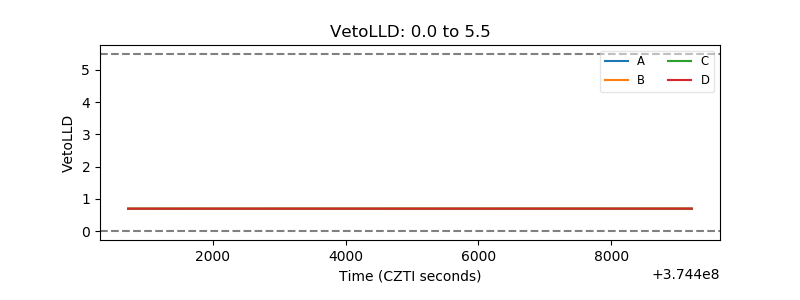 |
| Alpha Counter |  |
| _CPM_Rate |  |
| CZT Counter | 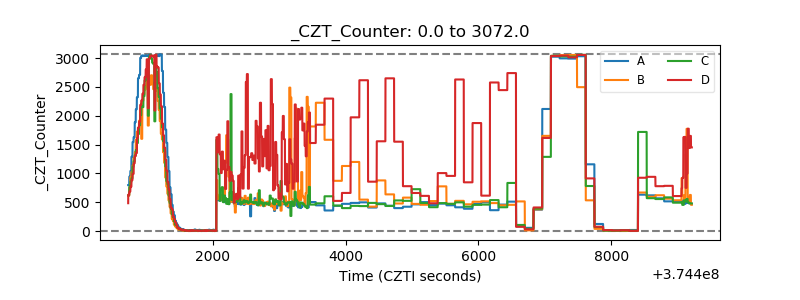 |
| +2.5 Volts monitor |  |
| +5 Volts monitor |  |
| _ROLL_ROT | 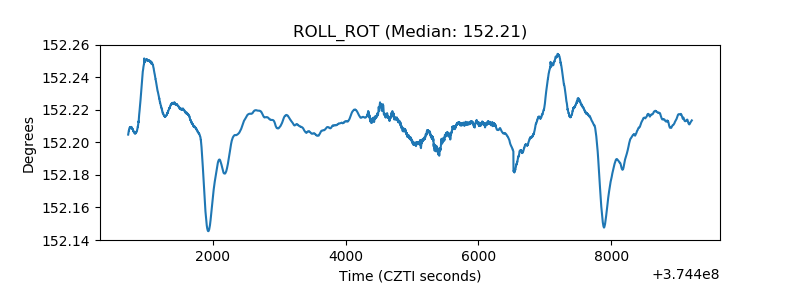 |
| _Roll_DEC | 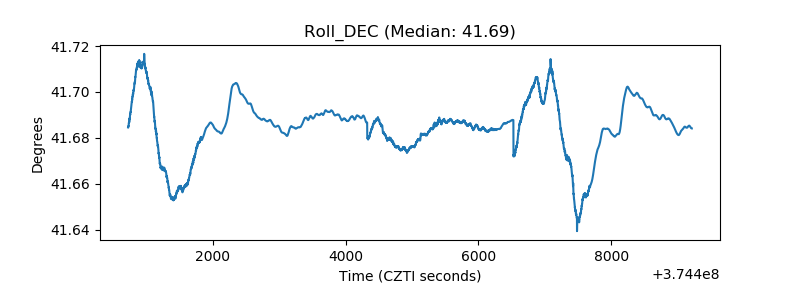 |
| _Roll_RA | 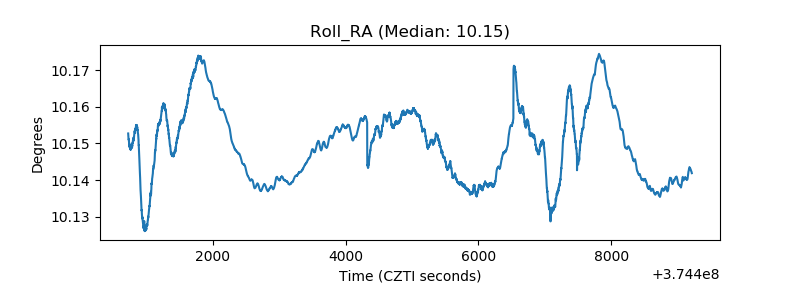 |
| Veto Counter | 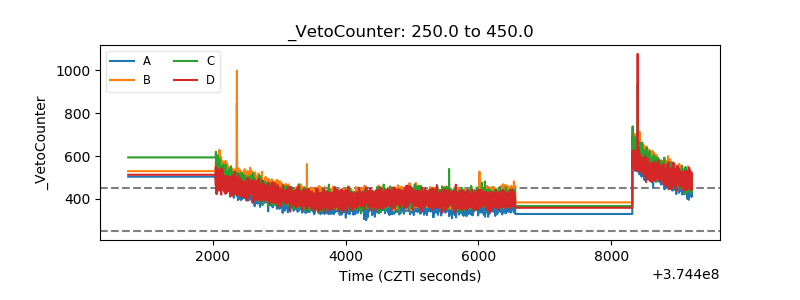 |