| Param | Original file | Final file |
|---|---|---|
| Filename | modeM0/AS1A11_008T06_9000004762_33295cztM0_level2.evt | modeM0/AS1A11_008T06_9000004762_33295cztM0_level2_quad_clean.evt |
| Size (bytes) | 134,668,800 | 11,410,560 |
| Size | 128.4 MB | 10.9 MB |
| Events in quadrant A | 778,506 | 65,729 |
| Events in quadrant B | 1,039,752 | 60,186 |
| Events in quadrant C | 1,071,737 | 56,274 |
| Events in quadrant D | 1,084,916 | 52,626 |
| Mode M9 | |||
|---|---|---|---|
| Quadrant | BADHDUFLAG | Total packets | Discarded packets |
| A | 0 | 20 | 5 |
| B | 0 | 20 | 7 |
| C | 0 | 20 | 7 |
| D | 0 | 20 | 6 |
| Mode SS | |||
|---|---|---|---|
| Quadrant | BADHDUFLAG | Total packets | Discarded packets |
| A | 0 | 74 | 38 |
| B | 0 | 74 | 38 |
| C | 0 | 74 | 38 |
| D | 0 | 75 | 37 |
| Mode M0 | |||
|---|---|---|---|
| Quadrant | BADHDUFLAG | Total packets | Discarded packets |
| A | 0 | 7516 | 4377 |
| B | 0 | 9698 | 5707 |
| C | 0 | 10058 | 5949 |
| D | 0 | 11652 | 7499 |
| Quadrant | Total seconds | Saturated seconds | Saturation percentage |
|---|---|---|---|
| A | 1505 | 2 | 0.132890% |
| B | 1455 | 73 | 5.017182% |
| C | 1486 | 89 | 5.989233% |
| D | 1385 | 44 | 3.176895% |
Noise dominated data is calculated using 1-second bins in cleaned event files. If a bin has >2000 counts, and if more than 50% of those come from <1% of pixels, then it is considered to be noise-dominated and hence unusable.
| Quadrant | # 1 sec bins | Bins with >0 counts | Bins with >2000 counts | High rate bins dominated by noise | Noise dominated (total time) | Noise dominated (detector-on time) | Marked lightcurve |
|---|---|---|---|---|---|---|---|
| A | 5630 | 1740 | 0 | 0 | 0.00% | 0.00% | 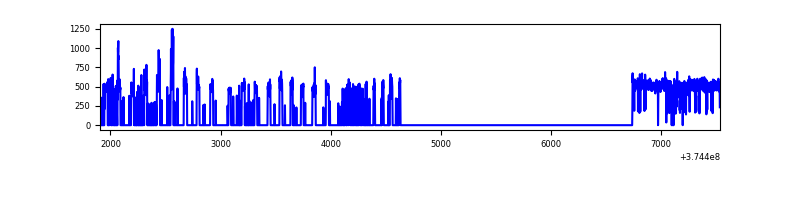 |
| B | 5616 | 1672 | 45 | 45 | 0.80% | 2.69% | 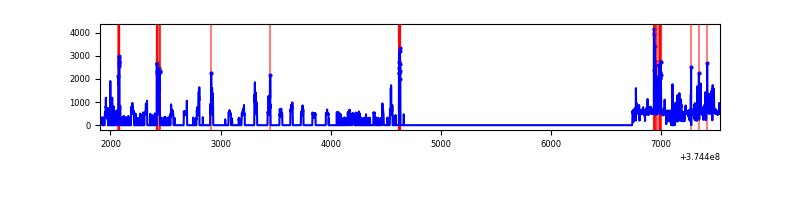 |
| C | 5610 | 1722 | 66 | 66 | 1.18% | 3.83% | 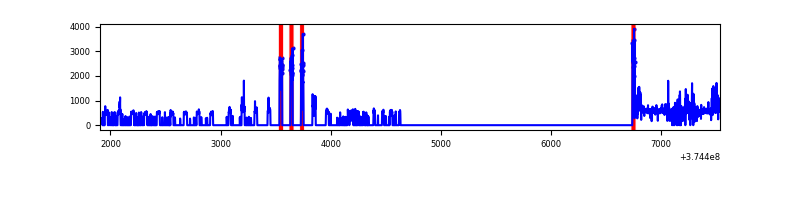 |
| D | 5587 | 1554 | 31 | 31 | 0.55% | 1.99% | 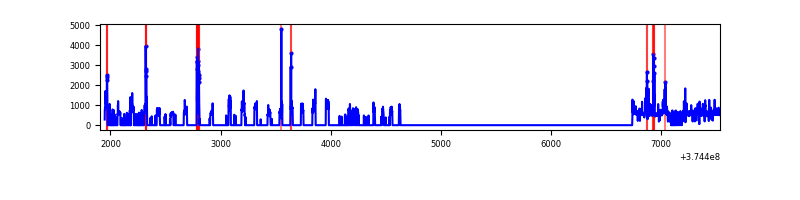 |
Top three noisy pixels from each quadrant. If the there are fewer than three noisy pixels in the level2.evt file, extra rows are filled as -1
| Pixel properties | Quadrant properties | ||||||
|---|---|---|---|---|---|---|---|
| Quadrant | DetID | PixID | Counts | Sigma | Mean | Median | Sigma |
| A | 15 | 169 | 29492 | 741.89 | 188 | 184 | 39.5 |
| A | 15 | 47 | 16969 | 424.89 | 188 | 184 | 39.5 |
| A | 13 | 6 | 3582 | 86.02 | 188 | 184 | 39.5 |
| B | 5 | 172 | 179915 | 5177.0 | 175 | 171 | 34.7 |
| B | 0 | 219 | 133319 | 3834.94 | 175 | 171 | 34.7 |
| B | 0 | 214 | 7947 | 223.96 | 175 | 171 | 34.7 |
| C | 10 | 49 | 174218 | 4166.61 | 173 | 174 | 41.8 |
| C | 0 | 10 | 72486 | 1731.15 | 173 | 174 | 41.8 |
| C | 15 | 214 | 65374 | 1560.89 | 173 | 174 | 41.8 |
| D | 8 | 195 | 203289 | 4406.26 | 164 | 161 | 46.1 |
| D | 2 | 250 | 62246 | 1346.75 | 164 | 161 | 46.1 |
| D | 7 | 223 | 60715 | 1313.54 | 164 | 161 | 46.1 |
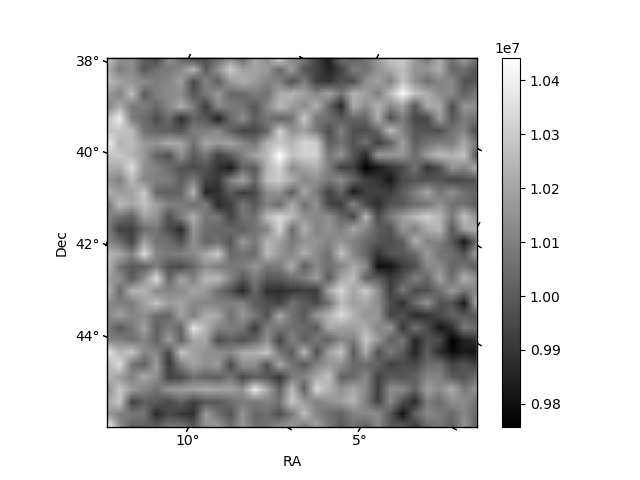
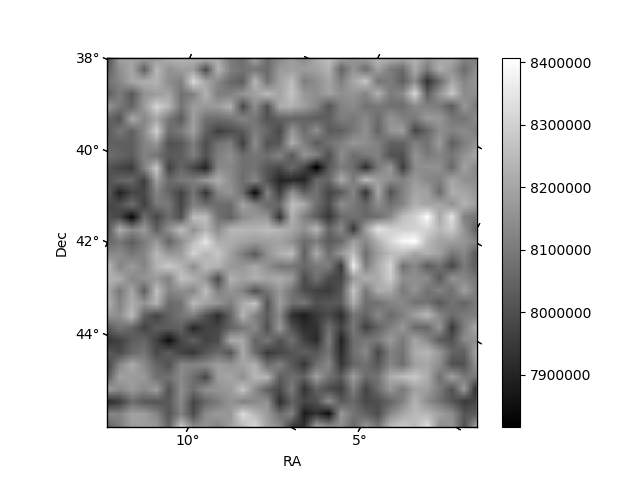
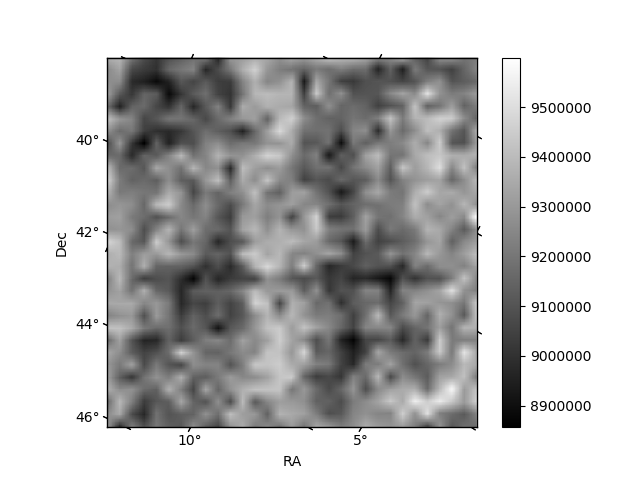
Histogram calculated using DETX and DETY for each event in the final _common_clean file
| Quadrant A | 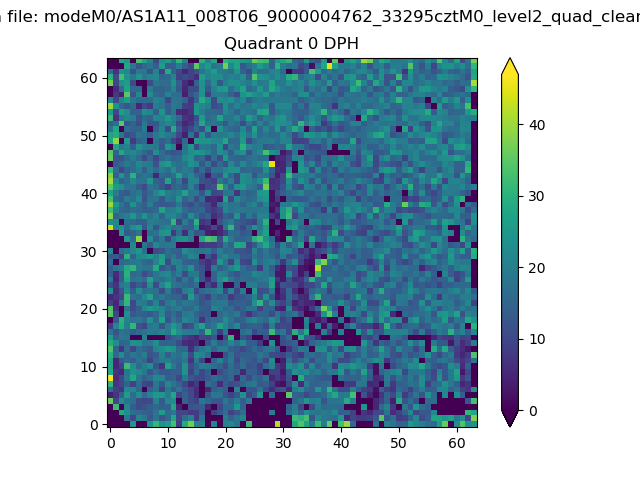 |
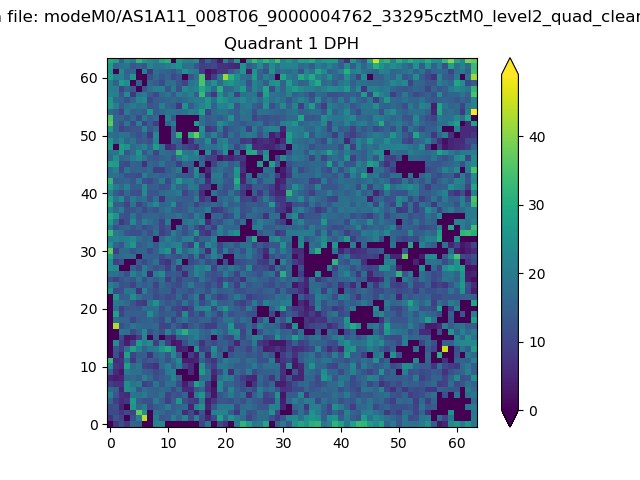 |
Quadrant B |
|---|---|---|---|
| Quadrant D | 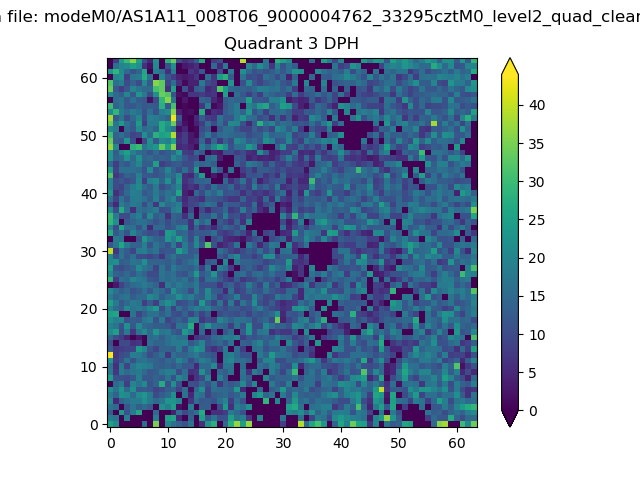 |
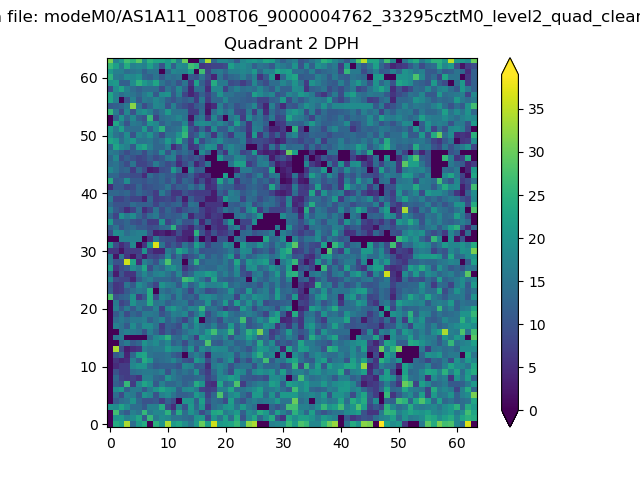 |
Quadrant C |
| Plot type | Count rate plots | Images |
|---|---|---|
| Comparison with Poisson distribution Blue bars denote a histogram of data divided into 1 sec bins. Red curve is a Poisson curve with rate = median count rate of data. |
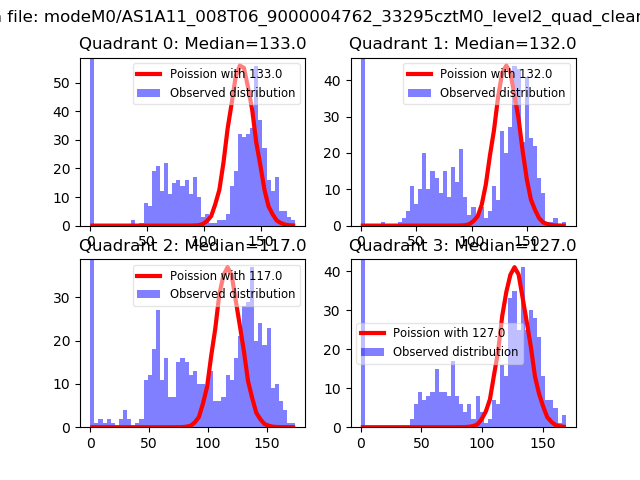 |
 |
| Quadrant-wise count rates Data is divided into 100 sec bins |
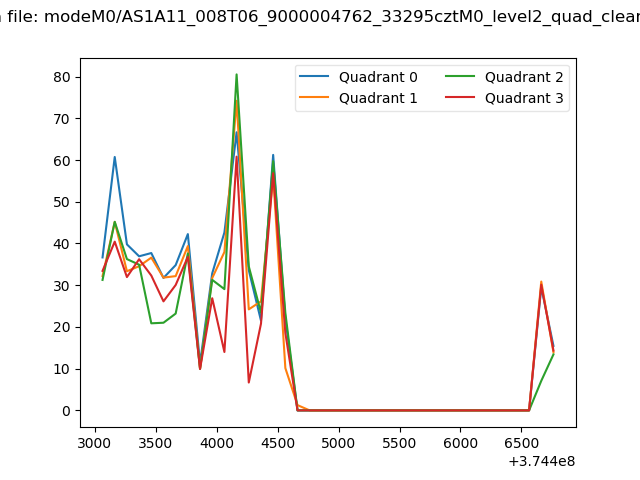 |
|
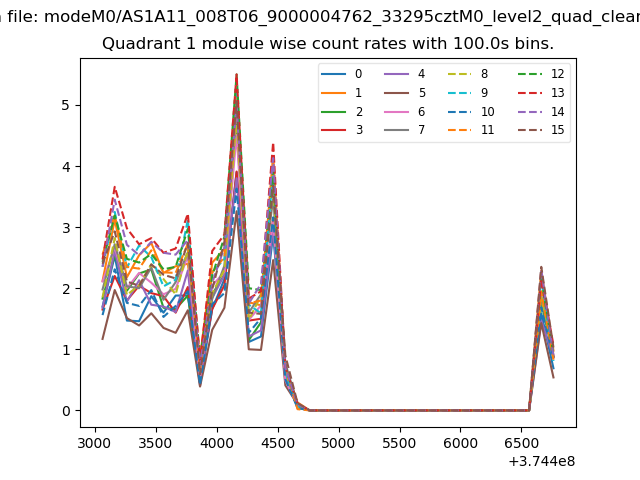
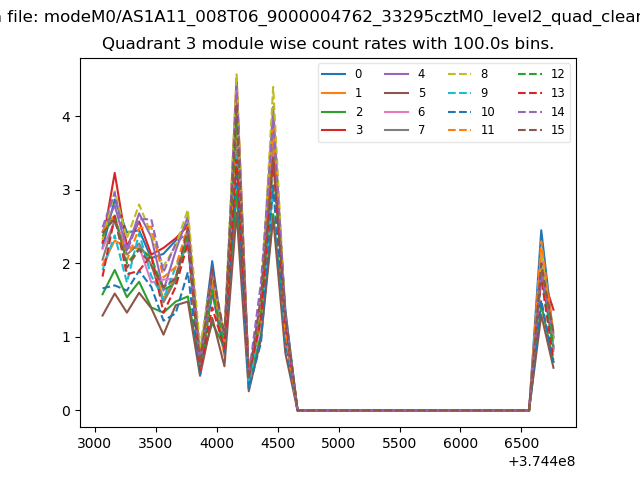
| Module-wise count rates for Quadrant A Data is divided into 100 sec bins |
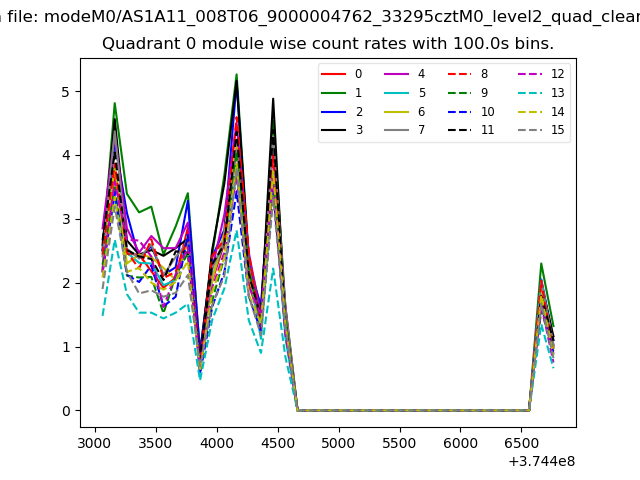 |
 |
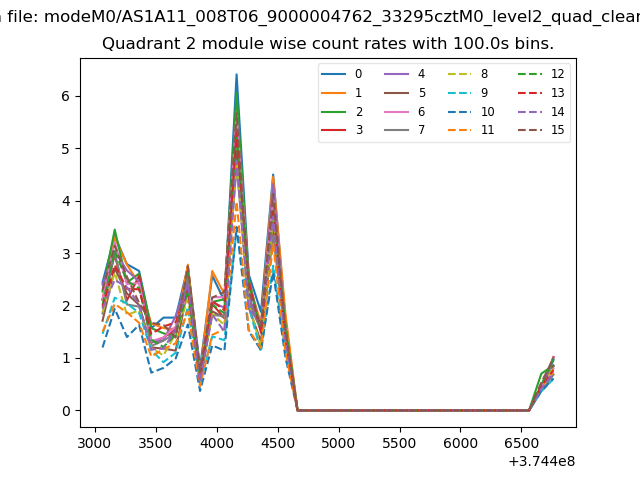
| Module-wise count rates for Quadrant B Data is divided into 100 sec bins |
 |
 |
| Module-wise count rates for Quadrant C Data is divided into 100 sec bins |
 |
 |
| Module-wise count rates for Quadrant D Data is divided into 100 sec bins |
 |
 |
| Parameter | Plot |
|---|---|
| CZT HV Monitor |  |
| D_VDD | 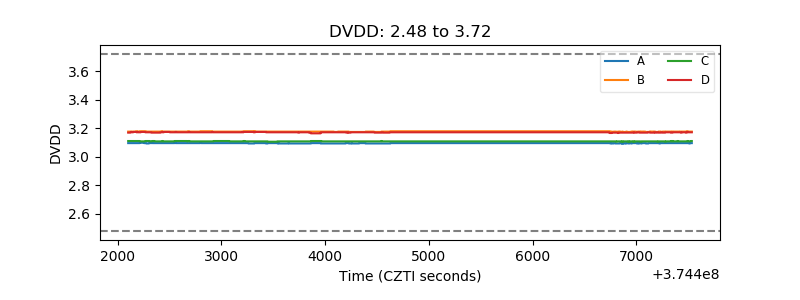 |
| Temperature 1 | 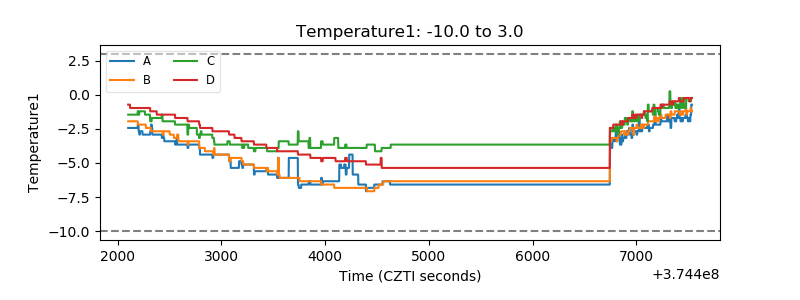 |
| Veto HV Monitor | 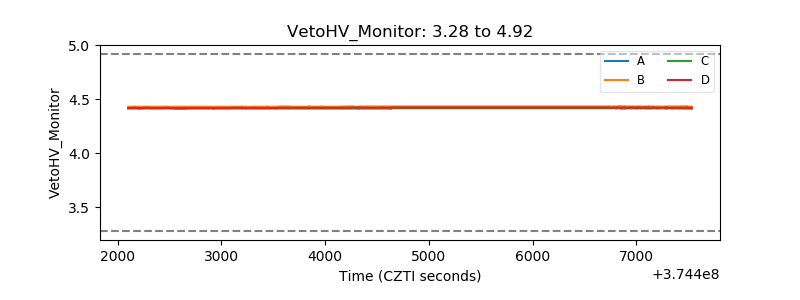 |
| Veto LLD | 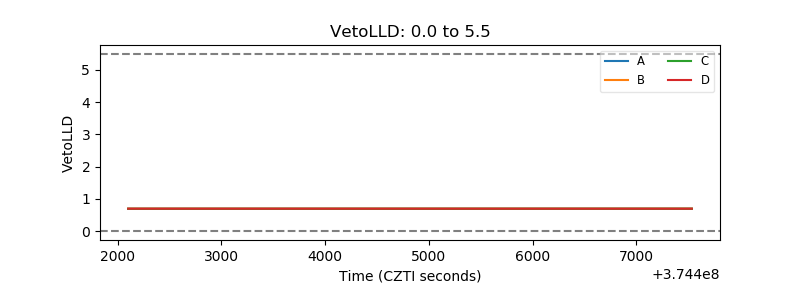 |
| Alpha Counter |  |
| _CPM_Rate | 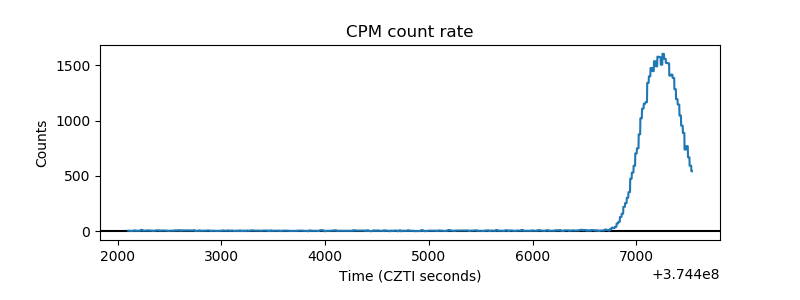 |
| CZT Counter | 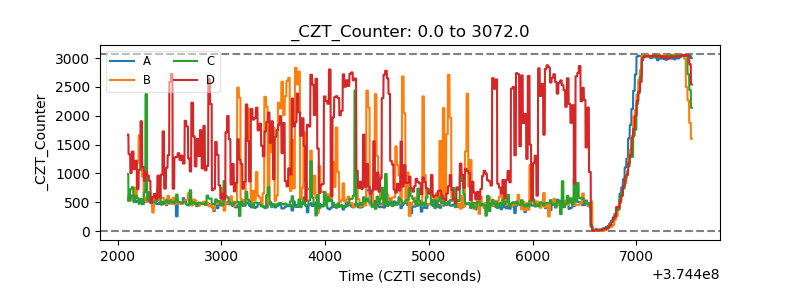 |
| +2.5 Volts monitor |  |
| +5 Volts monitor |  |
| _ROLL_ROT | 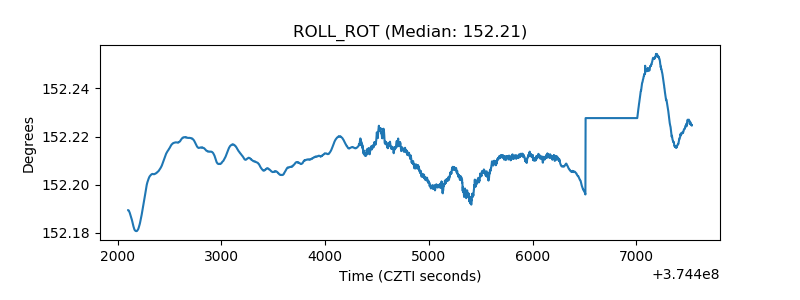 |
| _Roll_DEC | 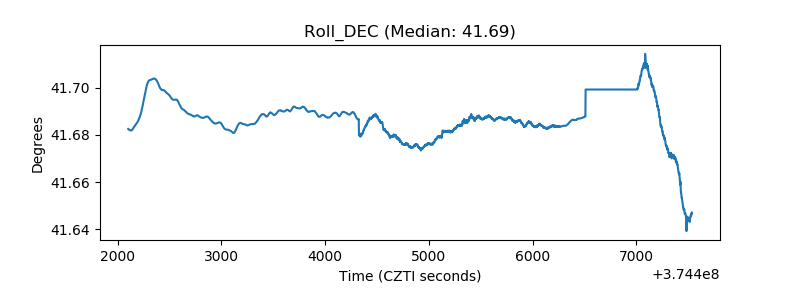 |
| _Roll_RA |  |
| Veto Counter | 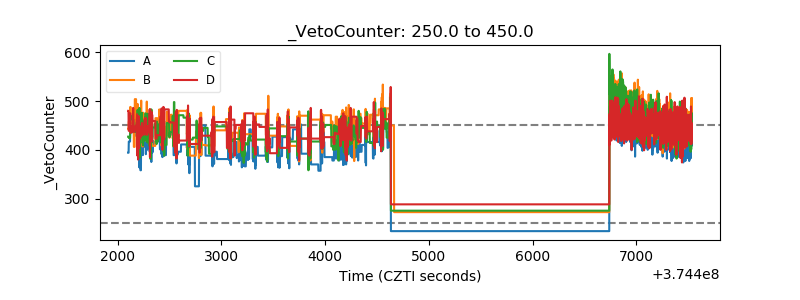 |