| Param | Original file | Final file |
|---|---|---|
| Filename | modeM0/AS1A11_030T01_9000004760cztM0_level2.fits | modeM0/AS1A11_030T01_9000004760cztM0_level2_quad_clean.evt |
| Size (bytes) | 417,245,760 | 370,543,680 |
| Size | 397.9 MB | 353.4 MB |
| Events in quadrant A | 2,793,870 | 2,572,252 |
| Events in quadrant B | 2,627,190 | 2,513,315 |
| Events in quadrant C | 2,447,734 | 2,093,319 |
| Events in quadrant D | 1,680,022 | 968,641 |
| Mode M9 | |||
|---|---|---|---|
| Quadrant | BADHDUFLAG | Total packets | Discarded packets |
| A | 0 | 187 | 0 |
| B | 0 | 187 | 0 |
| C | 0 | 187 | 0 |
| D | 0 | 187 | 0 |
| Mode M0 | |||
|---|---|---|---|
| Quadrant | BADHDUFLAG | Total packets | Discarded packets |
| A | 0 | 91184 | 0 |
| B | 0 | 105451 | 0 |
| C | 0 | 151086 | 0 |
| D | 0 | 298768 | 0 |
| Mode SS | |||
|---|---|---|---|
| Quadrant | BADHDUFLAG | Total packets | Discarded packets |
| A | 0 | 916 | 0 |
| B | 0 | 916 | 0 |
| C | 0 | 916 | 0 |
| D | 0 | 916 | 0 |
| Quadrant | Total seconds | Saturated seconds | Saturation percentage |
|---|---|---|---|
| A | 44757 | 52 | 0.116183% |
| B | 44757 | 1584 | 3.539111% |
| C | 44757 | 6505 | 14.534039% |
| D | 44757 | 25462 | 56.889425% |
Noise dominated data is calculated using 1-second bins in cleaned event files. If a bin has >2000 counts, and if more than 50% of those come from <1% of pixels, then it is considered to be noise-dominated and hence unusable.
| Quadrant | # 1 sec bins | Bins with >0 counts | Bins with >2000 counts | High rate bins dominated by noise | Noise dominated (total time) | Noise dominated (detector-on time) | Marked lightcurve |
|---|---|---|---|---|---|---|---|
| A | 63104 | 44756 | 0 | 0 | 0.00% | 0.00% |  |
| B | 63104 | 44746 | 0 | 0 | 0.00% | 0.00% |  |
| C | 63104 | 44710 | 0 | 0 | 0.00% | 0.00% |  |
| D | 63104 | 44717 | 0 | 0 | 0.00% | 0.00% |  |
Top three noisy pixels from each quadrant. If the there are fewer than three noisy pixels in the level2.evt file, extra rows are filled as -1
| Pixel properties | Quadrant properties | ||||||
|---|---|---|---|---|---|---|---|
| Quadrant | DetID | PixID | Counts | Sigma | Mean | Median | Sigma |
| A | 9 | 19 | 2299 | 8.88 | 729 | 686 | 181.7 |
| A | 0 | 29 | 2223 | 8.46 | 729 | 686 | 181.7 |
| A | 14 | 95 | 2174 | 8.19 | 729 | 686 | 181.7 |
| B | 2 | 9 | 2167 | 10.98 | 695 | 666 | 136.7 |
| B | 3 | 80 | 1956 | 9.43 | 695 | 666 | 136.7 |
| B | 5 | 128 | 1821 | 8.45 | 695 | 666 | 136.7 |
| C | 1 | 81 | 2007 | 8.4 | 648 | 611 | 166.1 |
| C | 1 | 80 | 1957 | 8.1 | 648 | 611 | 166.1 |
| C | 3 | 202 | 1898 | 7.75 | 648 | 611 | 166.1 |
| D | 10 | 113 | 1253 | 6.3 | 481 | 439 | 129.1 |
| D | 7 | 3 | 1248 | 6.26 | 481 | 439 | 129.1 |
| D | 10 | 189 | 1230 | 6.12 | 481 | 439 | 129.1 |
Histogram calculated using DETX and DETY for each event in the final _common_clean file
| Quadrant A | 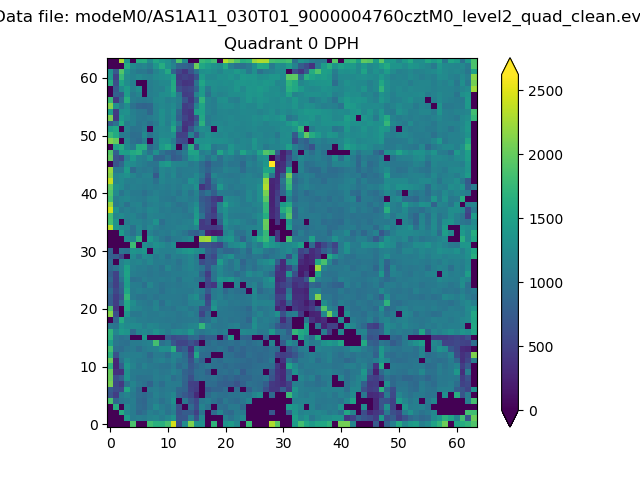 |
 |
Quadrant B |
|---|---|---|---|
| Quadrant D |  |
 |
Quadrant C |
| Plot type | Count rate plots | Images |
|---|---|---|
| Comparison with Poisson distribution Blue bars denote a histogram of data divided into 1 sec bins. Red curve is a Poisson curve with rate = median count rate of data. |
 |
 |
| Quadrant-wise count rates Data is divided into 100 sec bins |
 |
|
| Module-wise count rates for Quadrant A Data is divided into 100 sec bins |
 |
 |
| Module-wise count rates for Quadrant B Data is divided into 100 sec bins |
 |
 |
| Module-wise count rates for Quadrant C Data is divided into 100 sec bins |
 |
 |
| Module-wise count rates for Quadrant D Data is divided into 100 sec bins |
 |
 |
| Parameter | Plot |
|---|---|
| CZT HV Monitor |  |
| D_VDD |  |
| Temperature 1 |  |
| Veto HV Monitor |  |
| Veto LLD |  |
| Alpha Counter |  |
| _CPM_Rate |  |
| CZT Counter |  |
| +2.5 Volts monitor |  |
| +5 Volts monitor |  |
| _ROLL_ROT |  |
| _Roll_DEC |  |
| _Roll_RA |  |
| Veto Counter |  |