| Param | Original file | Final file |
|---|---|---|
| Filename | modeM0/AS1A11_030T01_9000004760_33085cztM0_level2.evt | modeM0/AS1A11_030T01_9000004760_33085cztM0_level2_quad_clean.evt |
| Size (bytes) | 667,267,200 | 50,929,920 |
| Size | 636.4 MB | 48.6 MB |
| Events in quadrant A | 2,601,312 | 308,743 |
| Events in quadrant B | 3,503,015 | 301,348 |
| Events in quadrant C | 6,261,097 | 270,275 |
| Events in quadrant D | 7,465,187 | 269,512 |
| Mode M9 | |||
|---|---|---|---|
| Quadrant | BADHDUFLAG | Total packets | Discarded packets |
| A | 0 | 23 | 0 |
| B | 0 | 23 | 0 |
| C | 0 | 23 | 0 |
| D | 0 | 24 | 0 |
| Mode M0 | |||
|---|---|---|---|
| Quadrant | BADHDUFLAG | Total packets | Discarded packets |
| A | 0 | 11266 | 3 |
| B | 0 | 13810 | 2 |
| C | 0 | 22351 | 2 |
| D | 0 | 26106 | 2 |
| Mode SS | |||
|---|---|---|---|
| Quadrant | BADHDUFLAG | Total packets | Discarded packets |
| A | 0 | 114 | 0 |
| B | 0 | 114 | 0 |
| C | 0 | 114 | 0 |
| D | 0 | 114 | 0 |
| Quadrant | Total seconds | Saturated seconds | Saturation percentage |
|---|---|---|---|
| A | 5598 | 10 | 0.178635% |
| B | 5598 | 298 | 5.323330% |
| C | 5598 | 1319 | 23.561986% |
| D | 5598 | 576 | 10.289389% |
Noise dominated data is calculated using 1-second bins in cleaned event files. If a bin has >2000 counts, and if more than 50% of those come from <1% of pixels, then it is considered to be noise-dominated and hence unusable.
| Quadrant | # 1 sec bins | Bins with >0 counts | Bins with >2000 counts | High rate bins dominated by noise | Noise dominated (total time) | Noise dominated (detector-on time) | Marked lightcurve |
|---|---|---|---|---|---|---|---|
| A | 7211 | 5599 | 0 | 0 | 0.00% | 0.00% | 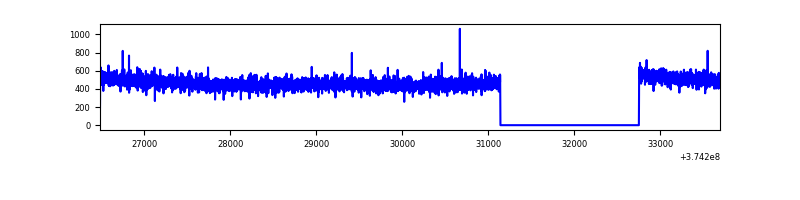 |
| B | 7210 | 5598 | 182 | 182 | 2.52% | 3.25% | 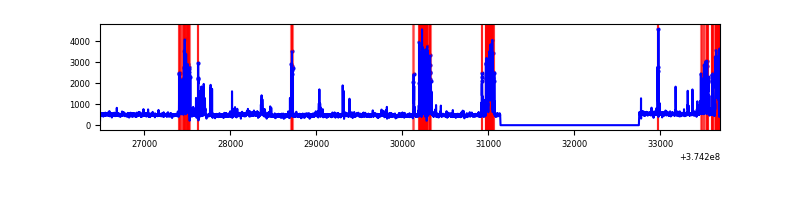 |
| C | 7211 | 5599 | 999 | 999 | 13.85% | 17.84% |  |
| D | 7211 | 5599 | 636 | 636 | 8.82% | 11.36% | 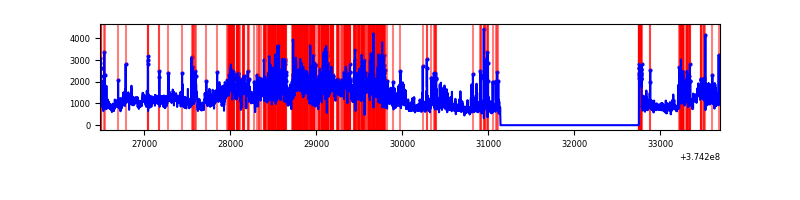 |
Top three noisy pixels from each quadrant. If the there are fewer than three noisy pixels in the level2.evt file, extra rows are filled as -1
| Pixel properties | Quadrant properties | ||||||
|---|---|---|---|---|---|---|---|
| Quadrant | DetID | PixID | Counts | Sigma | Mean | Median | Sigma |
| A | 13 | 254 | 9677 | 66.36 | 671 | 656 | 135.9 |
| A | 3 | 137 | 6339 | 41.8 | 671 | 656 | 135.9 |
| A | 0 | 226 | 5668 | 36.87 | 671 | 656 | 135.9 |
| B | 5 | 172 | 765675 | 6096.71 | 656 | 640 | 125.5 |
| B | 15 | 85 | 53255 | 419.3 | 656 | 640 | 125.5 |
| B | 0 | 189 | 26187 | 203.59 | 656 | 640 | 125.5 |
| C | 8 | 111 | 2571030 | 18969.04 | 585 | 590 | 135.5 |
| C | 1 | 23 | 561155 | 4136.79 | 585 | 590 | 135.5 |
| C | 7 | 221 | 397408 | 2928.39 | 585 | 590 | 135.5 |
| D | 7 | 223 | 2986975 | 18012.37 | 632 | 619 | 165.8 |
| D | 8 | 195 | 727454 | 4383.95 | 632 | 619 | 165.8 |
| D | 2 | 250 | 635314 | 3828.2 | 632 | 619 | 165.8 |
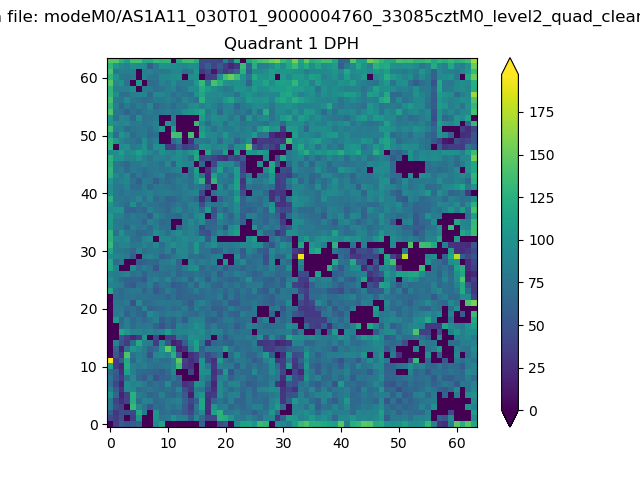
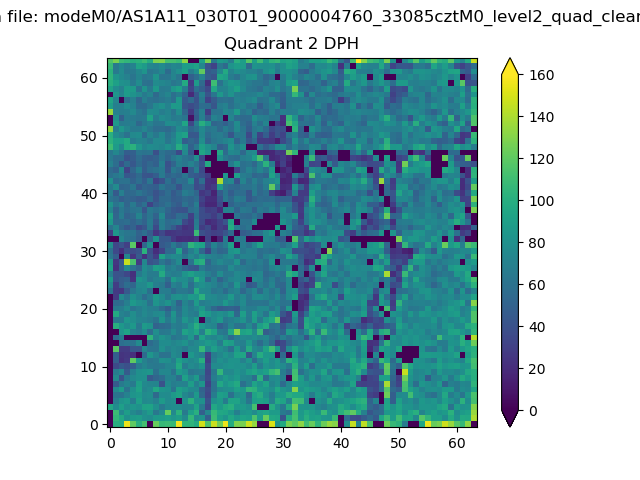
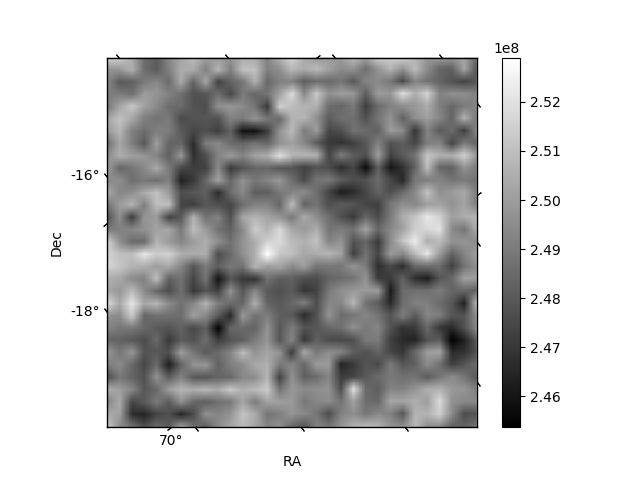
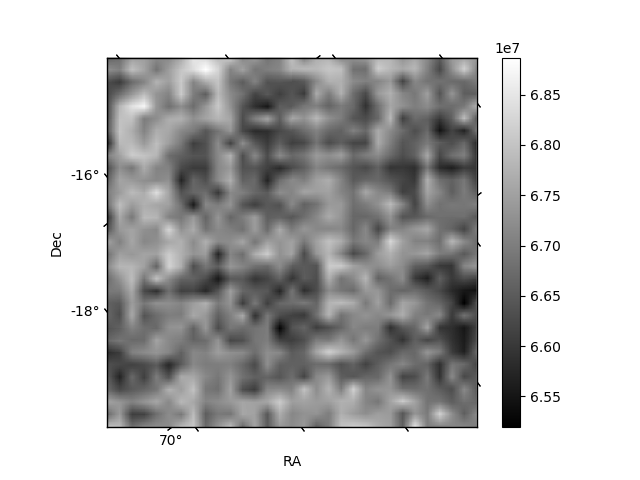
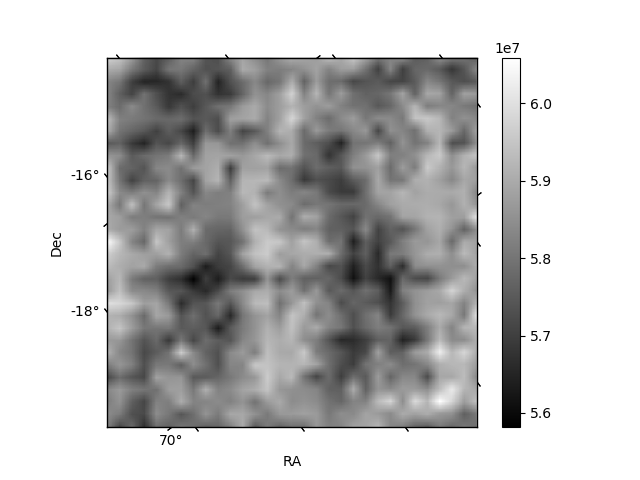
Histogram calculated using DETX and DETY for each event in the final _common_clean file
| Quadrant A | 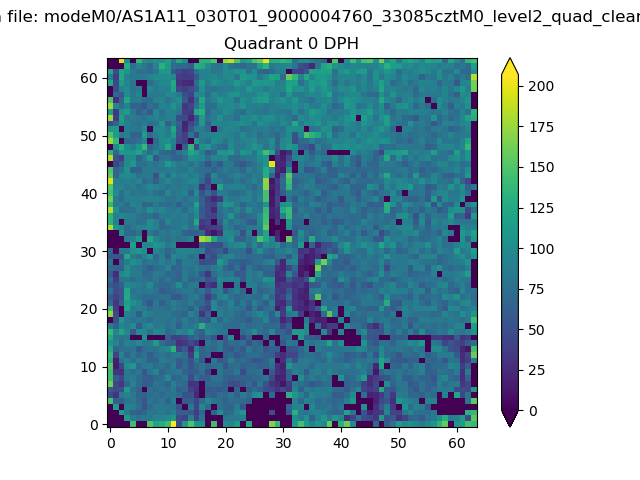 |
 |
Quadrant B |
|---|---|---|---|
| Quadrant D | 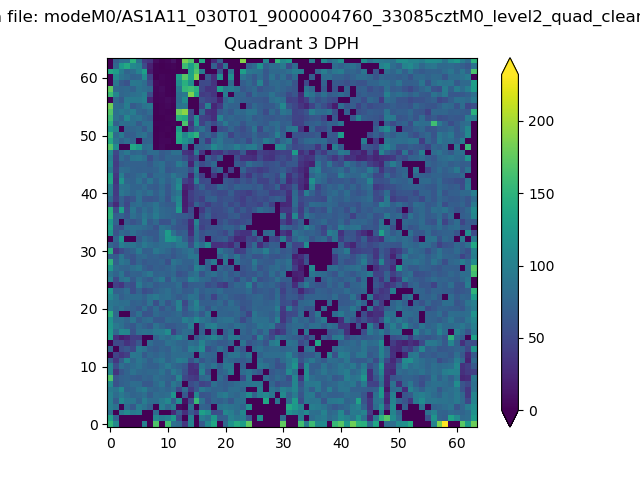 |
 |
Quadrant C |
| Plot type | Count rate plots | Images |
|---|---|---|
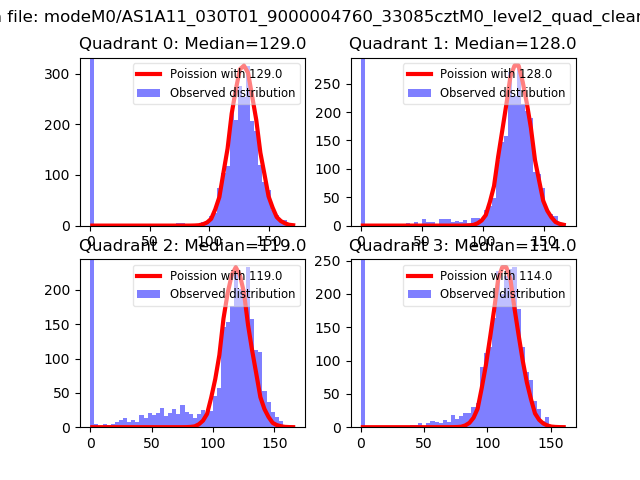
| Comparison with Poisson distribution Blue bars denote a histogram of data divided into 1 sec bins. Red curve is a Poisson curve with rate = median count rate of data. |
 |
 |
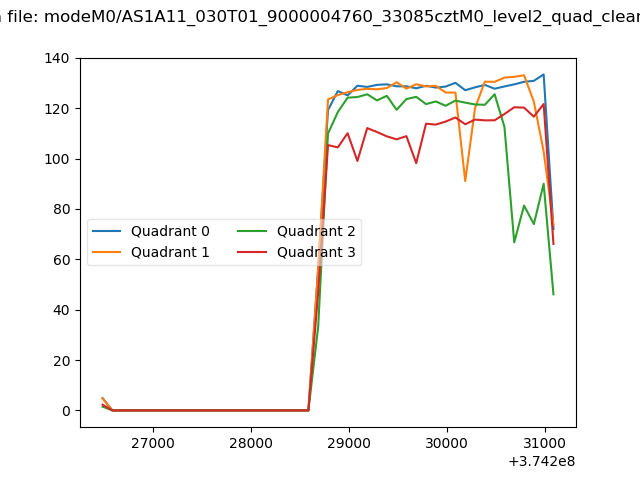
| Quadrant-wise count rates Data is divided into 100 sec bins |
 |
|
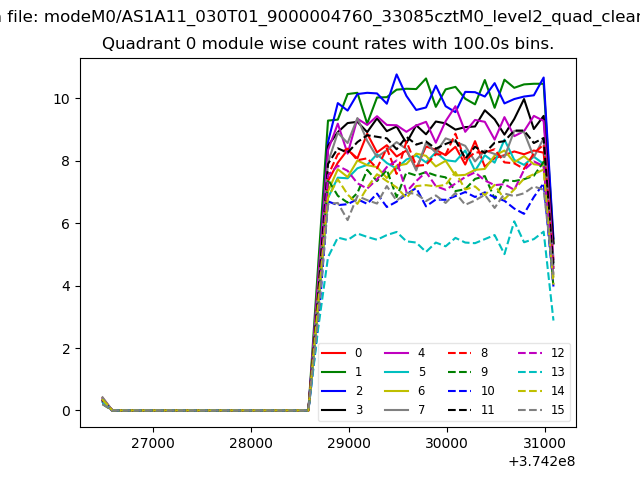
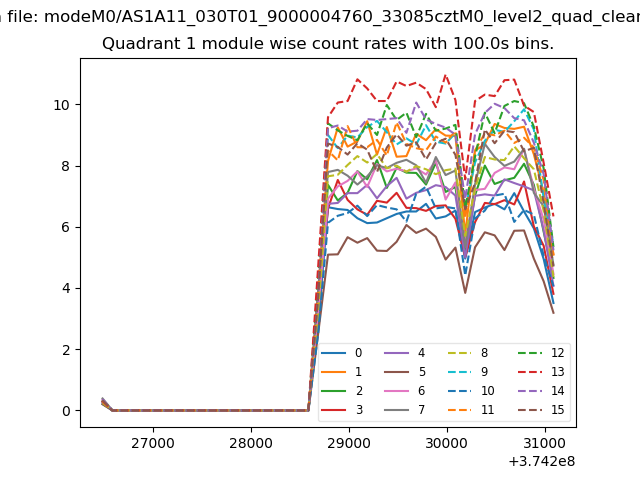
| Module-wise count rates for Quadrant A Data is divided into 100 sec bins |
 |
 |
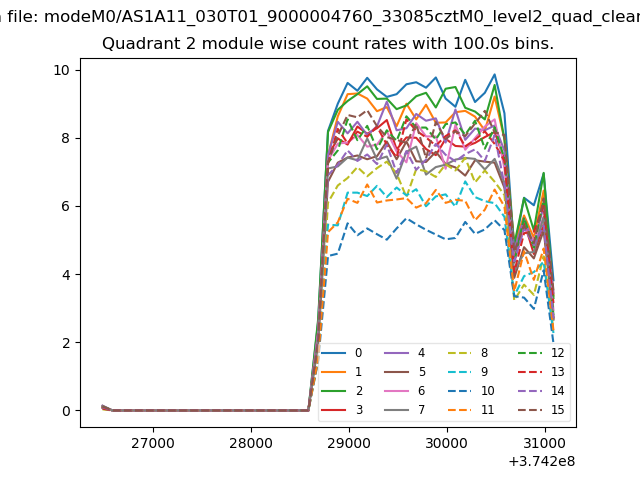
| Module-wise count rates for Quadrant B Data is divided into 100 sec bins |
 |
 |
| Module-wise count rates for Quadrant C Data is divided into 100 sec bins |
 |
 |
| Module-wise count rates for Quadrant D Data is divided into 100 sec bins |
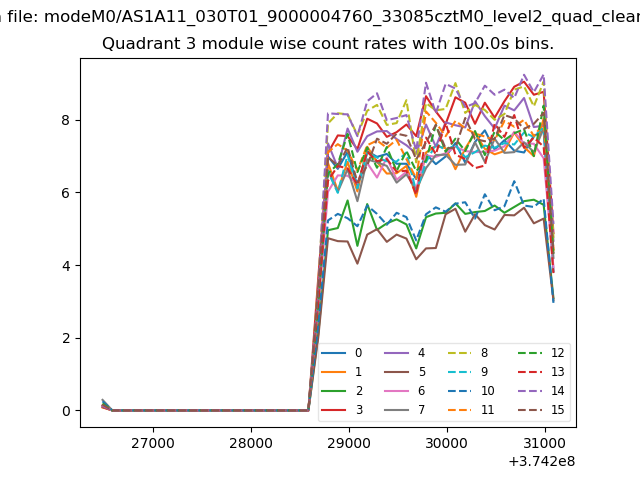 |
 |
| Parameter | Plot |
|---|---|
| CZT HV Monitor | 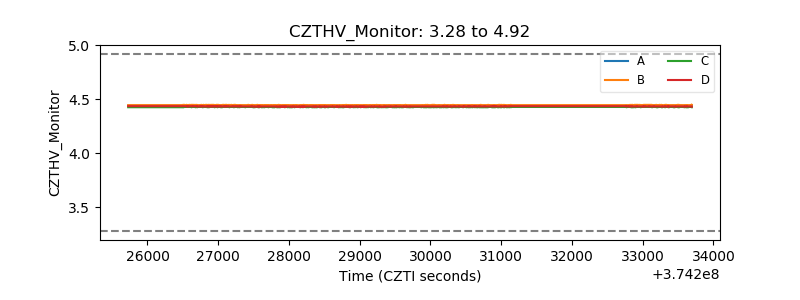 |
| D_VDD | 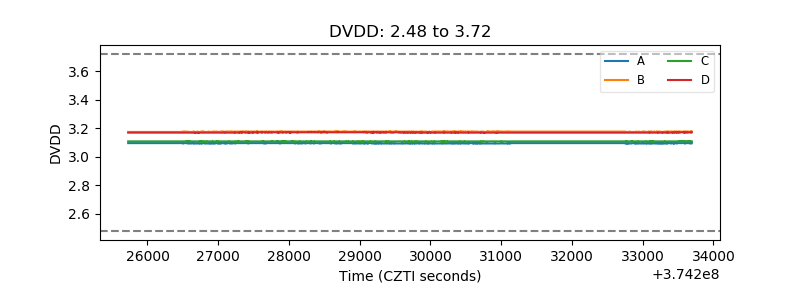 |
| Temperature 1 | 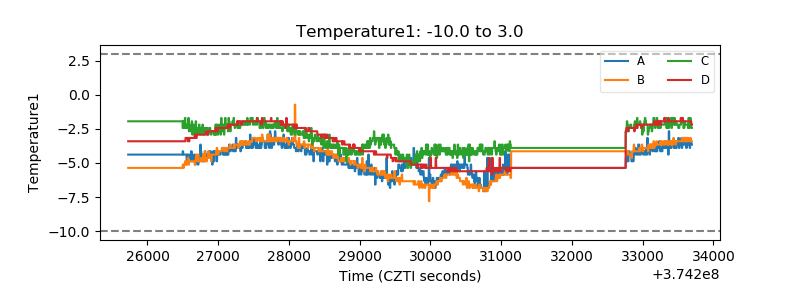 |
| Veto HV Monitor | 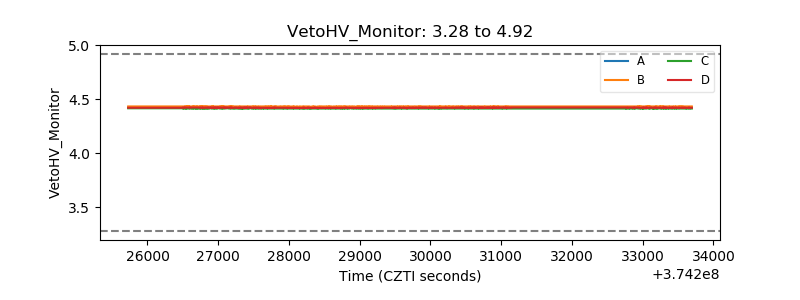 |
| Veto LLD | 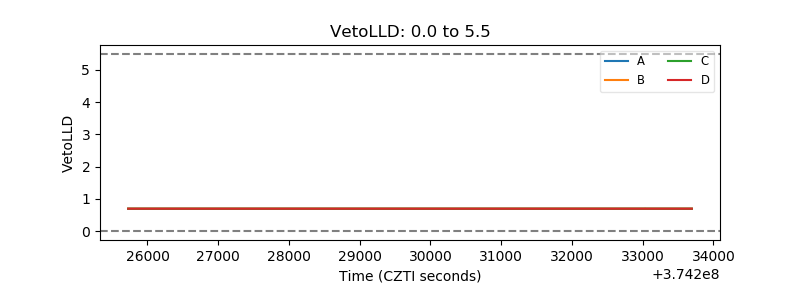 |
| Alpha Counter | 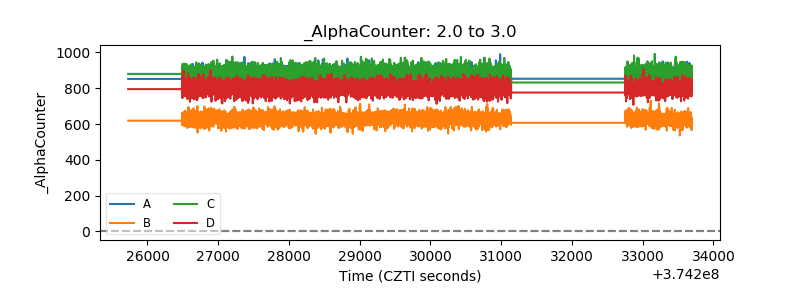 |
| _CPM_Rate | 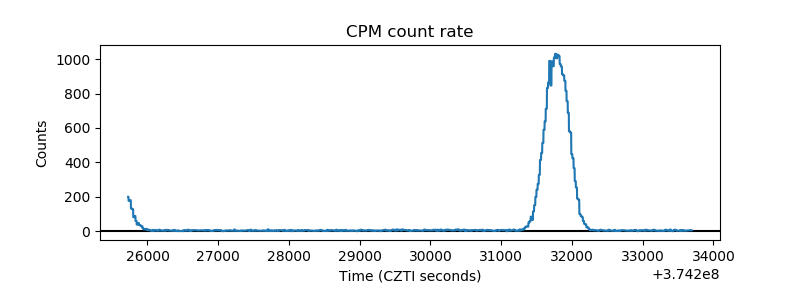 |
| CZT Counter | 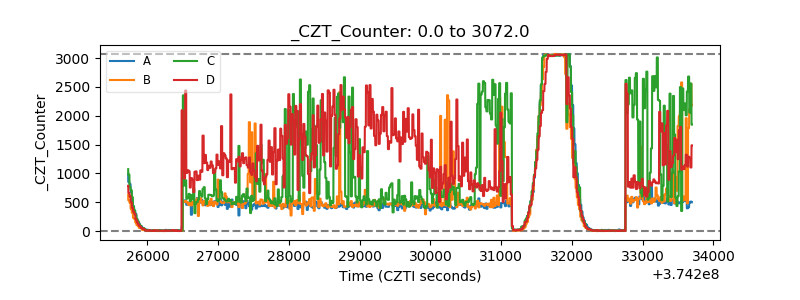 |
| +2.5 Volts monitor |  |
| +5 Volts monitor | 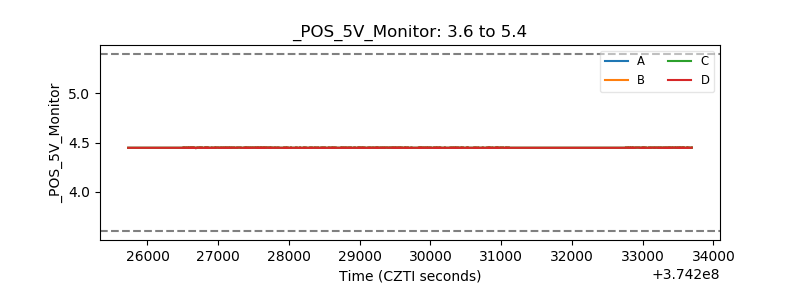 |
| _ROLL_ROT | 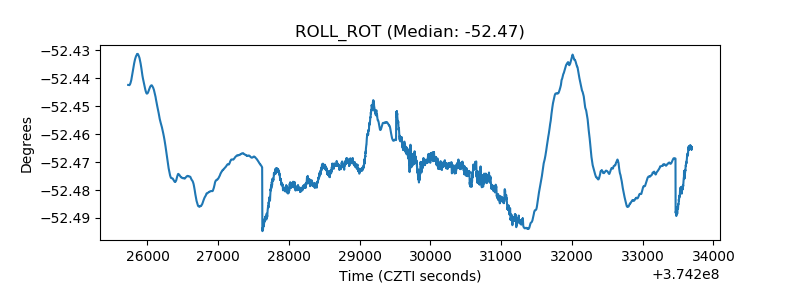 |
| _Roll_DEC |  |
| _Roll_RA | 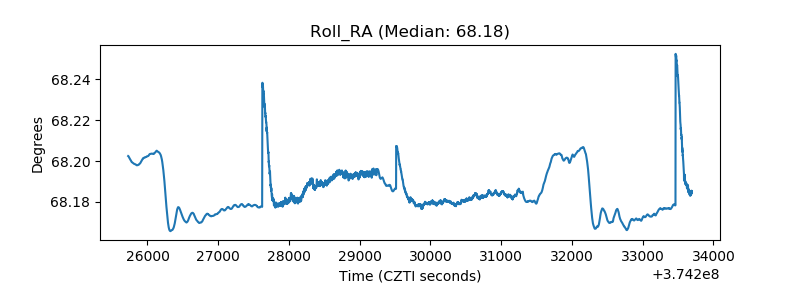 |
| Veto Counter | 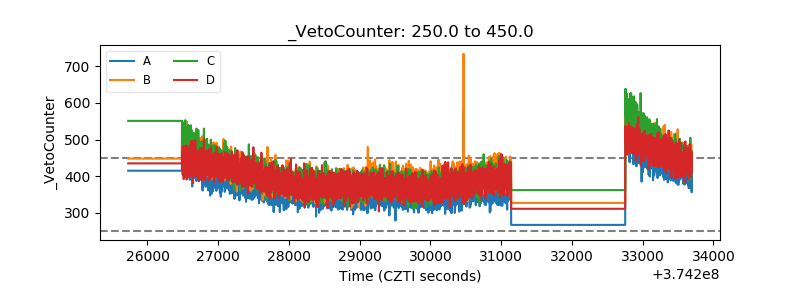 |