| Param | Original file | Final file |
|---|---|---|
| Filename | modeM0/AS1A11_030T01_9000004760_33089cztM0_level2.evt | modeM0/AS1A11_030T01_9000004760_33089cztM0_level2_quad_clean.evt |
| Size (bytes) | 854,058,240 | 69,649,920 |
| Size | 814.5 MB | 66.4 MB |
| Events in quadrant A | 2,598,007 | 513,676 |
| Events in quadrant B | 3,174,524 | 513,404 |
| Events in quadrant C | 7,060,259 | 442,030 |
| Events in quadrant D | 12,692,581 | 284,674 |
| Mode M9 | |||
|---|---|---|---|
| Quadrant | BADHDUFLAG | Total packets | Discarded packets |
| A | 0 | 36 | 0 |
| B | 0 | 36 | 0 |
| C | 0 | 36 | 0 |
| D | 0 | 37 | 0 |
| Mode M0 | |||
|---|---|---|---|
| Quadrant | BADHDUFLAG | Total packets | Discarded packets |
| A | 0 | 10812 | 3 |
| B | 0 | 12577 | 2 |
| C | 0 | 24413 | 2 |
| D | 0 | 41112 | 2 |
| Mode SS | |||
|---|---|---|---|
| Quadrant | BADHDUFLAG | Total packets | Discarded packets |
| A | 0 | 104 | 0 |
| B | 0 | 104 | 0 |
| C | 0 | 104 | 0 |
| D | 0 | 104 | 0 |
| Quadrant | Total seconds | Saturated seconds | Saturation percentage |
|---|---|---|---|
| A | 5036 | 12 | 0.238284% |
| B | 5036 | 170 | 3.375695% |
| C | 5036 | 1785 | 35.444797% |
| D | 5036 | 4893 | 97.160445% |
Noise dominated data is calculated using 1-second bins in cleaned event files. If a bin has >2000 counts, and if more than 50% of those come from <1% of pixels, then it is considered to be noise-dominated and hence unusable.
| Quadrant | # 1 sec bins | Bins with >0 counts | Bins with >2000 counts | High rate bins dominated by noise | Noise dominated (total time) | Noise dominated (detector-on time) | Marked lightcurve |
|---|---|---|---|---|---|---|---|
| A | 7039 | 5037 | 3 | 3 | 0.04% | 0.06% | 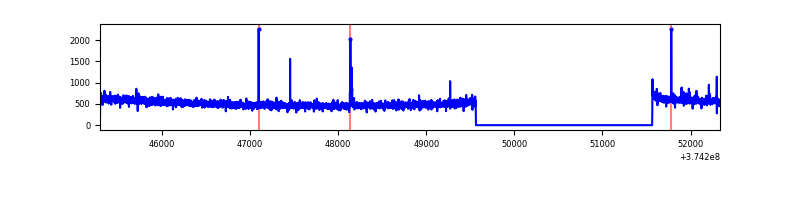 |
| B | 7039 | 5037 | 94 | 94 | 1.34% | 1.87% | 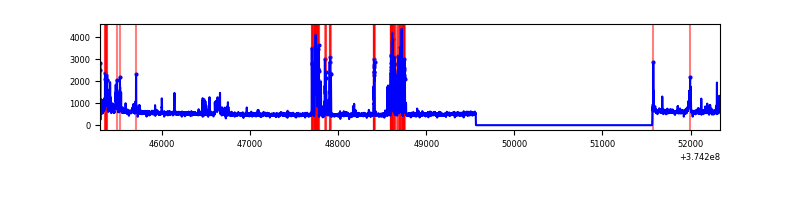 |
| C | 7039 | 5037 | 1403 | 1403 | 19.93% | 27.85% | 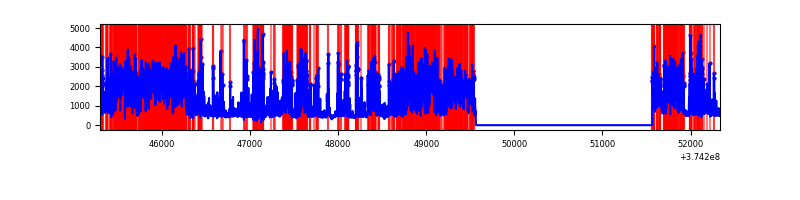 |
| D | 7039 | 5036 | 4767 | 4767 | 67.72% | 94.66% | 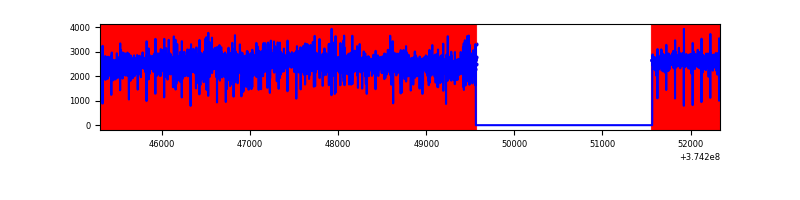 |
Top three noisy pixels from each quadrant. If the there are fewer than three noisy pixels in the level2.evt file, extra rows are filled as -1
| Pixel properties | Quadrant properties | ||||||
|---|---|---|---|---|---|---|---|
| Quadrant | DetID | PixID | Counts | Sigma | Mean | Median | Sigma |
| A | 15 | 169 | 21040 | 155.85 | 665 | 657 | 130.8 |
| A | 13 | 254 | 8411 | 59.29 | 665 | 657 | 130.8 |
| A | 13 | 6 | 7687 | 53.75 | 665 | 657 | 130.8 |
| B | 5 | 172 | 476847 | 3897.15 | 658 | 644 | 122.2 |
| B | 5 | 200 | 52630 | 425.44 | 658 | 644 | 122.2 |
| B | 0 | 189 | 38972 | 313.67 | 658 | 644 | 122.2 |
| C | 8 | 111 | 3592138 | 28994.32 | 539 | 546 | 123.9 |
| C | 7 | 221 | 659387 | 5318.71 | 539 | 546 | 123.9 |
| C | 1 | 23 | 427378 | 3445.74 | 539 | 546 | 123.9 |
| D | 7 | 223 | 10006847 | 94323.55 | 399 | 391 | 106.1 |
| D | 8 | 195 | 571423 | 5382.7 | 399 | 391 | 106.1 |
| D | 12 | 6 | 232657 | 2189.4 | 399 | 391 | 106.1 |
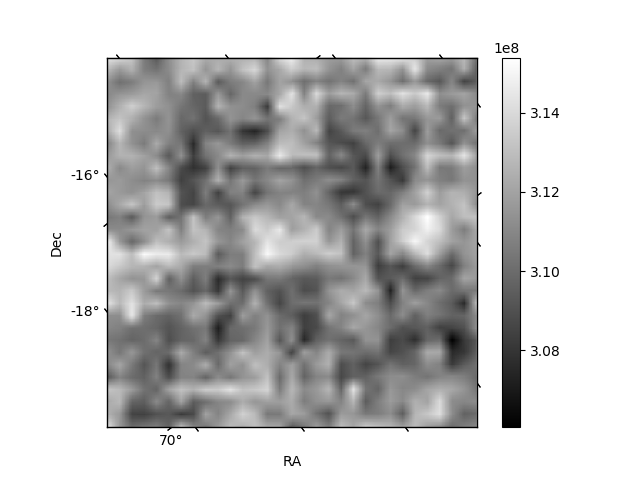
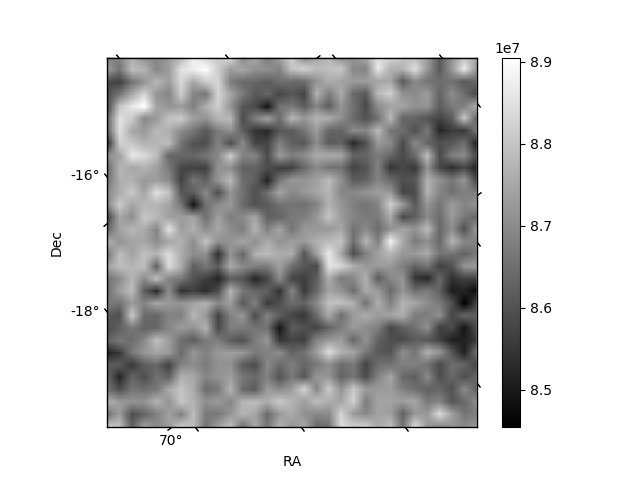
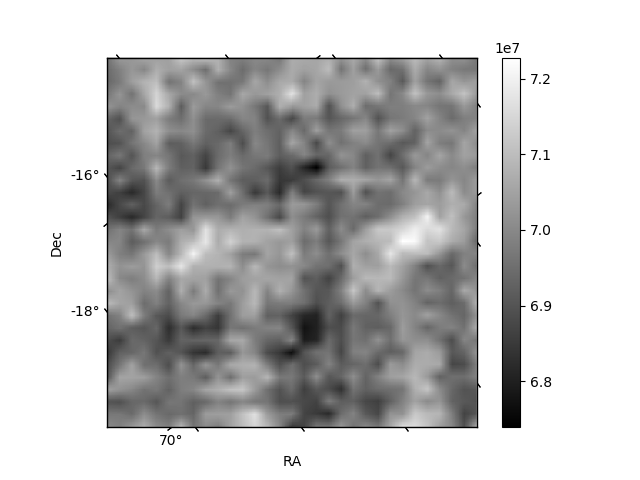
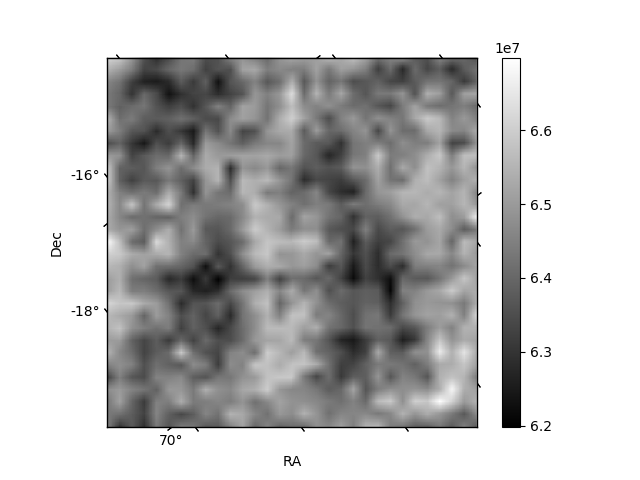
Histogram calculated using DETX and DETY for each event in the final _common_clean file
| Quadrant A | 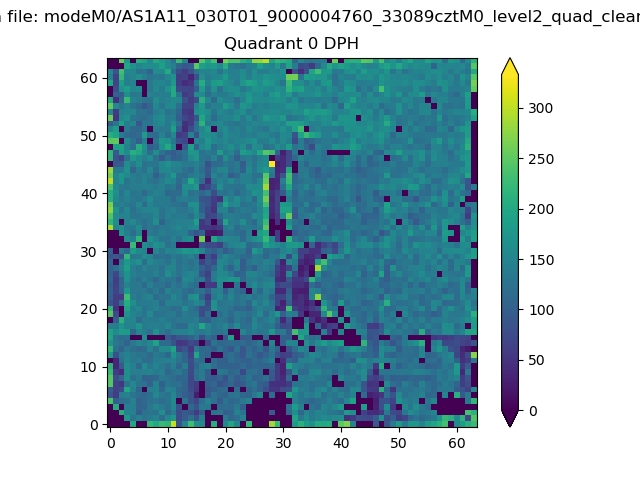 |
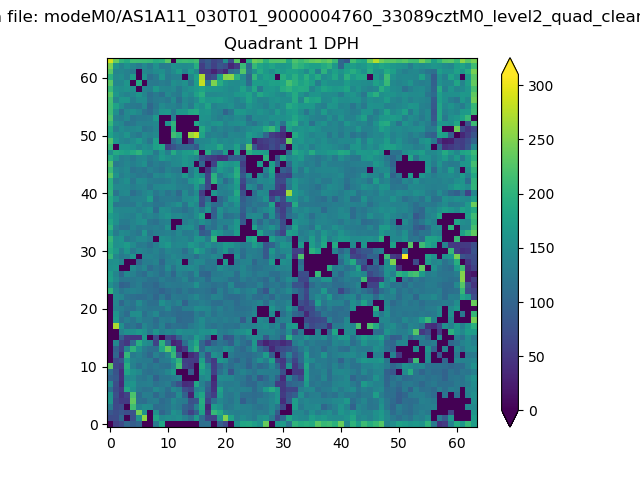 |
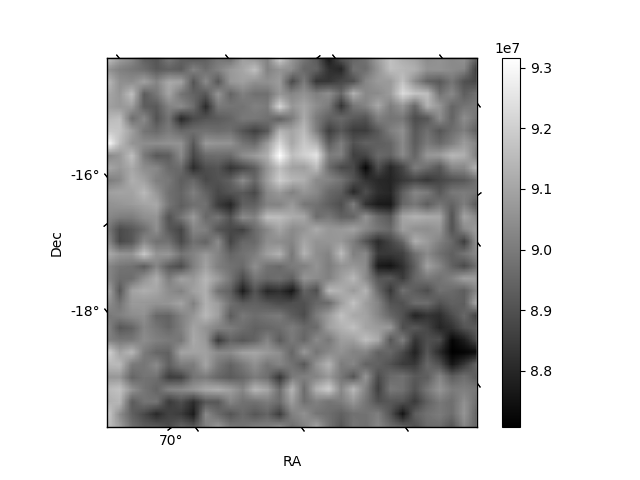
Quadrant B |
|---|---|---|---|
| Quadrant D | 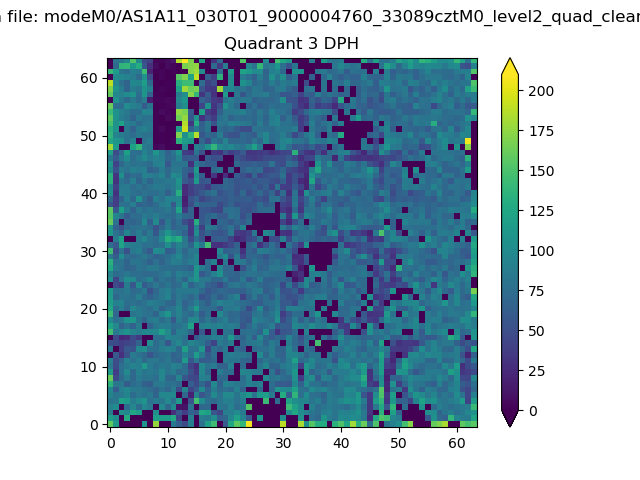 |
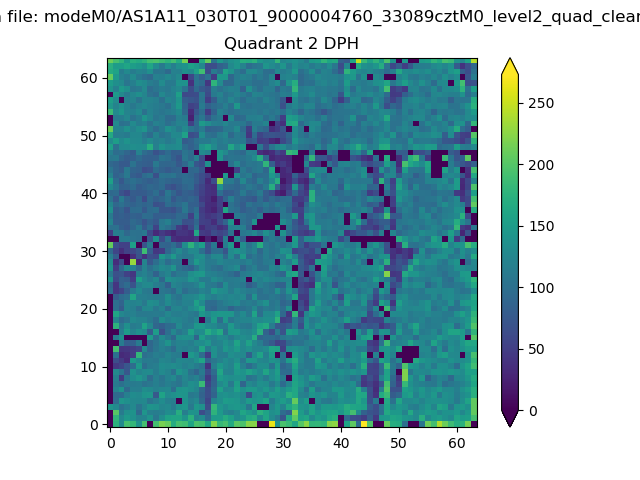 |
Quadrant C |
| Plot type | Count rate plots | Images |
|---|---|---|
| Comparison with Poisson distribution Blue bars denote a histogram of data divided into 1 sec bins. Red curve is a Poisson curve with rate = median count rate of data. |
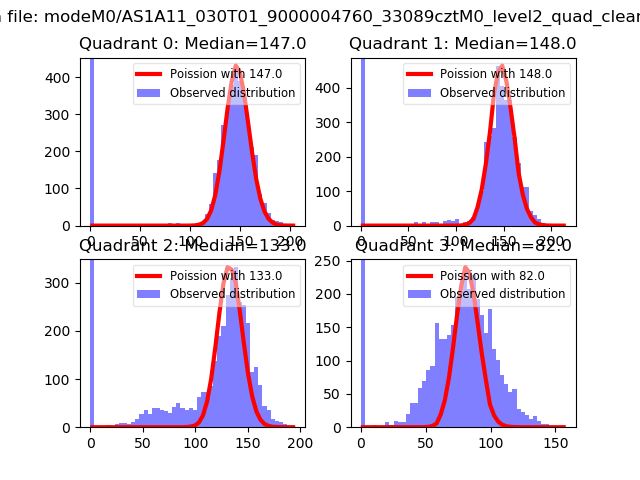 |
 |
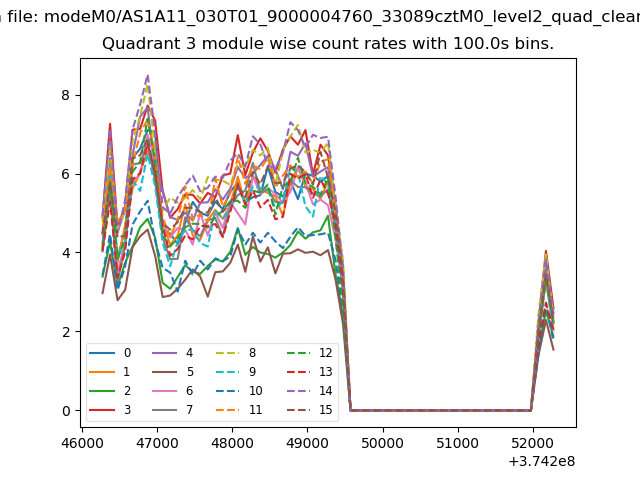
| Quadrant-wise count rates Data is divided into 100 sec bins |
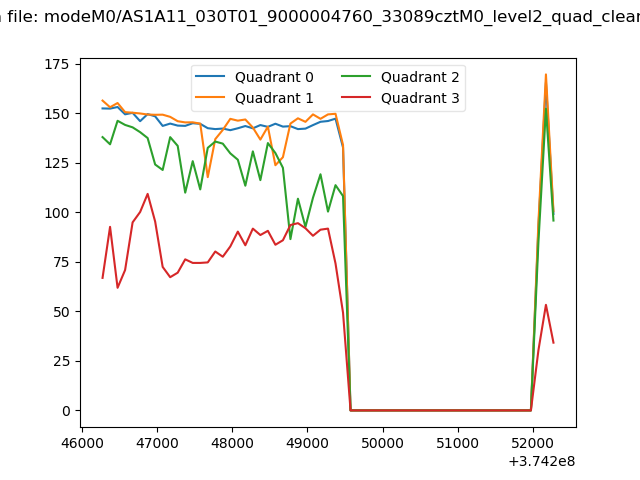 |
|
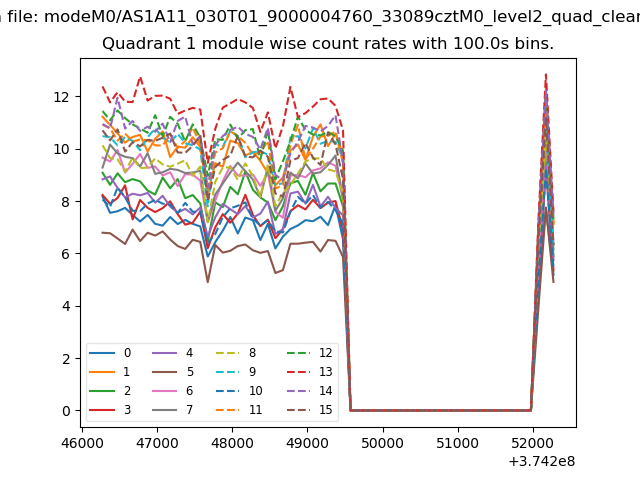
| Module-wise count rates for Quadrant A Data is divided into 100 sec bins |
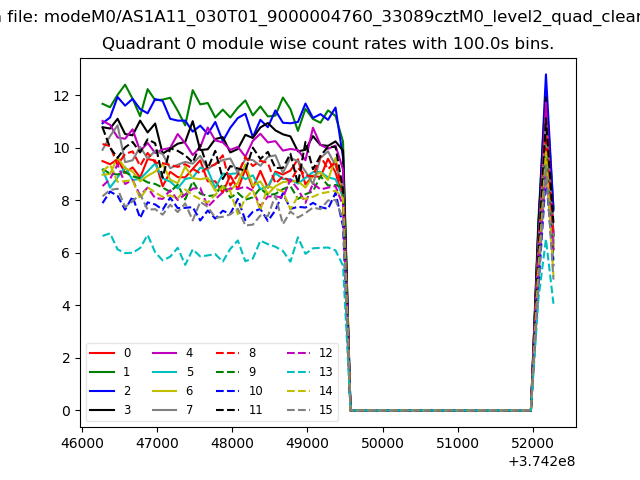 |
 |
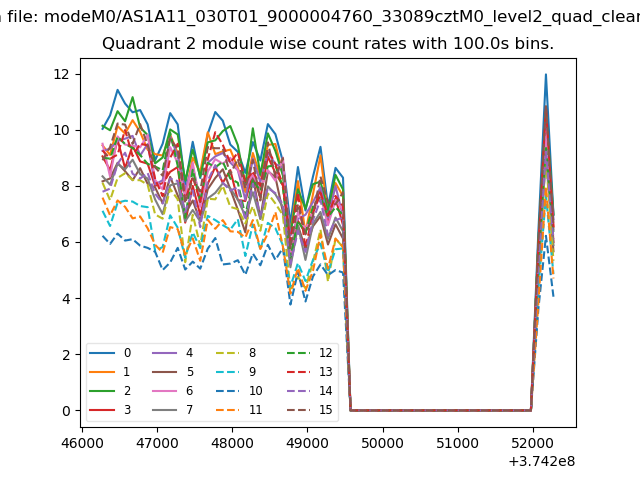
| Module-wise count rates for Quadrant B Data is divided into 100 sec bins |
 |
 |
| Module-wise count rates for Quadrant C Data is divided into 100 sec bins |
 |
 |
| Module-wise count rates for Quadrant D Data is divided into 100 sec bins |
 |
 |
| Parameter | Plot |
|---|---|
| CZT HV Monitor | 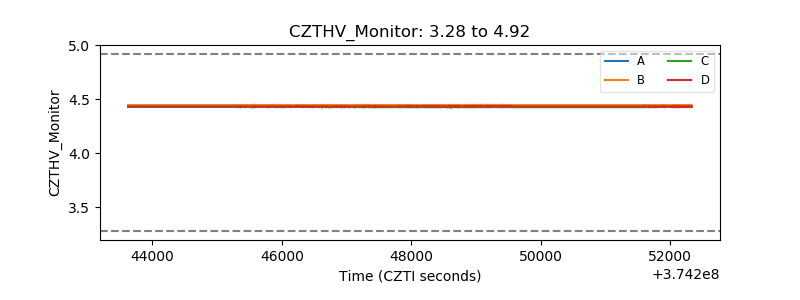 |
| D_VDD |  |
| Temperature 1 | 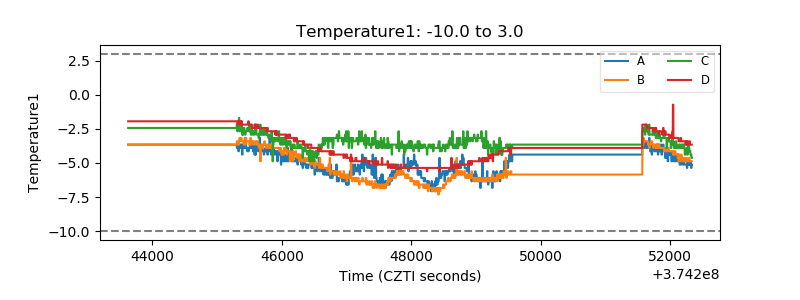 |
| Veto HV Monitor | 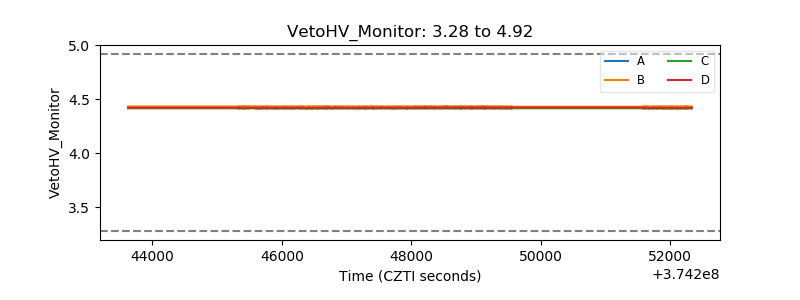 |
| Veto LLD | 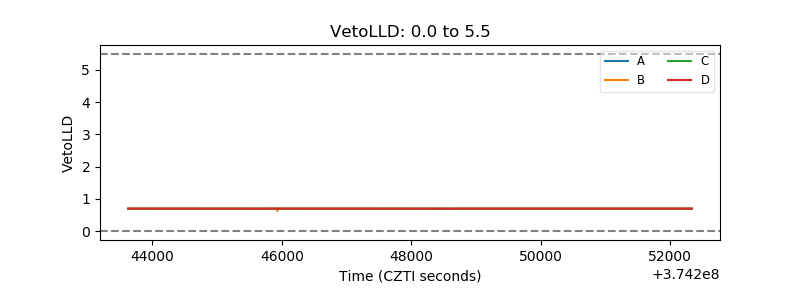 |
| Alpha Counter | 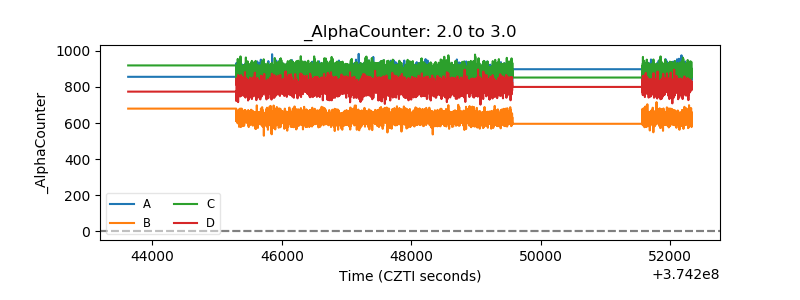 |
| _CPM_Rate | 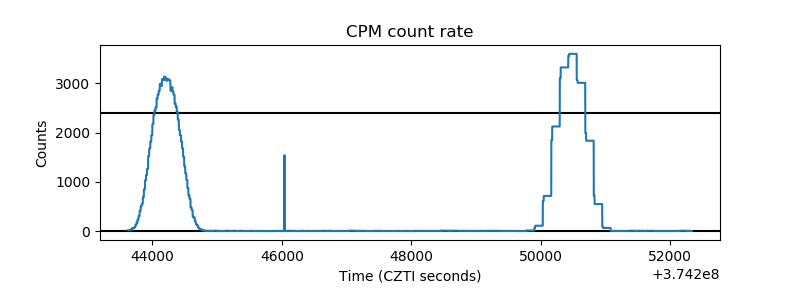 |
| CZT Counter | 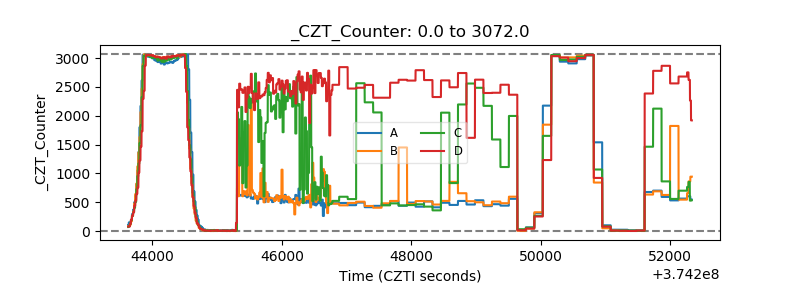 |
| +2.5 Volts monitor |  |
| +5 Volts monitor |  |
| _ROLL_ROT |  |
| _Roll_DEC | 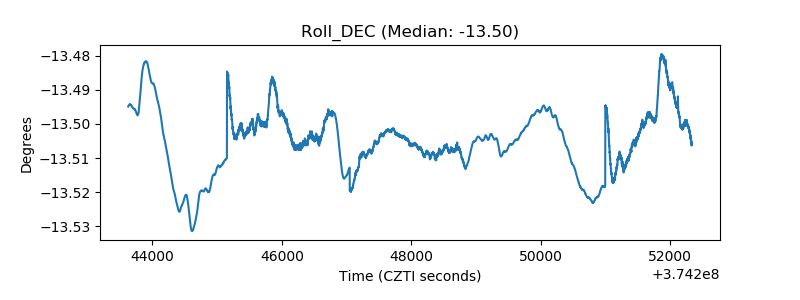 |
| _Roll_RA | 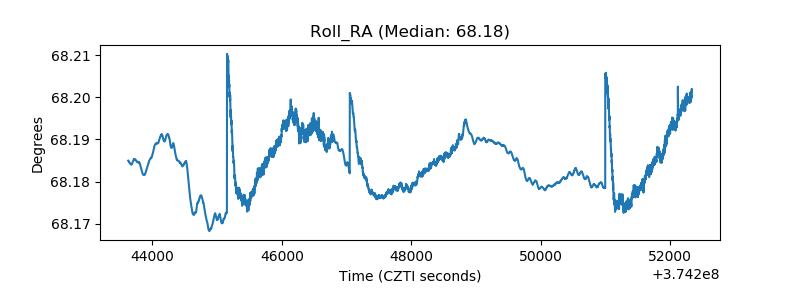 |
| Veto Counter | 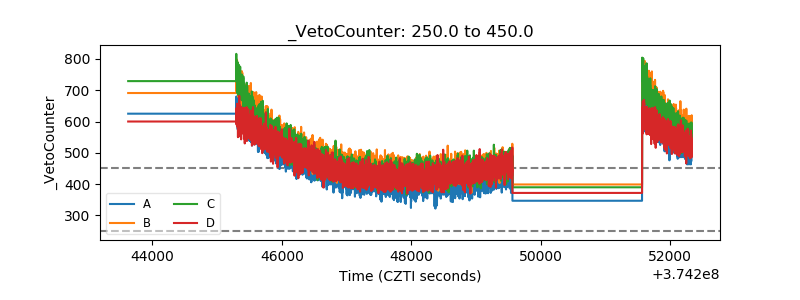 |