| Param | Original file | Final file |
|---|---|---|
| Filename | modeM0/AS1A11_030T01_9000004760_33090cztM0_level2.evt | modeM0/AS1A11_030T01_9000004760_33090cztM0_level2_quad_clean.evt |
| Size (bytes) | 806,811,840 | 85,988,160 |
| Size | 769.4 MB | 82.0 MB |
| Events in quadrant A | 2,663,229 | 669,386 |
| Events in quadrant B | 2,895,091 | 678,487 |
| Events in quadrant C | 5,514,847 | 588,043 |
| Events in quadrant D | 13,017,403 | 308,861 |
| Mode M9 | |||
|---|---|---|---|
| Quadrant | BADHDUFLAG | Total packets | Discarded packets |
| A | 0 | 41 | 0 |
| B | 0 | 41 | 0 |
| C | 0 | 41 | 0 |
| D | 0 | 41 | 0 |
| Mode M0 | |||
|---|---|---|---|
| Quadrant | BADHDUFLAG | Total packets | Discarded packets |
| A | 0 | 10907 | 3 |
| B | 0 | 11776 | 2 |
| C | 0 | 19781 | 2 |
| D | 0 | 42203 | 2 |
| Mode SS | |||
|---|---|---|---|
| Quadrant | BADHDUFLAG | Total packets | Discarded packets |
| A | 0 | 106 | 0 |
| B | 0 | 106 | 0 |
| C | 0 | 106 | 0 |
| D | 0 | 106 | 0 |
| Quadrant | Total seconds | Saturated seconds | Saturation percentage |
|---|---|---|---|
| A | 5093 | 13 | 0.255252% |
| B | 5093 | 50 | 0.981740% |
| C | 5093 | 929 | 18.240723% |
| D | 5093 | 4941 | 97.015511% |
Noise dominated data is calculated using 1-second bins in cleaned event files. If a bin has >2000 counts, and if more than 50% of those come from <1% of pixels, then it is considered to be noise-dominated and hence unusable.
| Quadrant | # 1 sec bins | Bins with >0 counts | Bins with >2000 counts | High rate bins dominated by noise | Noise dominated (total time) | Noise dominated (detector-on time) | Marked lightcurve |
|---|---|---|---|---|---|---|---|
| A | 9188 | 5095 | 5 | 5 | 0.05% | 0.10% | 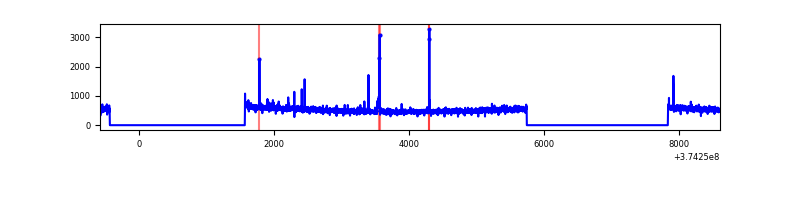 |
| B | 9188 | 5095 | 26 | 26 | 0.28% | 0.51% | 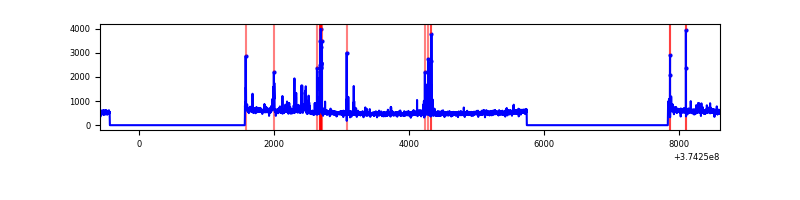 |
| C | 9188 | 5095 | 746 | 746 | 8.12% | 14.64% | 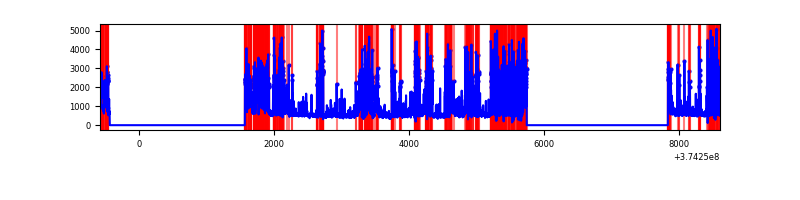 |
| D | 9188 | 5094 | 4862 | 4862 | 52.92% | 95.45% | 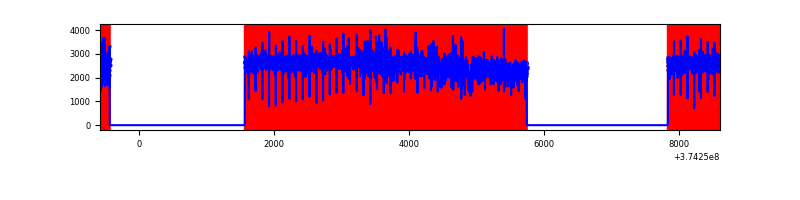 |
Top three noisy pixels from each quadrant. If the there are fewer than three noisy pixels in the level2.evt file, extra rows are filled as -1
| Pixel properties | Quadrant properties | ||||||
|---|---|---|---|---|---|---|---|
| Quadrant | DetID | PixID | Counts | Sigma | Mean | Median | Sigma |
| A | 15 | 169 | 43460 | 320.22 | 675 | 664 | 133.6 |
| A | 13 | 6 | 9399 | 65.36 | 675 | 664 | 133.6 |
| A | 13 | 254 | 9348 | 64.98 | 675 | 664 | 133.6 |
| B | 5 | 200 | 113115 | 896.21 | 673 | 659 | 125.5 |
| B | 5 | 172 | 77165 | 609.71 | 673 | 659 | 125.5 |
| B | 0 | 189 | 24394 | 189.16 | 673 | 659 | 125.5 |
| C | 1 | 23 | 2111299 | 15592.08 | 590 | 599 | 135.4 |
| C | 8 | 111 | 637032 | 4701.43 | 590 | 599 | 135.4 |
| C | 7 | 221 | 257838 | 1900.27 | 590 | 599 | 135.4 |
| D | 7 | 223 | 9640463 | 98423.15 | 370 | 363 | 97.9 |
| D | 8 | 195 | 1006517 | 10272.6 | 370 | 363 | 97.9 |
| D | 12 | 218 | 618361 | 6309.61 | 370 | 363 | 97.9 |
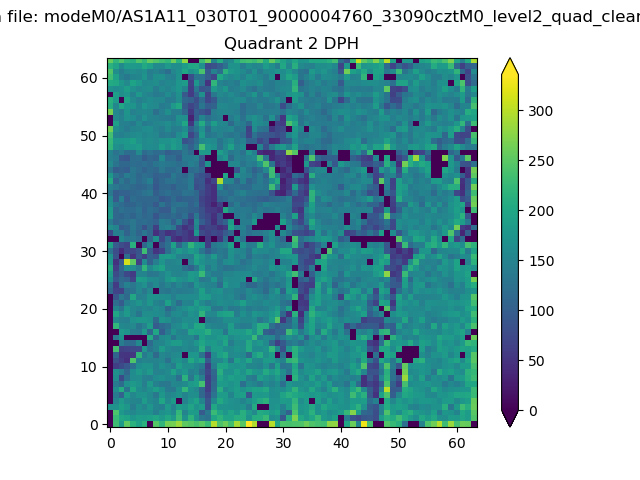
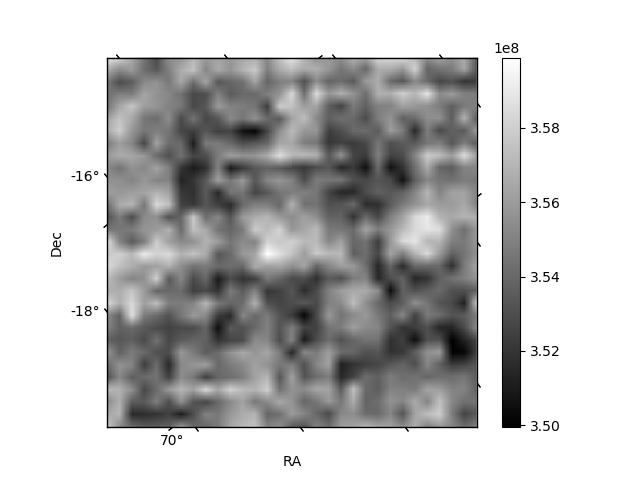
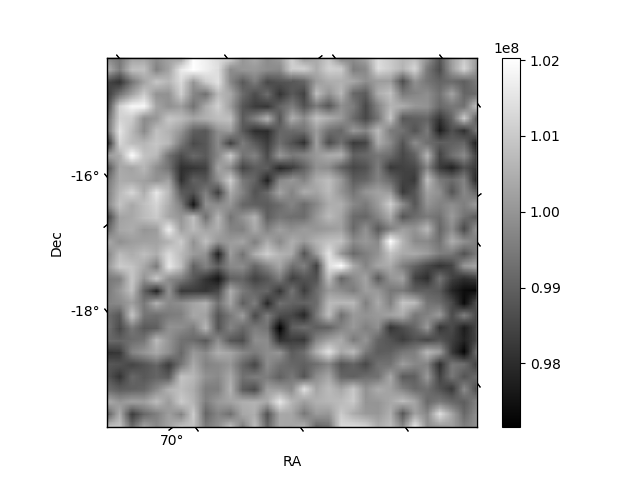
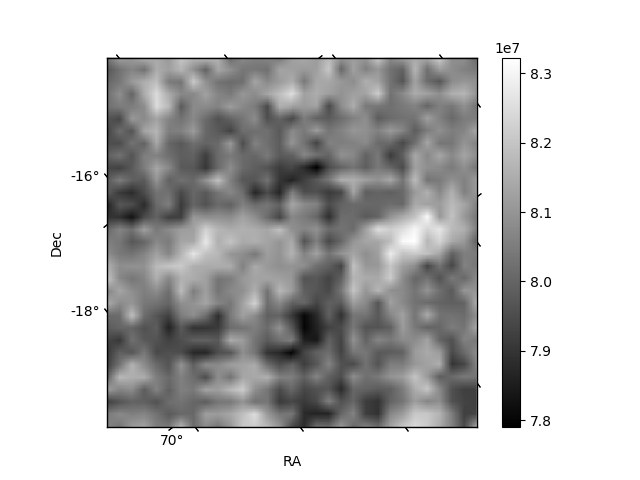
Histogram calculated using DETX and DETY for each event in the final _common_clean file
| Quadrant A | 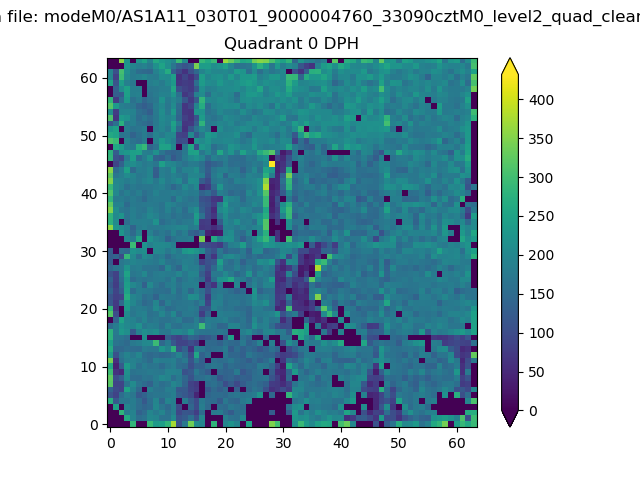 |
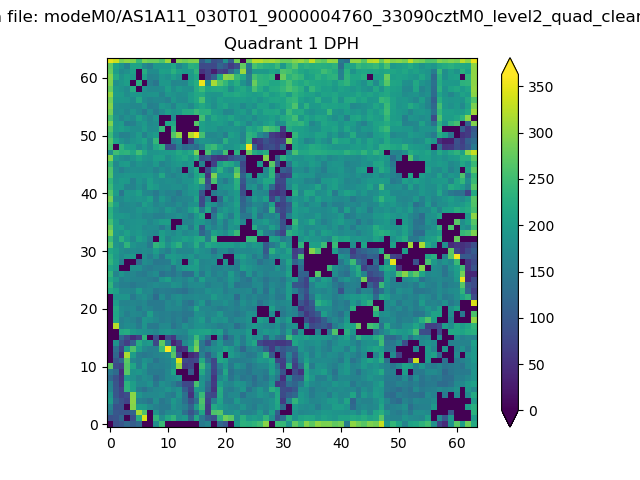 |
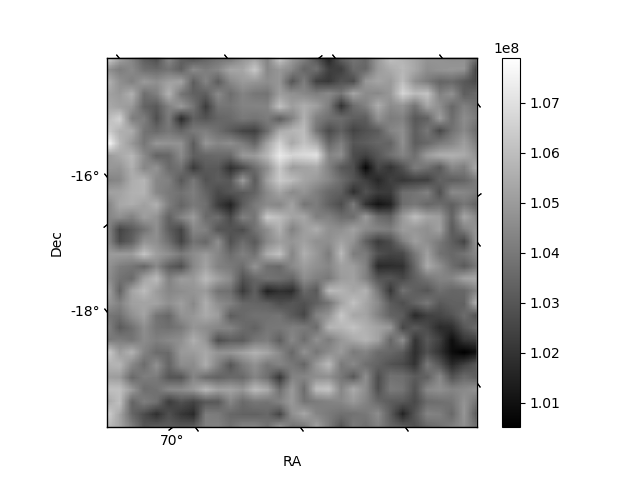
Quadrant B |
|---|---|---|---|
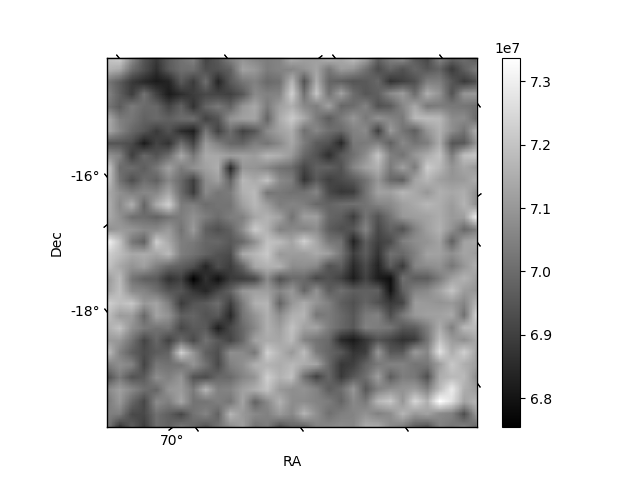
| Quadrant D | 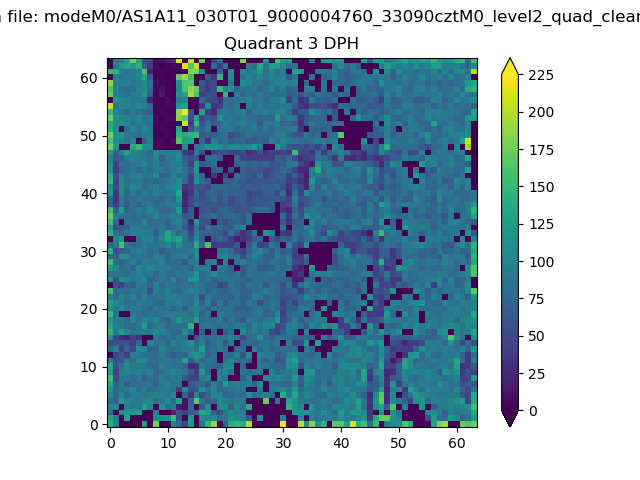 |
 |
Quadrant C |
| Plot type | Count rate plots | Images |
|---|---|---|
| Comparison with Poisson distribution Blue bars denote a histogram of data divided into 1 sec bins. Red curve is a Poisson curve with rate = median count rate of data. |
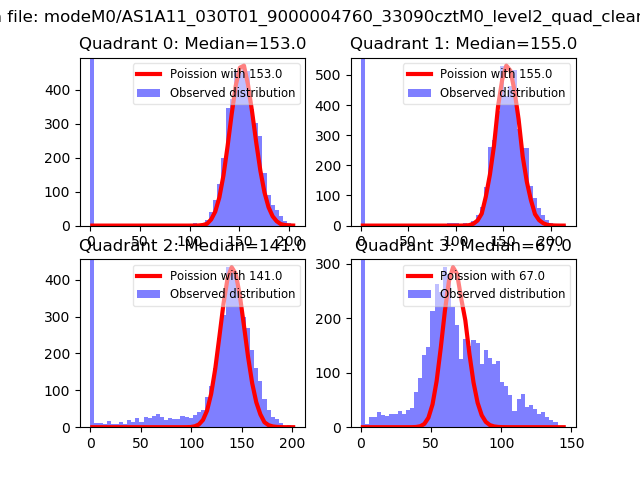 |
 |
| Quadrant-wise count rates Data is divided into 100 sec bins |
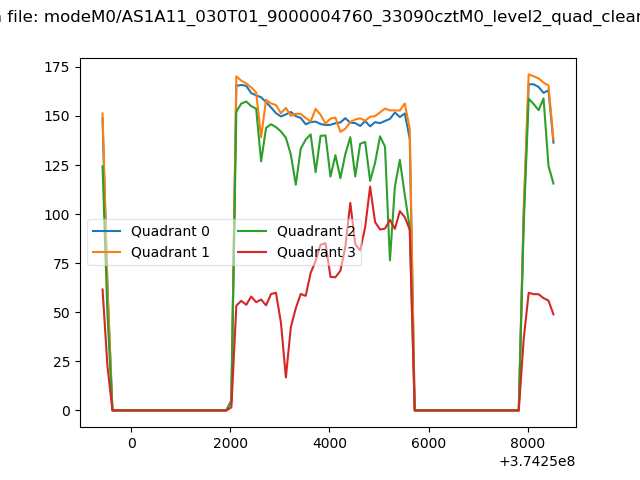 |
|
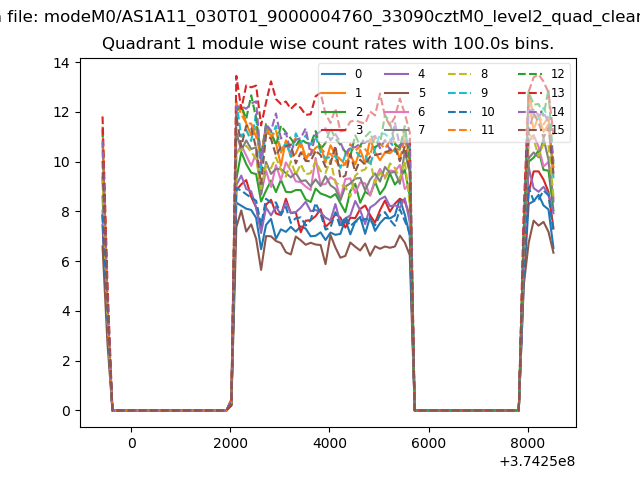
| Module-wise count rates for Quadrant A Data is divided into 100 sec bins |
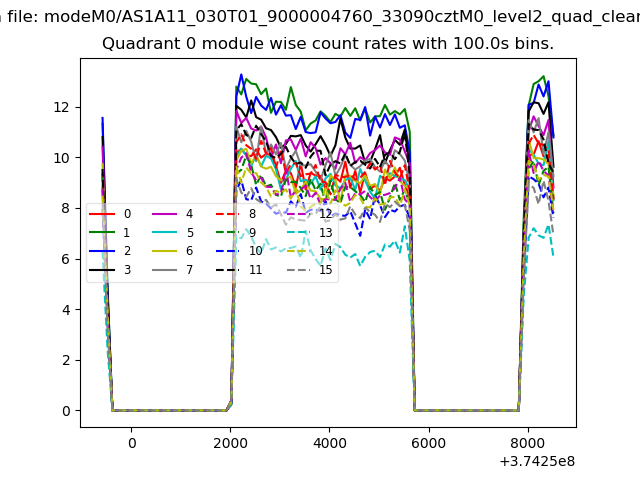 |
 |
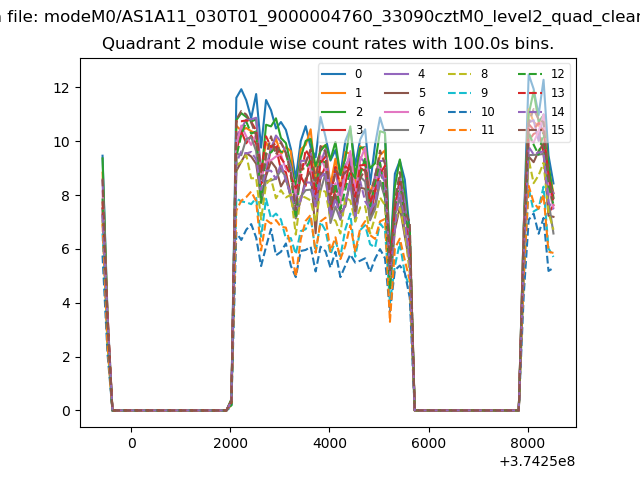
| Module-wise count rates for Quadrant B Data is divided into 100 sec bins |
 |
 |
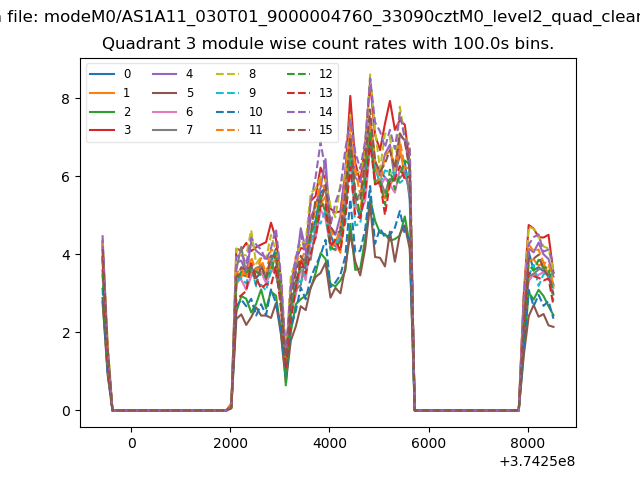
| Module-wise count rates for Quadrant C Data is divided into 100 sec bins |
 |
 |
| Module-wise count rates for Quadrant D Data is divided into 100 sec bins |
 |
 |
| Parameter | Plot |
|---|---|
| CZT HV Monitor | 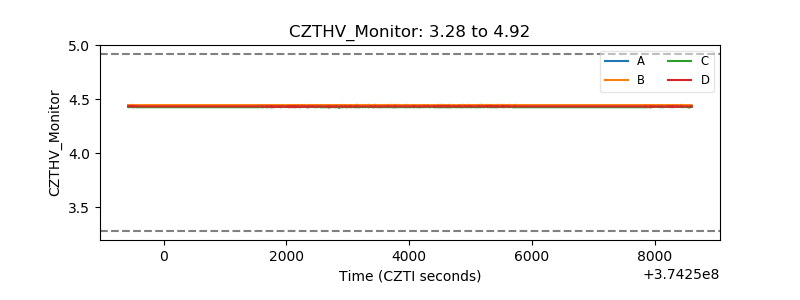 |
| D_VDD | 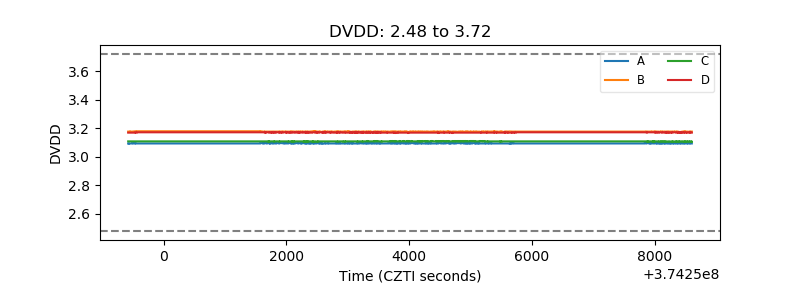 |
| Temperature 1 | 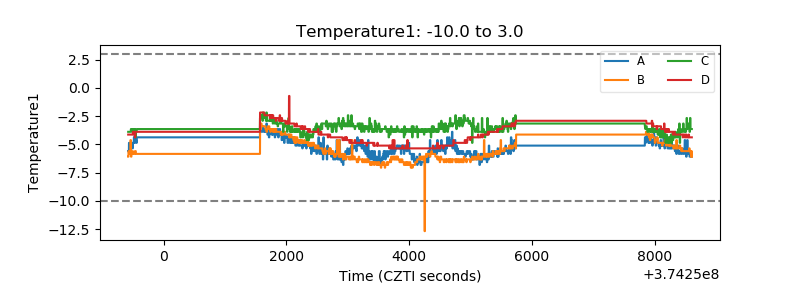 |
| Veto HV Monitor | 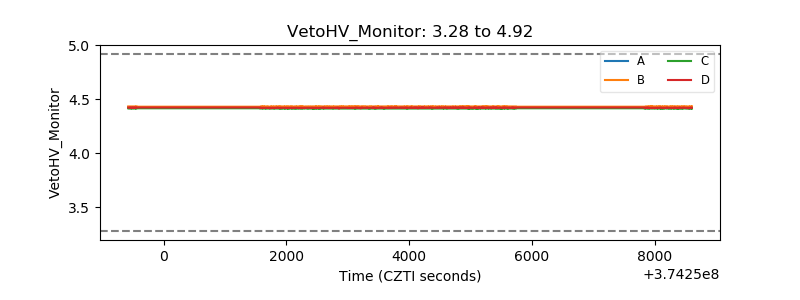 |
| Veto LLD | 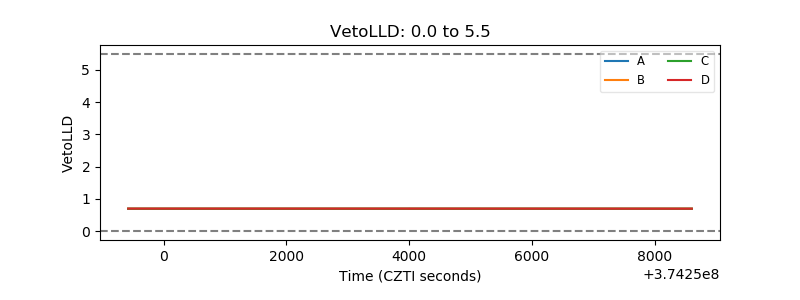 |
| Alpha Counter | 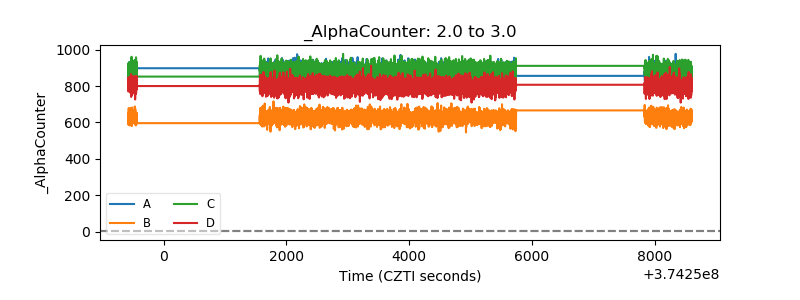 |
| _CPM_Rate | 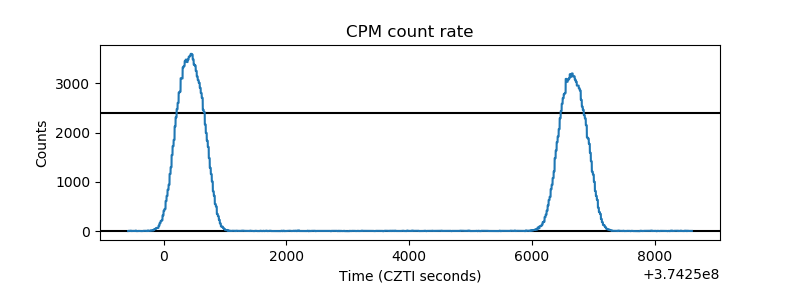 |
| CZT Counter | 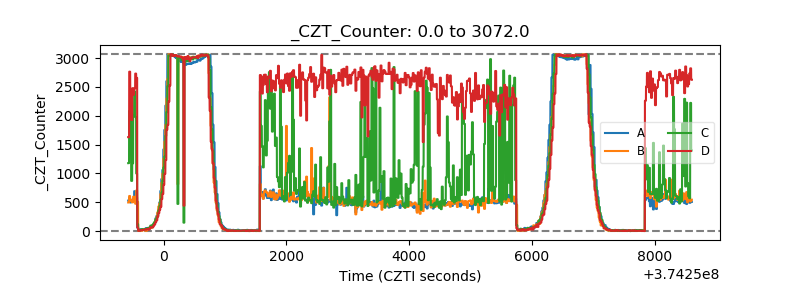 |
| +2.5 Volts monitor |  |
| +5 Volts monitor |  |
| _ROLL_ROT | 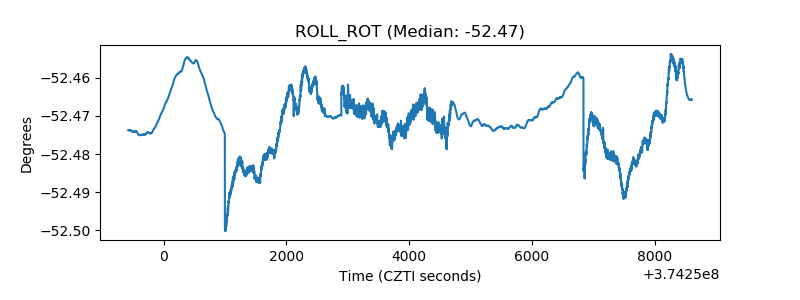 |
| _Roll_DEC | 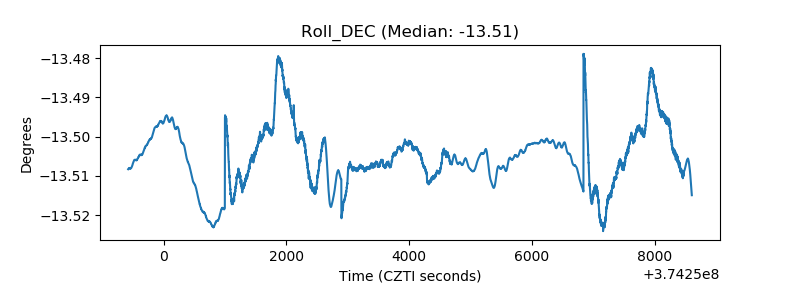 |
| _Roll_RA | 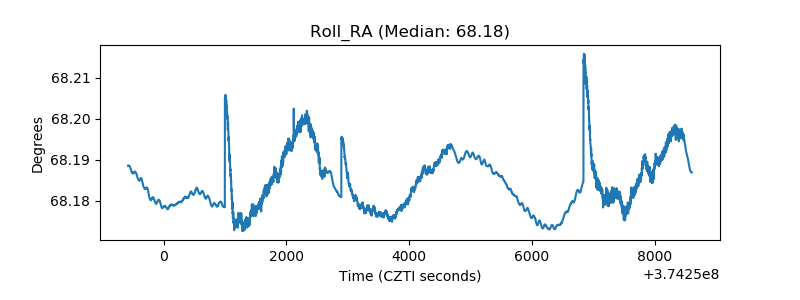 |
| Veto Counter | 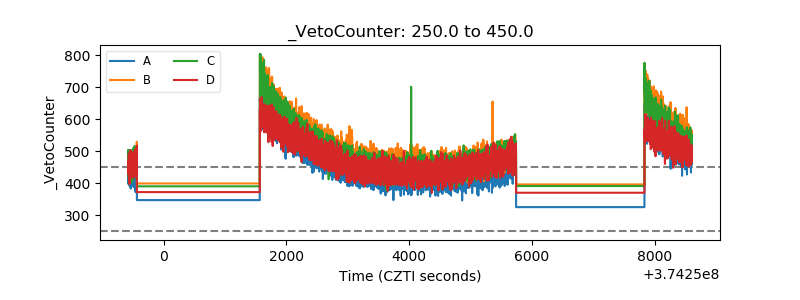 |