| Param | Original file | Final file |
|---|---|---|
| Filename | modeM0/AS1A11_030T01_9000004760_33092cztM0_level2.evt | modeM0/AS1A11_030T01_9000004760_33092cztM0_level2_quad_clean.evt |
| Size (bytes) | 888,796,800 | 84,251,520 |
| Size | 847.6 MB | 80.3 MB |
| Events in quadrant A | 2,699,124 | 625,881 |
| Events in quadrant B | 2,948,207 | 635,878 |
| Events in quadrant C | 6,873,383 | 518,352 |
| Events in quadrant D | 14,011,570 | 369,978 |
| Mode M9 | |||
|---|---|---|---|
| Quadrant | BADHDUFLAG | Total packets | Discarded packets |
| A | 0 | 42 | 0 |
| B | 0 | 42 | 0 |
| C | 0 | 42 | 0 |
| D | 0 | 42 | 0 |
| Mode M0 | |||
|---|---|---|---|
| Quadrant | BADHDUFLAG | Total packets | Discarded packets |
| A | 0 | 11573 | 3 |
| B | 0 | 12165 | 2 |
| C | 0 | 24233 | 2 |
| D | 0 | 45493 | 2 |
| Mode SS | |||
|---|---|---|---|
| Quadrant | BADHDUFLAG | Total packets | Discarded packets |
| A | 0 | 120 | 0 |
| B | 0 | 120 | 0 |
| C | 0 | 120 | 0 |
| D | 0 | 120 | 0 |
| Quadrant | Total seconds | Saturated seconds | Saturation percentage |
|---|---|---|---|
| A | 5700 | 6 | 0.105263% |
| B | 5700 | 41 | 0.719298% |
| C | 5700 | 1618 | 28.385965% |
| D | 5700 | 4962 | 87.052632% |
Noise dominated data is calculated using 1-second bins in cleaned event files. If a bin has >2000 counts, and if more than 50% of those come from <1% of pixels, then it is considered to be noise-dominated and hence unusable.
| Quadrant | # 1 sec bins | Bins with >0 counts | Bins with >2000 counts | High rate bins dominated by noise | Noise dominated (total time) | Noise dominated (detector-on time) | Marked lightcurve |
|---|---|---|---|---|---|---|---|
| A | 9945 | 5702 | 0 | 0 | 0.00% | 0.00% | 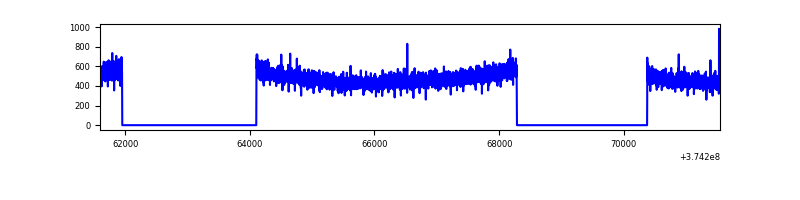 |
| B | 9945 | 5702 | 30 | 30 | 0.30% | 0.53% | 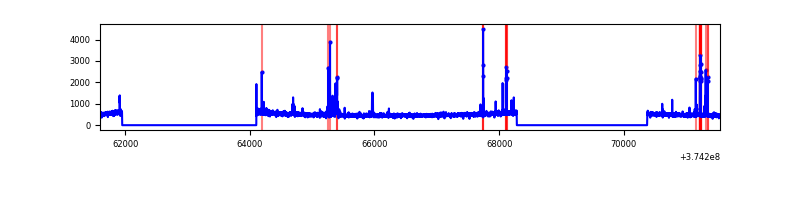 |
| C | 9945 | 5702 | 1322 | 1322 | 13.29% | 23.18% | 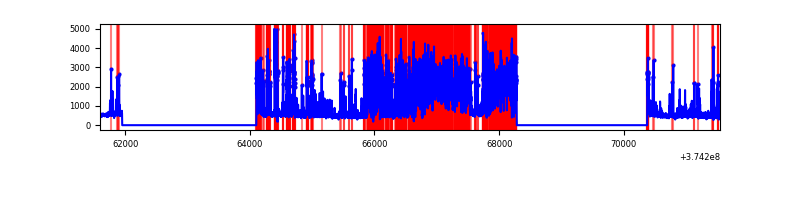 |
| D | 9945 | 5702 | 5276 | 5276 | 53.05% | 92.53% |  |
Top three noisy pixels from each quadrant. If the there are fewer than three noisy pixels in the level2.evt file, extra rows are filled as -1
| Pixel properties | Quadrant properties | ||||||
|---|---|---|---|---|---|---|---|
| Quadrant | DetID | PixID | Counts | Sigma | Mean | Median | Sigma |
| A | 13 | 254 | 10651 | 71.59 | 697 | 684 | 139.2 |
| A | 3 | 137 | 6334 | 40.58 | 697 | 684 | 139.2 |
| A | 0 | 226 | 5888 | 37.38 | 697 | 684 | 139.2 |
| B | 5 | 172 | 140254 | 1050.5 | 699 | 684 | 132.9 |
| B | 0 | 189 | 23325 | 170.41 | 699 | 684 | 132.9 |
| B | 15 | 85 | 16086 | 115.93 | 699 | 684 | 132.9 |
| C | 8 | 111 | 3906040 | 28873.93 | 584 | 590 | 135.3 |
| C | 1 | 23 | 224994 | 1659.07 | 584 | 590 | 135.3 |
| C | 0 | 10 | 170426 | 1255.64 | 584 | 590 | 135.3 |
| D | 7 | 223 | 10734620 | 87670.23 | 467 | 458 | 122.4 |
| D | 8 | 195 | 749591 | 6118.47 | 467 | 458 | 122.4 |
| D | 12 | 218 | 381130 | 3109.1 | 467 | 458 | 122.4 |
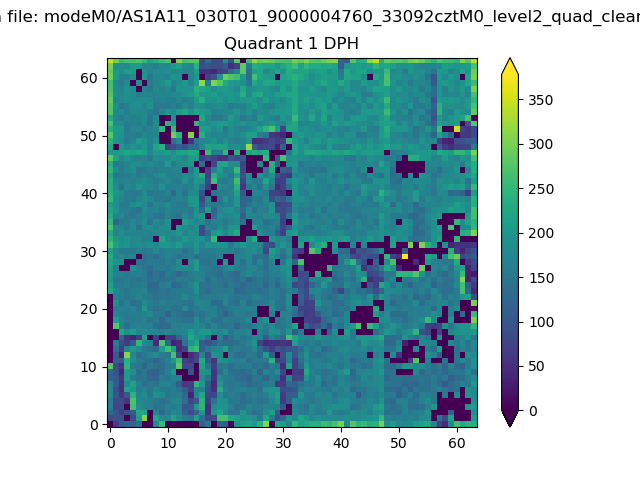
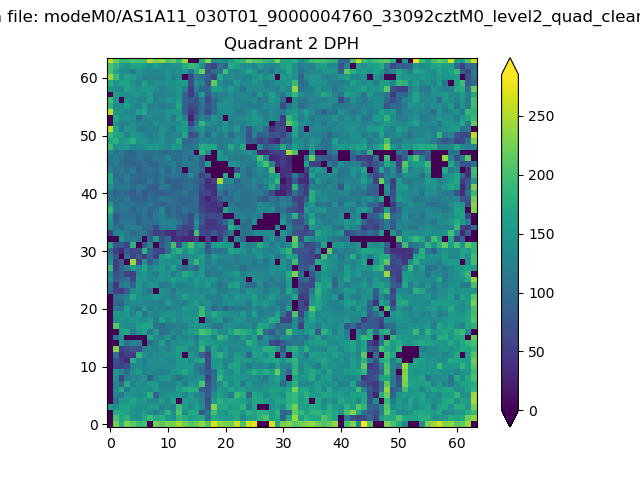
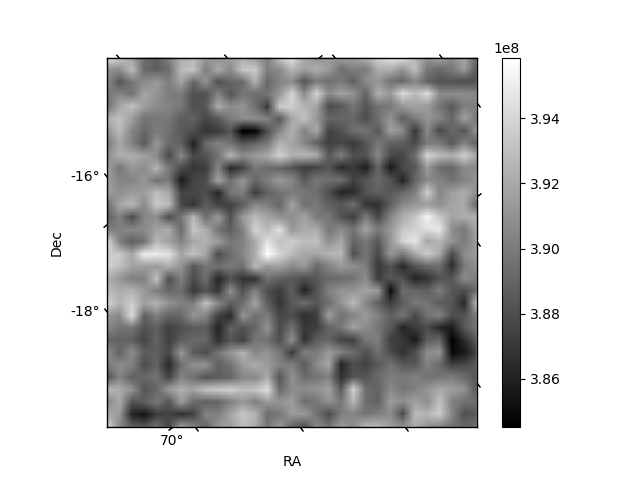
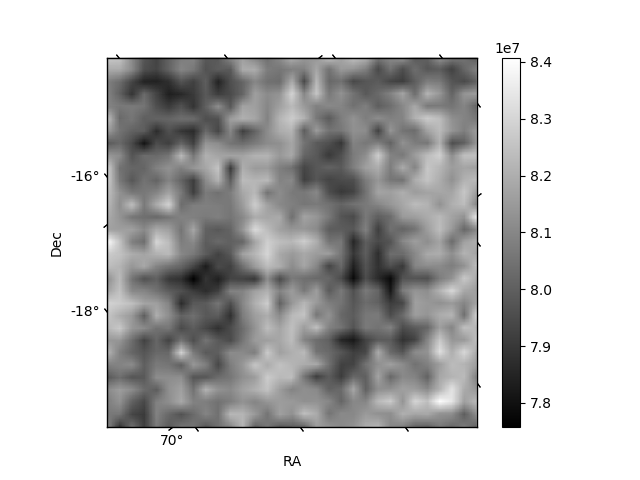
Histogram calculated using DETX and DETY for each event in the final _common_clean file
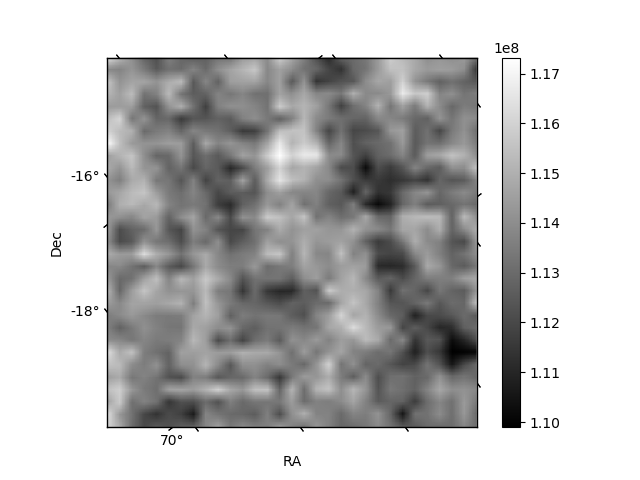
| Quadrant A | 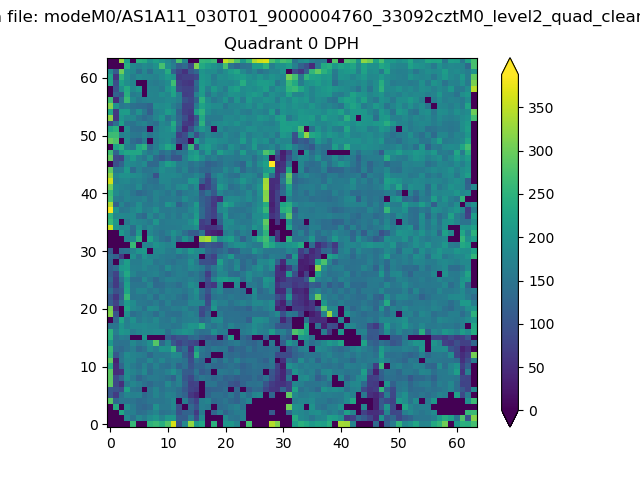 |
 |
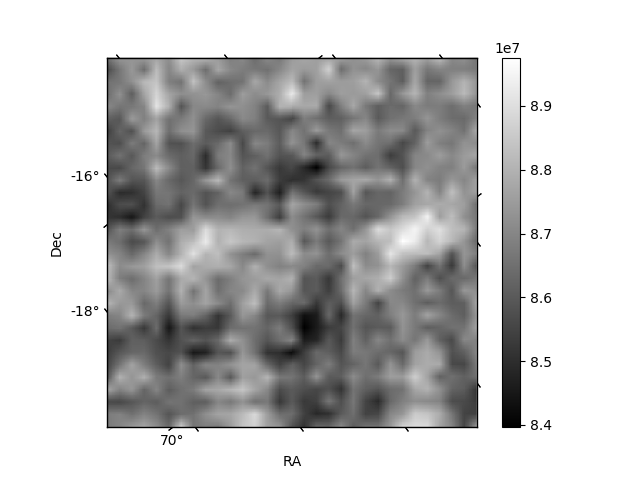
Quadrant B |
|---|---|---|---|
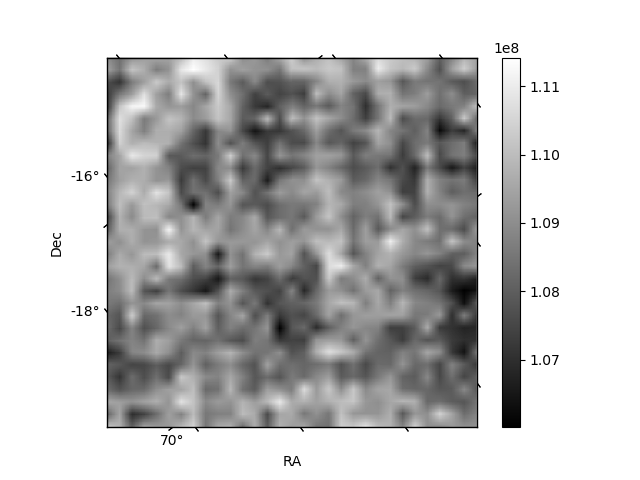
| Quadrant D | 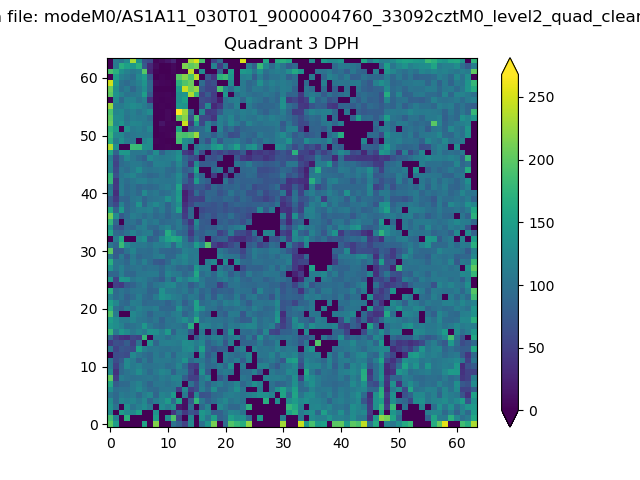 |
 |
Quadrant C |
| Plot type | Count rate plots | Images |
|---|---|---|
| Comparison with Poisson distribution Blue bars denote a histogram of data divided into 1 sec bins. Red curve is a Poisson curve with rate = median count rate of data. |
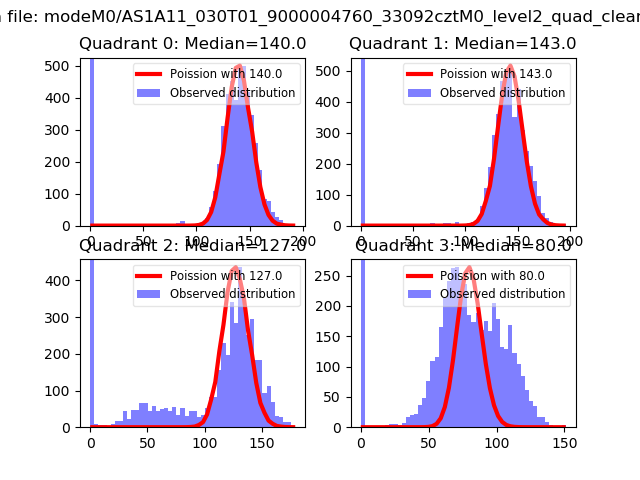 |
 |
| Quadrant-wise count rates Data is divided into 100 sec bins |
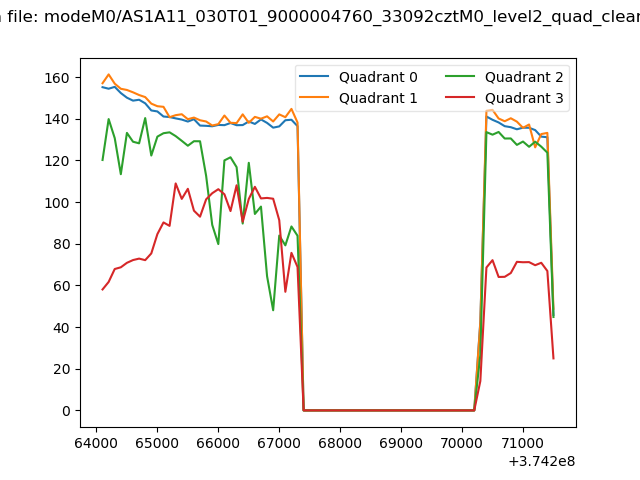 |
|
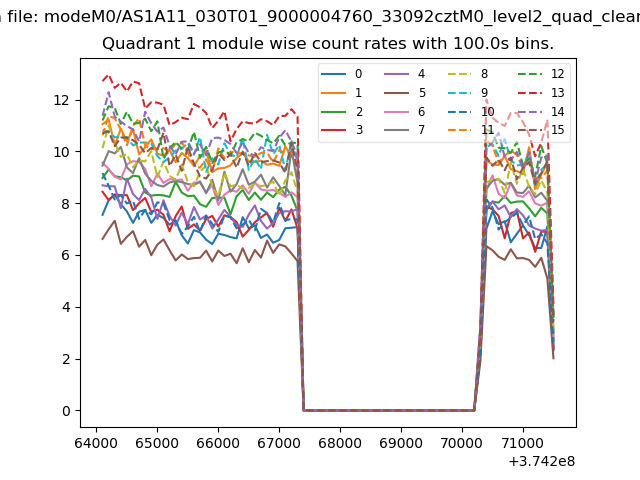
| Module-wise count rates for Quadrant A Data is divided into 100 sec bins |
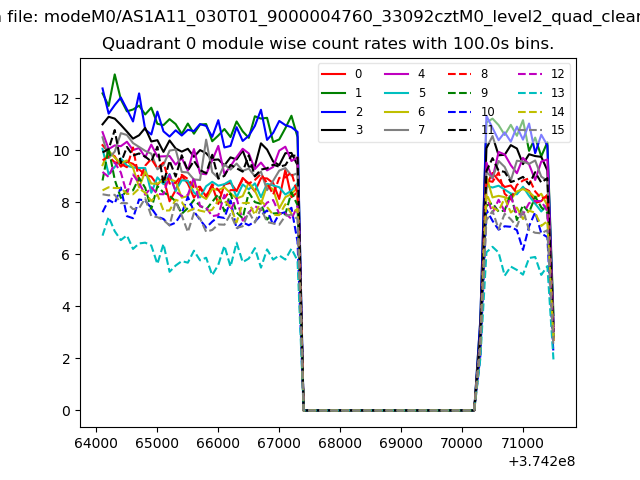 |
 |
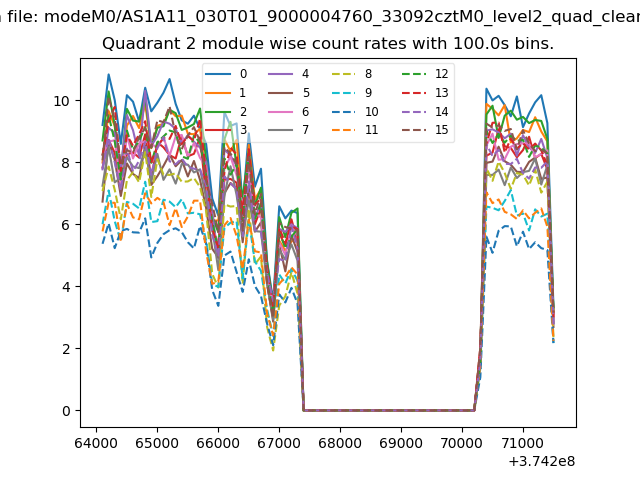
| Module-wise count rates for Quadrant B Data is divided into 100 sec bins |
 |
 |
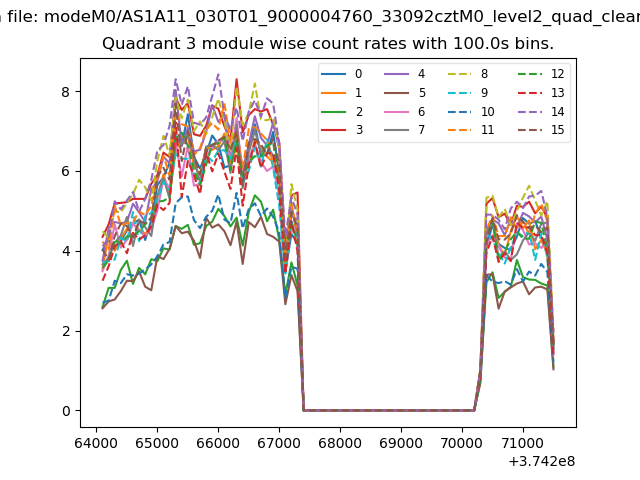
| Module-wise count rates for Quadrant C Data is divided into 100 sec bins |
 |
 |
| Module-wise count rates for Quadrant D Data is divided into 100 sec bins |
 |
 |
| Parameter | Plot |
|---|---|
| CZT HV Monitor | 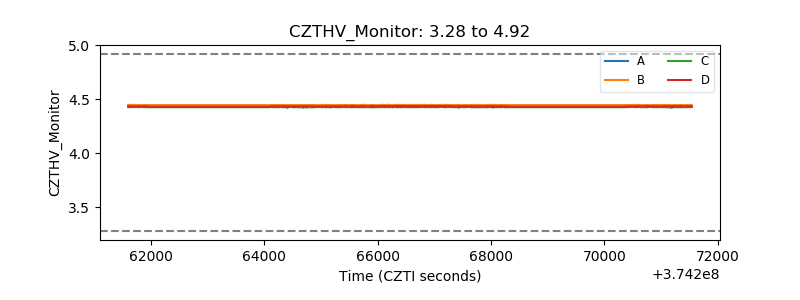 |
| D_VDD |  |
| Temperature 1 | 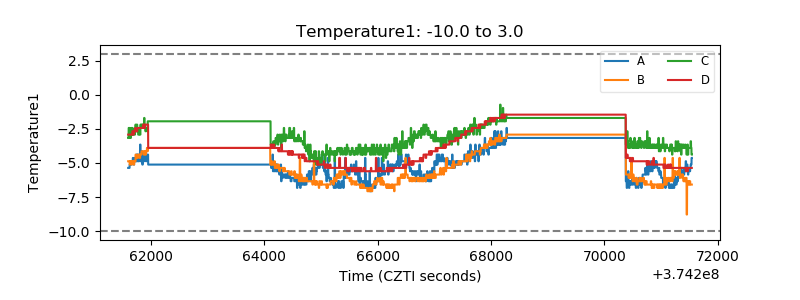 |
| Veto HV Monitor | 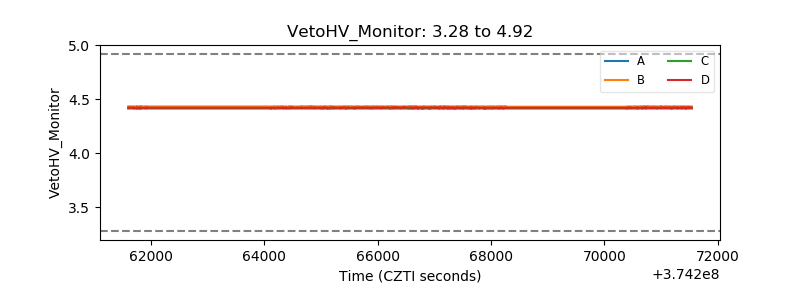 |
| Veto LLD | 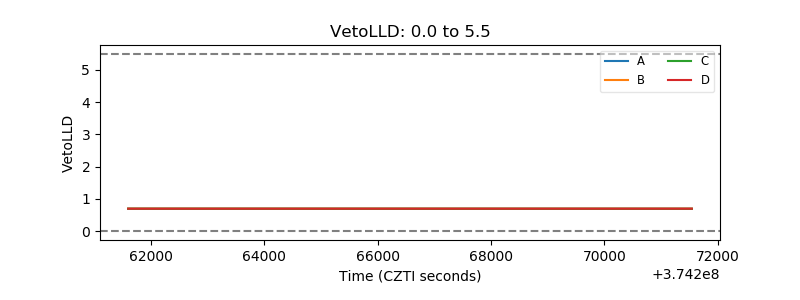 |
| Alpha Counter | 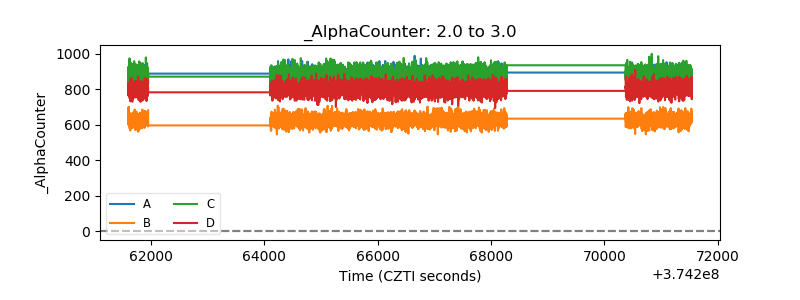 |
| _CPM_Rate | 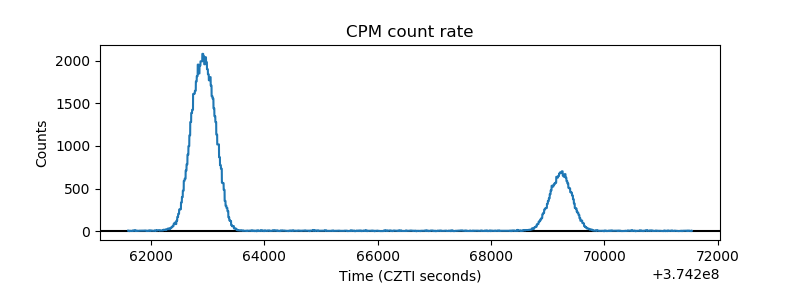 |
| CZT Counter | 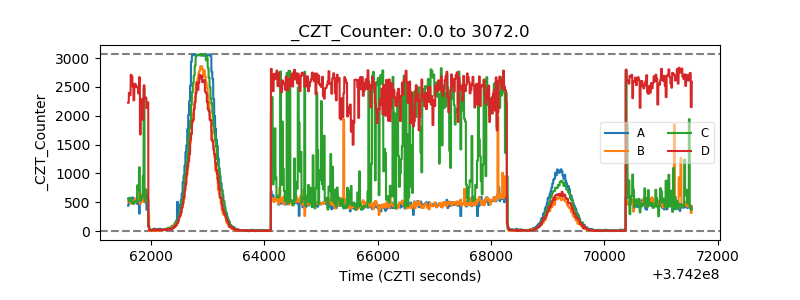 |
| +2.5 Volts monitor |  |
| +5 Volts monitor |  |
| _ROLL_ROT | 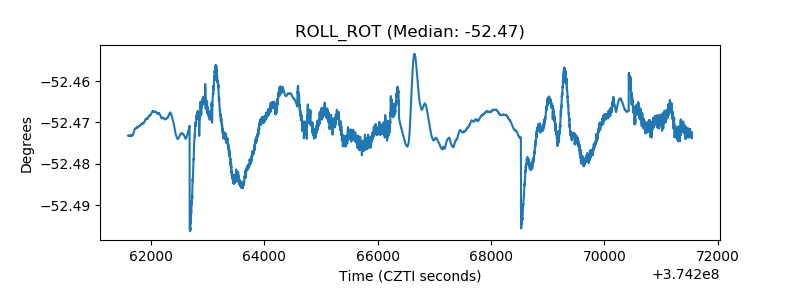 |
| _Roll_DEC |  |
| _Roll_RA | 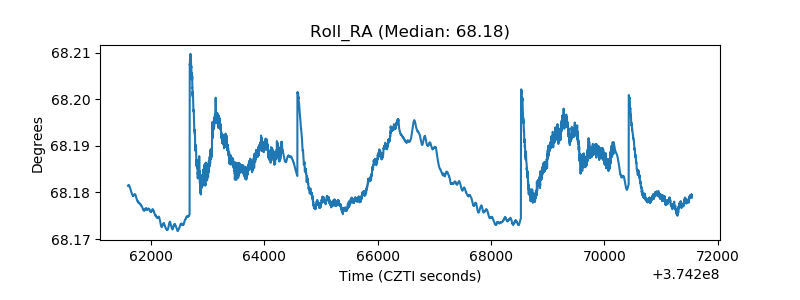 |
| Veto Counter | 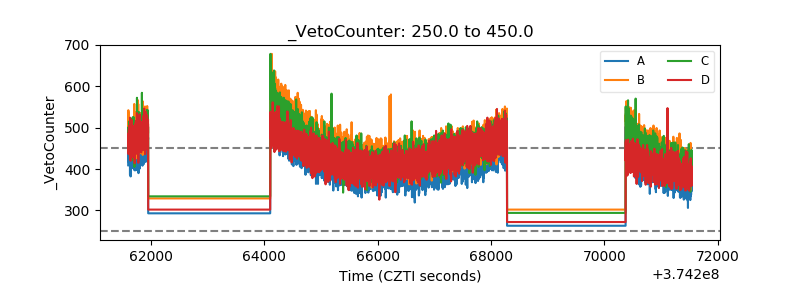 |