| Param | Original file | Final file |
|---|---|---|
| Filename | modeM0/AS1A11_030T01_9000004760_33094cztM0_level2.evt | modeM0/AS1A11_030T01_9000004760_33094cztM0_level2_quad_clean.evt |
| Size (bytes) | 631,022,400 | 62,156,160 |
| Size | 601.8 MB | 59.3 MB |
| Events in quadrant A | 2,188,386 | 433,413 |
| Events in quadrant B | 2,677,308 | 439,030 |
| Events in quadrant C | 3,113,520 | 403,616 |
| Events in quadrant D | 10,808,615 | 270,255 |
| Mode M9 | |||
|---|---|---|---|
| Quadrant | BADHDUFLAG | Total packets | Discarded packets |
| A | 0 | 21 | 0 |
| B | 0 | 21 | 0 |
| C | 0 | 21 | 0 |
| D | 0 | 22 | 0 |
| Mode M0 | |||
|---|---|---|---|
| Quadrant | BADHDUFLAG | Total packets | Discarded packets |
| A | 0 | 9596 | 2 |
| B | 0 | 11044 | 2 |
| C | 0 | 12314 | 2 |
| D | 0 | 35374 | 2 |
| Mode SS | |||
|---|---|---|---|
| Quadrant | BADHDUFLAG | Total packets | Discarded packets |
| A | 0 | 98 | 0 |
| B | 0 | 98 | 0 |
| C | 0 | 98 | 0 |
| D | 0 | 98 | 0 |
| Quadrant | Total seconds | Saturated seconds | Saturation percentage |
|---|---|---|---|
| A | 4760 | 8 | 0.168067% |
| B | 4760 | 182 | 3.823529% |
| C | 4760 | 159 | 3.340336% |
| D | 4760 | 3512 | 73.781513% |
Noise dominated data is calculated using 1-second bins in cleaned event files. If a bin has >2000 counts, and if more than 50% of those come from <1% of pixels, then it is considered to be noise-dominated and hence unusable.
| Quadrant | # 1 sec bins | Bins with >0 counts | Bins with >2000 counts | High rate bins dominated by noise | Noise dominated (total time) | Noise dominated (detector-on time) | Marked lightcurve |
|---|---|---|---|---|---|---|---|
| A | 6673 | 4761 | 0 | 0 | 0.00% | 0.00% | 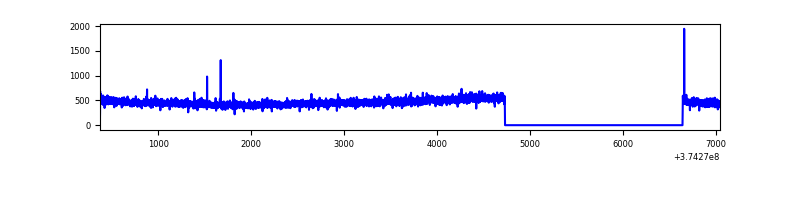 |
| B | 6673 | 4761 | 103 | 103 | 1.54% | 2.16% | 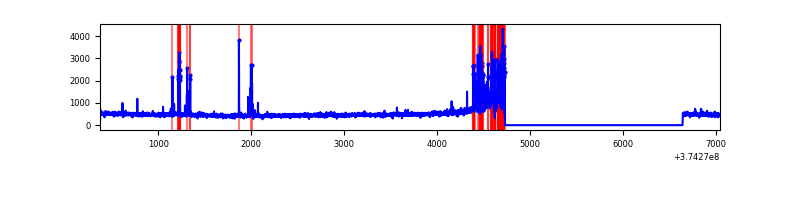 |
| C | 6673 | 4761 | 133 | 133 | 1.99% | 2.79% |  |
| D | 6673 | 4761 | 3530 | 3530 | 52.90% | 74.14% | 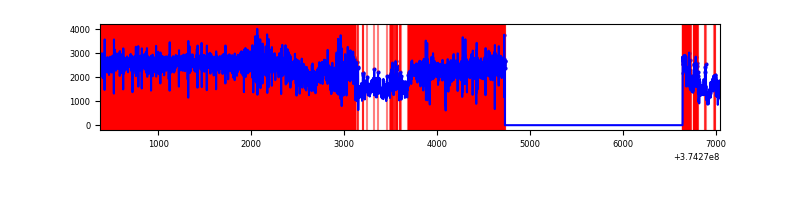 |
Top three noisy pixels from each quadrant. If the there are fewer than three noisy pixels in the level2.evt file, extra rows are filled as -1
| Pixel properties | Quadrant properties | ||||||
|---|---|---|---|---|---|---|---|
| Quadrant | DetID | PixID | Counts | Sigma | Mean | Median | Sigma |
| A | 13 | 254 | 8296 | 67.61 | 565 | 554 | 114.5 |
| A | 3 | 137 | 5248 | 40.99 | 565 | 554 | 114.5 |
| A | 0 | 226 | 4773 | 36.84 | 565 | 554 | 114.5 |
| B | 5 | 172 | 436675 | 4138.57 | 555 | 543 | 105.4 |
| B | 0 | 197 | 25897 | 240.59 | 555 | 543 | 105.4 |
| B | 0 | 189 | 16062 | 147.26 | 555 | 543 | 105.4 |
| C | 8 | 111 | 527784 | 4172.67 | 541 | 547 | 126.4 |
| C | 7 | 221 | 190143 | 1500.5 | 541 | 547 | 126.4 |
| C | 0 | 10 | 181786 | 1434.37 | 541 | 547 | 126.4 |
| D | 7 | 223 | 8136907 | 75377.12 | 412 | 405 | 107.9 |
| D | 8 | 195 | 475785 | 4403.95 | 412 | 405 | 107.9 |
| D | 2 | 250 | 253884 | 2348.25 | 412 | 405 | 107.9 |
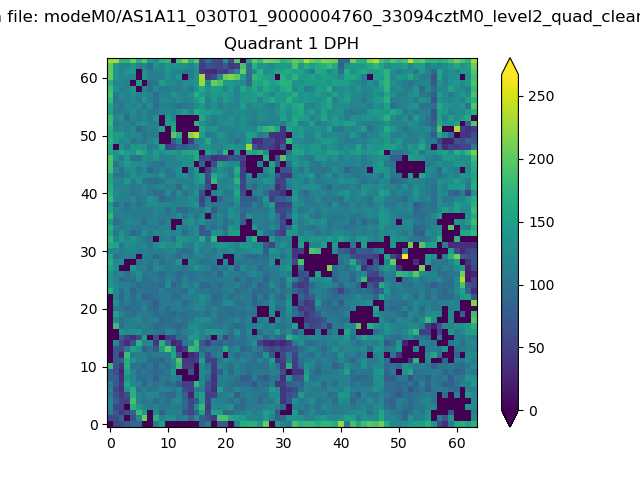
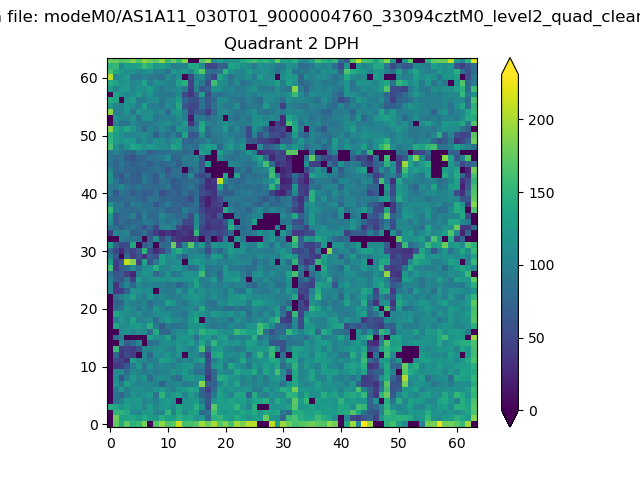
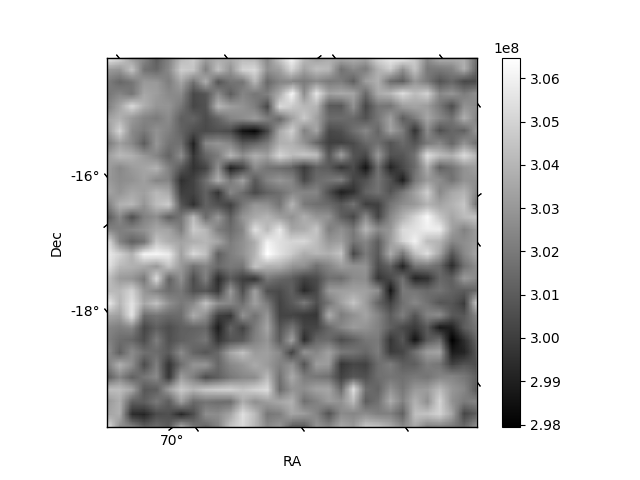
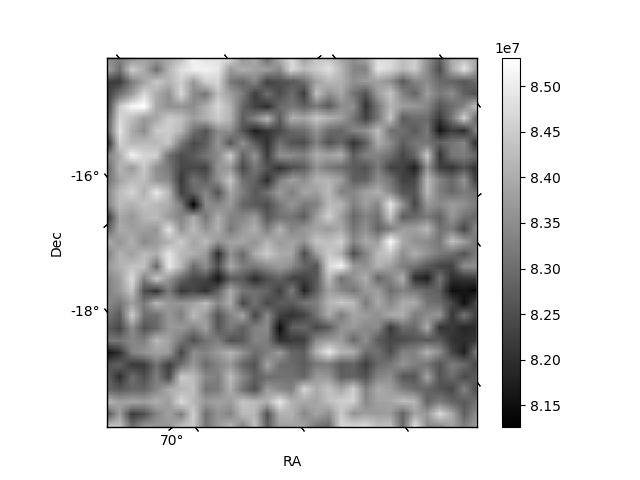
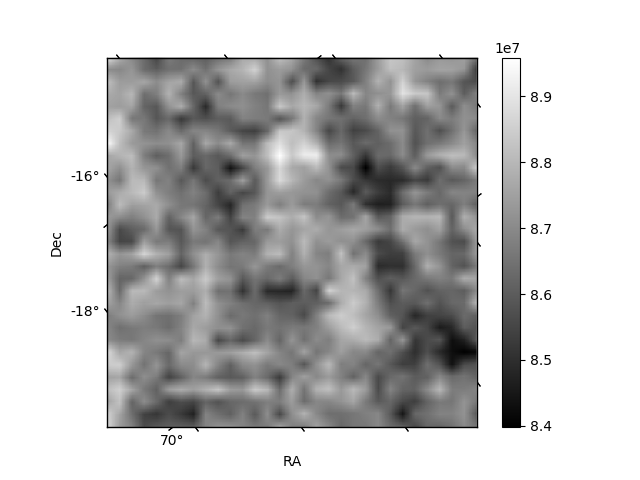
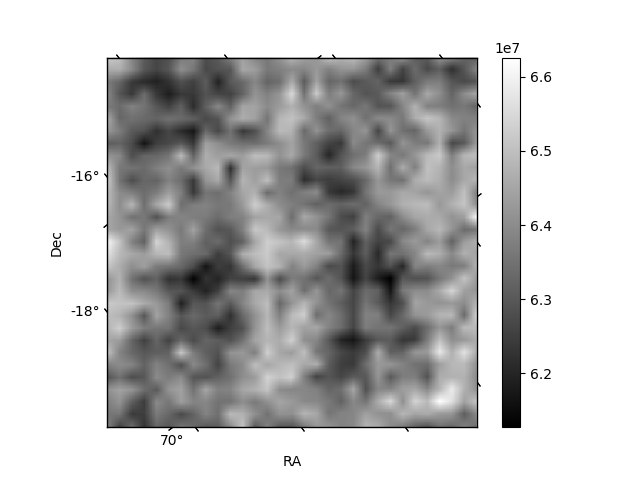
Histogram calculated using DETX and DETY for each event in the final _common_clean file
| Quadrant A | 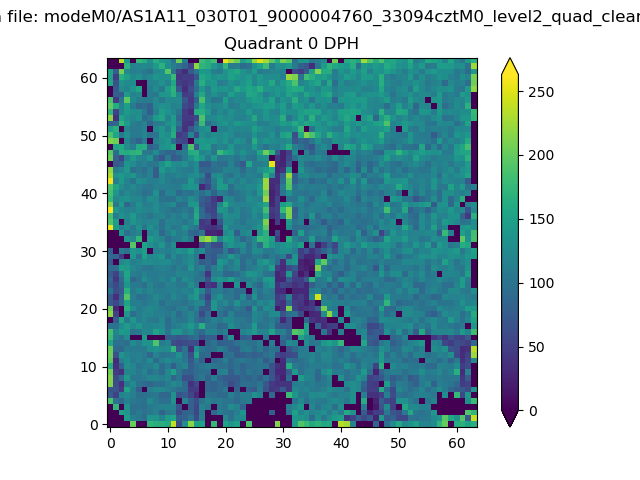 |
 |
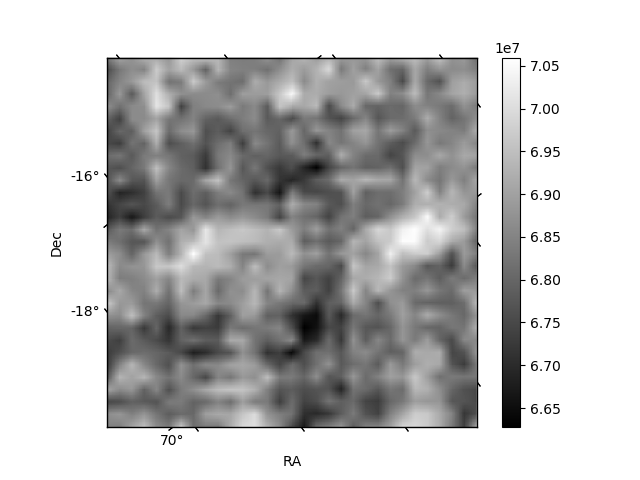
Quadrant B |
|---|---|---|---|
| Quadrant D | 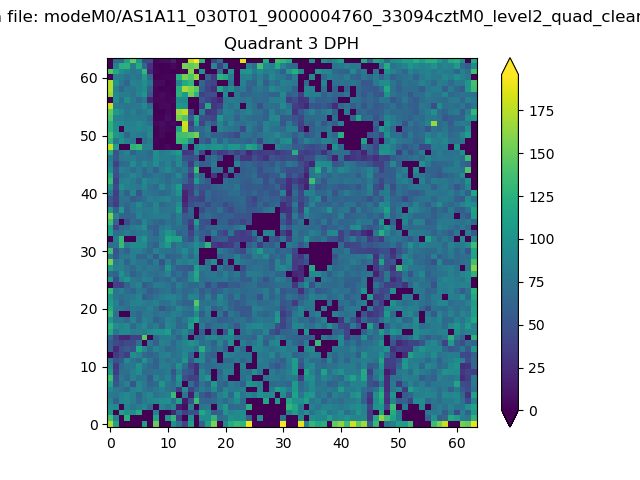 |
 |
Quadrant C |
| Plot type | Count rate plots | Images |
|---|---|---|
| Comparison with Poisson distribution Blue bars denote a histogram of data divided into 1 sec bins. Red curve is a Poisson curve with rate = median count rate of data. |
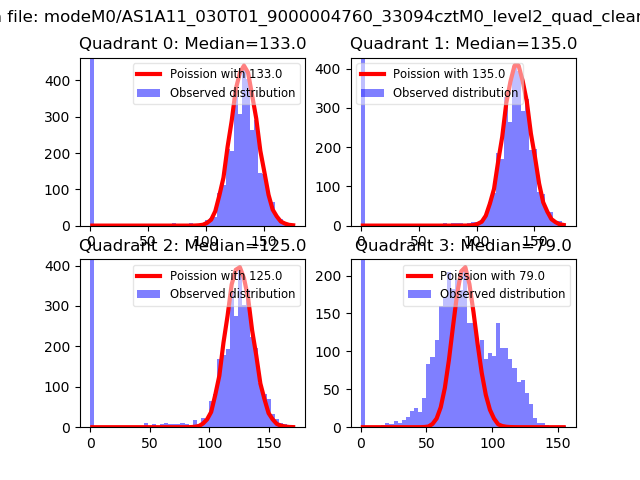 |
 |
| Quadrant-wise count rates Data is divided into 100 sec bins |
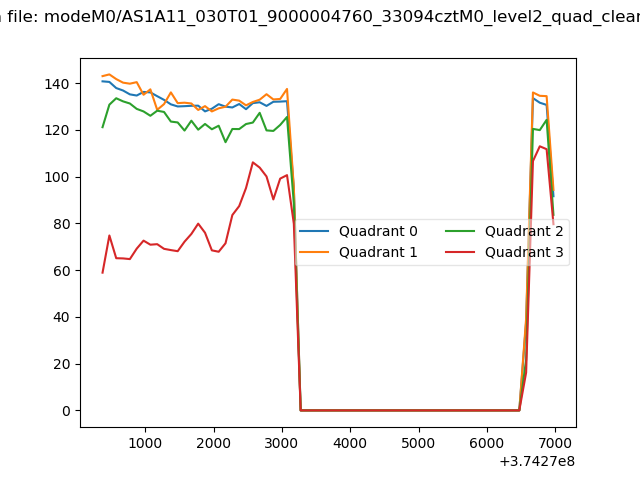 |
|
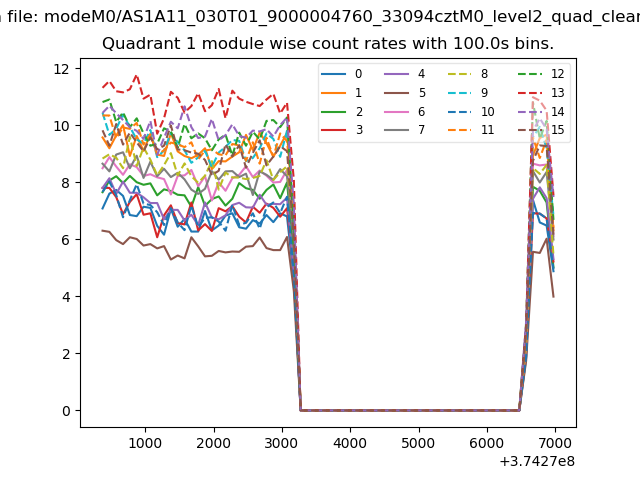
| Module-wise count rates for Quadrant A Data is divided into 100 sec bins |
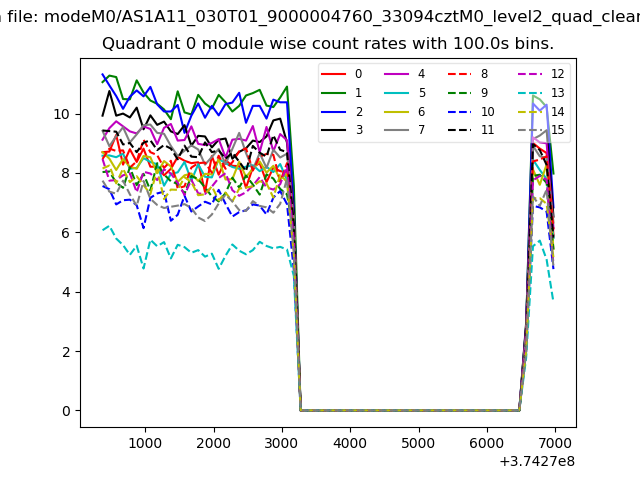 |
 |
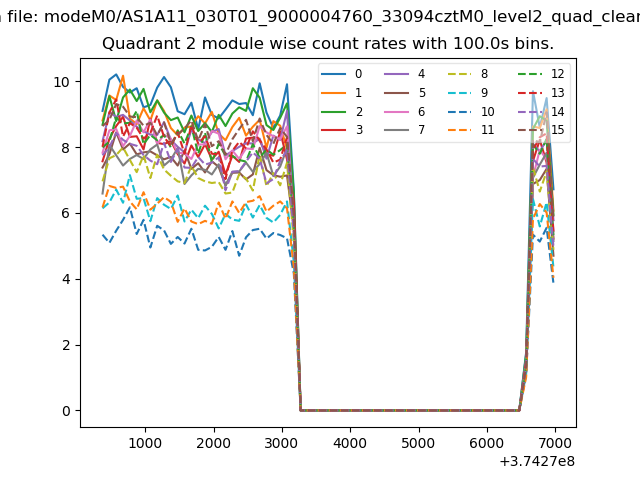
| Module-wise count rates for Quadrant B Data is divided into 100 sec bins |
 |
 |
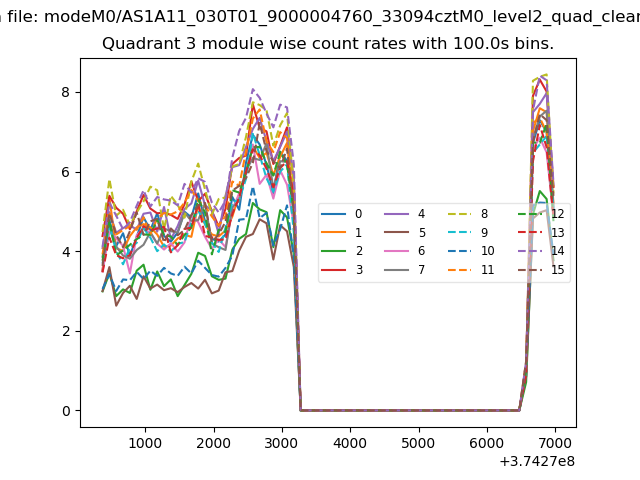
| Module-wise count rates for Quadrant C Data is divided into 100 sec bins |
 |
 |
| Module-wise count rates for Quadrant D Data is divided into 100 sec bins |
 |
 |
| Parameter | Plot |
|---|---|
| CZT HV Monitor | 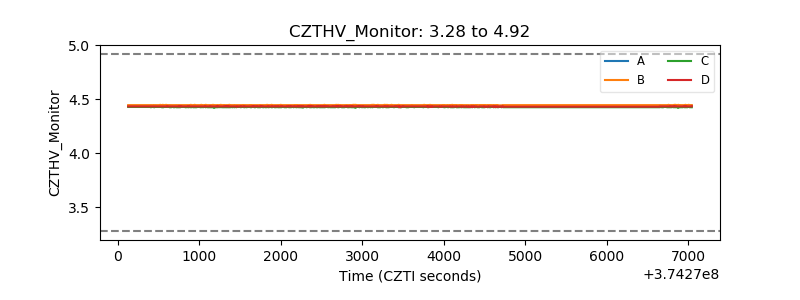 |
| D_VDD | 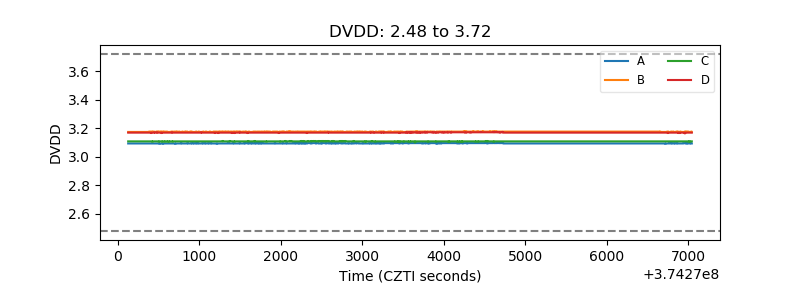 |
| Temperature 1 |  |
| Veto HV Monitor | 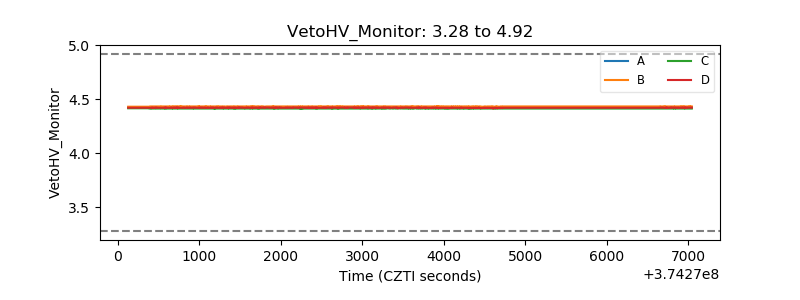 |
| Veto LLD | 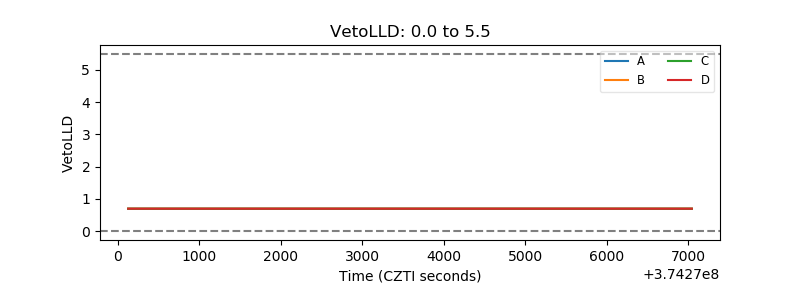 |
| Alpha Counter | 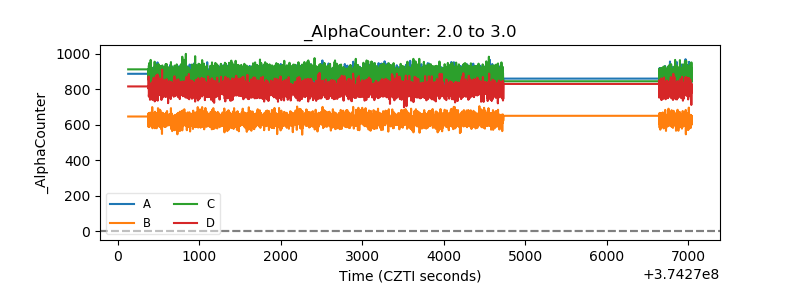 |
| _CPM_Rate | 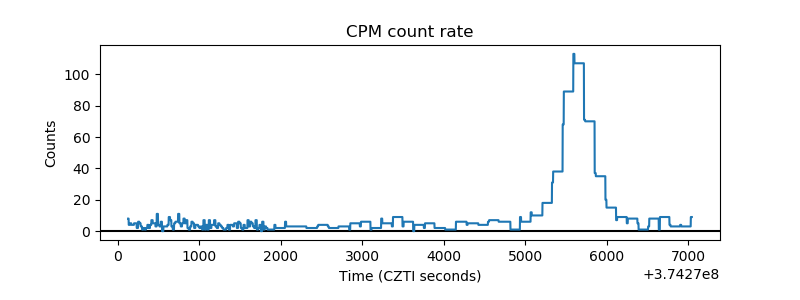 |
| CZT Counter | 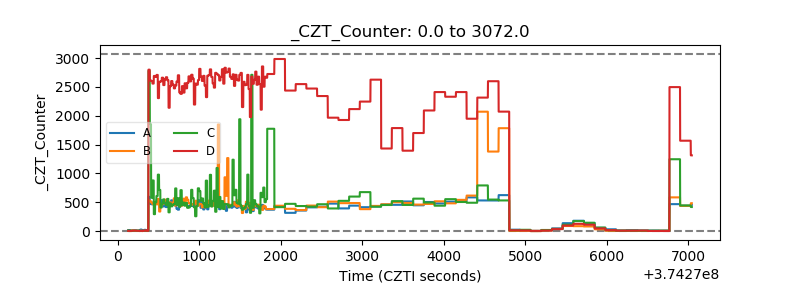 |
| +2.5 Volts monitor |  |
| +5 Volts monitor |  |
| _ROLL_ROT |  |
| _Roll_DEC | 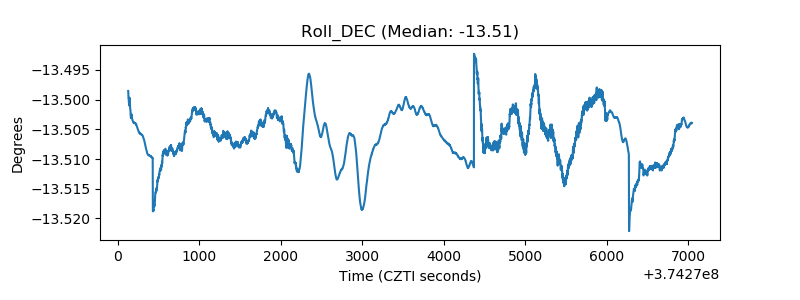 |
| _Roll_RA | 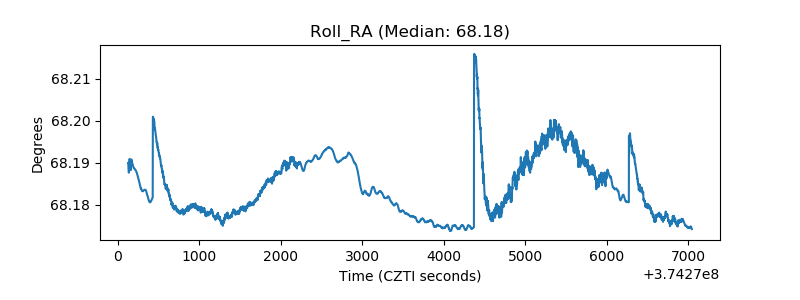 |
| Veto Counter | 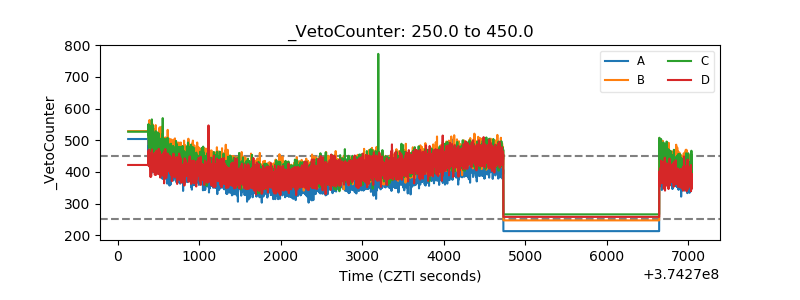 |