| Param | Original file | Final file |
|---|---|---|
| Filename | modeM0/AS1A11_046T06_9000004764_33117cztM0_level2.evt | modeM0/AS1A11_046T06_9000004764_33117cztM0_level2_quad_clean.evt |
| Size (bytes) | 103,996,800 | 19,120,320 |
| Size | 99.2 MB | 18.2 MB |
| Events in quadrant A | 529,293 | 134,648 |
| Events in quadrant B | 931,754 | 120,050 |
| Events in quadrant C | 647,472 | 130,377 |
| Events in quadrant D | 977,145 | 123,302 |
| Mode M0 | |||
|---|---|---|---|
| Quadrant | BADHDUFLAG | Total packets | Discarded packets |
| A | 0 | 2174 | 2 |
| B | 0 | 3467 | 1 |
| C | 0 | 2562 | 1 |
| D | 0 | 3562 | 1 |
| Mode M9 | |||
|---|---|---|---|
| Quadrant | BADHDUFLAG | Total packets | Discarded packets |
| A | 0 | 18 | 0 |
| B | 0 | 18 | 0 |
| C | 0 | 18 | 0 |
| D | 0 | 18 | 0 |
| Mode SS | |||
|---|---|---|---|
| Quadrant | BADHDUFLAG | Total packets | Discarded packets |
| A | 0 | 18 | 0 |
| B | 0 | 18 | 0 |
| C | 0 | 18 | 0 |
| D | 0 | 18 | 0 |
| Quadrant | Total seconds | Saturated seconds | Saturation percentage |
|---|---|---|---|
| A | 899 | 2 | 0.222469% |
| B | 899 | 193 | 21.468298% |
| C | 899 | 30 | 3.337041% |
| D | 899 | 58 | 6.451613% |
Noise dominated data is calculated using 1-second bins in cleaned event files. If a bin has >2000 counts, and if more than 50% of those come from <1% of pixels, then it is considered to be noise-dominated and hence unusable.
| Quadrant | # 1 sec bins | Bins with >0 counts | Bins with >2000 counts | High rate bins dominated by noise | Noise dominated (total time) | Noise dominated (detector-on time) | Marked lightcurve |
|---|---|---|---|---|---|---|---|
| A | 899 | 899 | 0 | 0 | 0.00% | 0.00% | 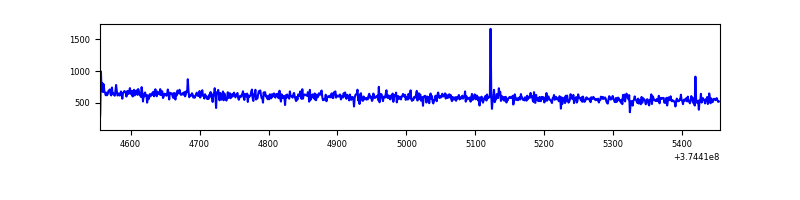 |
| B | 899 | 899 | 120 | 120 | 13.35% | 13.35% | 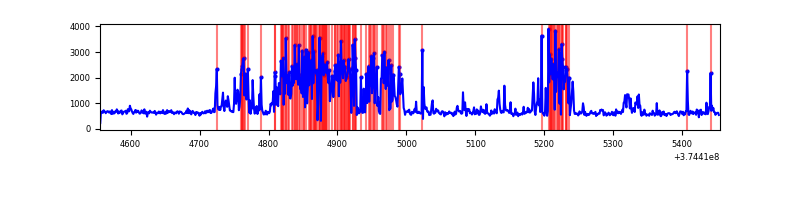 |
| C | 899 | 899 | 17 | 17 | 1.89% | 1.89% | 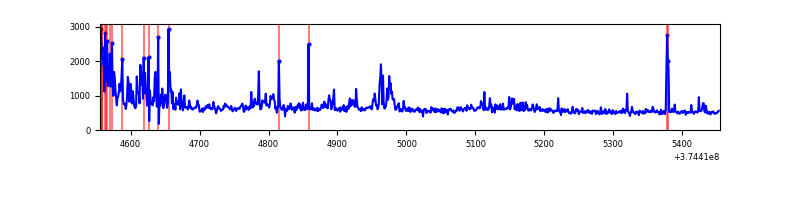 |
| D | 899 | 899 | 33 | 33 | 3.67% | 3.67% | 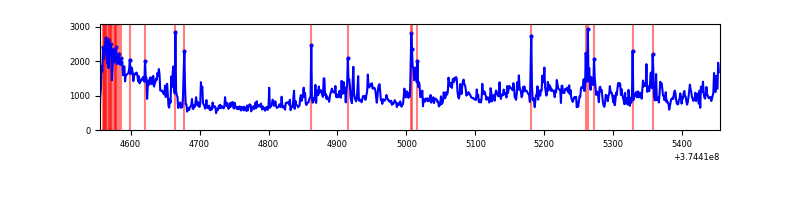 |
Top three noisy pixels from each quadrant. If the there are fewer than three noisy pixels in the level2.evt file, extra rows are filled as -1
| Pixel properties | Quadrant properties | ||||||
|---|---|---|---|---|---|---|---|
| Quadrant | DetID | PixID | Counts | Sigma | Mean | Median | Sigma |
| A | 13 | 254 | 1538 | 48.77 | 136 | 134 | 28.8 |
| A | 0 | 226 | 1239 | 38.39 | 136 | 134 | 28.8 |
| A | 10 | 248 | 1176 | 36.2 | 136 | 134 | 28.8 |
| B | 5 | 172 | 437080 | 17693.82 | 120 | 117 | 24.7 |
| B | 0 | 189 | 7371 | 293.71 | 120 | 117 | 24.7 |
| B | 0 | 230 | 5358 | 212.2 | 120 | 117 | 24.7 |
| C | 0 | 10 | 85130 | 2810.37 | 125 | 125 | 30.2 |
| C | 7 | 221 | 62699 | 2068.78 | 125 | 125 | 30.2 |
| C | 10 | 49 | 5609 | 181.31 | 125 | 125 | 30.2 |
| D | 2 | 249 | 181461 | 5005.26 | 126 | 123 | 36.2 |
| D | 7 | 223 | 93716 | 2583.34 | 126 | 123 | 36.2 |
| D | 8 | 195 | 83616 | 2304.56 | 126 | 123 | 36.2 |
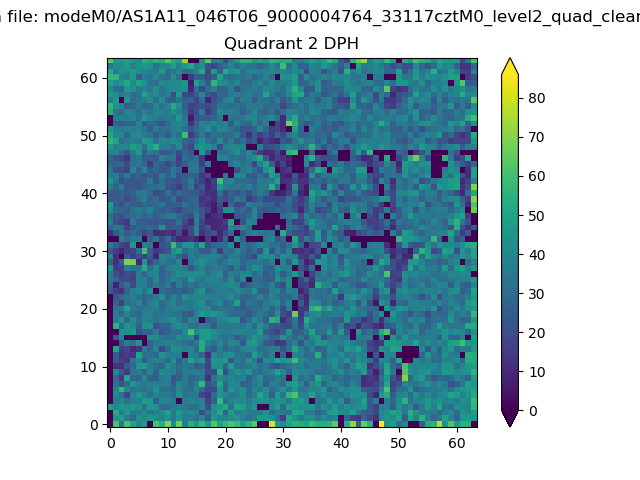
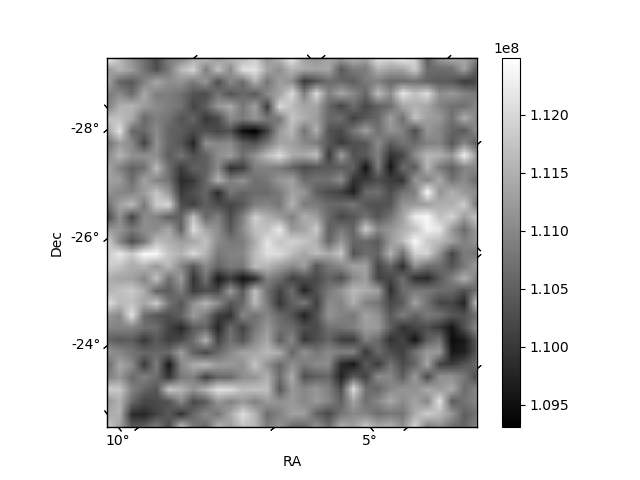
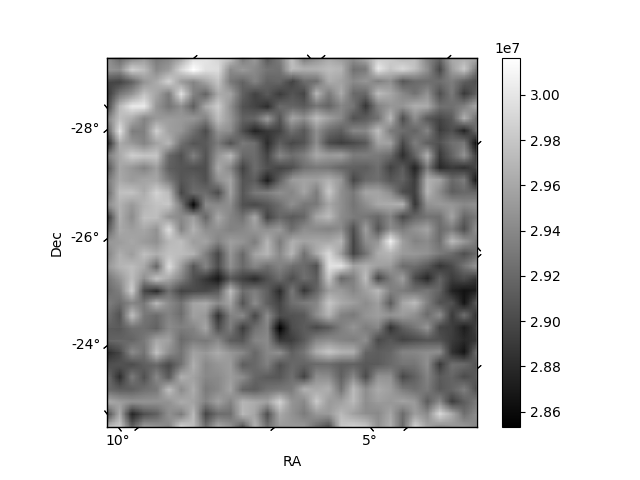
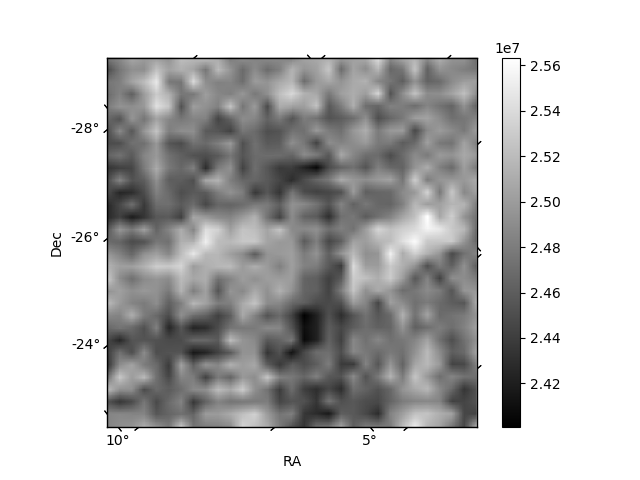
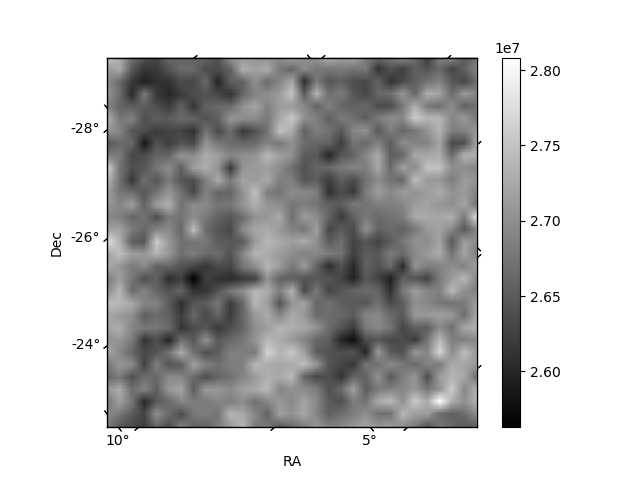
Histogram calculated using DETX and DETY for each event in the final _common_clean file
| Quadrant A | 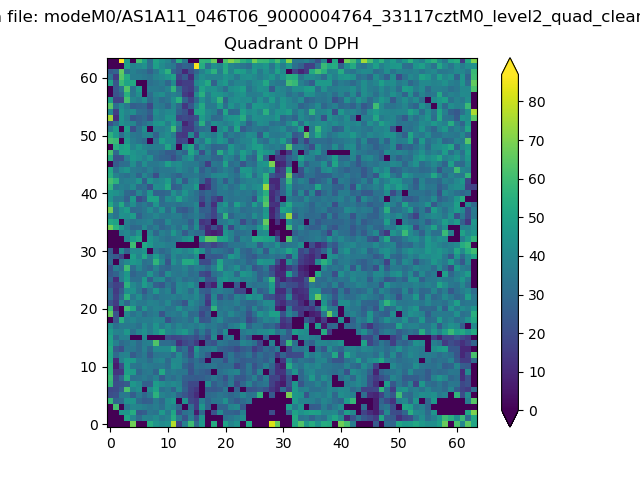 |
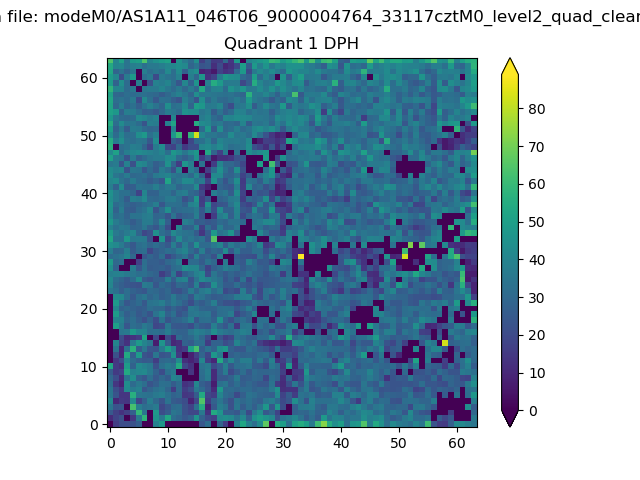 |
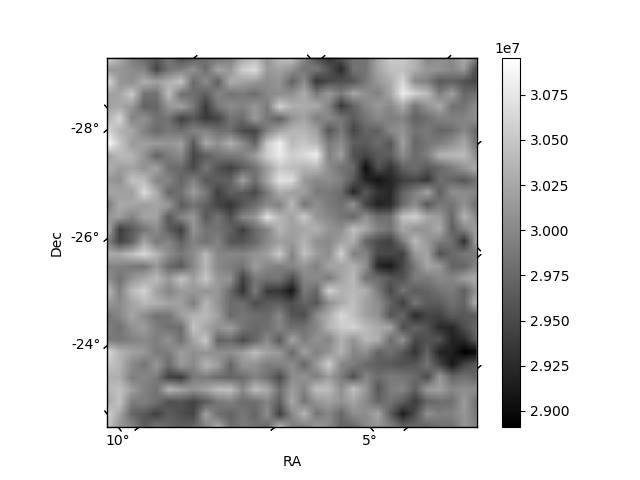
Quadrant B |
|---|---|---|---|
| Quadrant D | 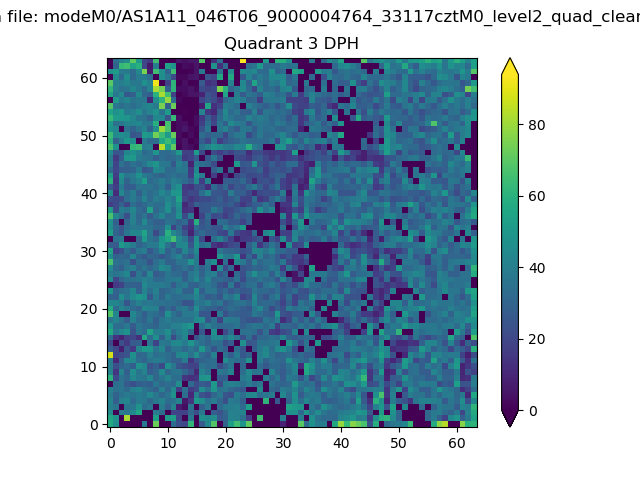 |
 |
Quadrant C |
| Plot type | Count rate plots | Images |
|---|---|---|
| Comparison with Poisson distribution Blue bars denote a histogram of data divided into 1 sec bins. Red curve is a Poisson curve with rate = median count rate of data. |
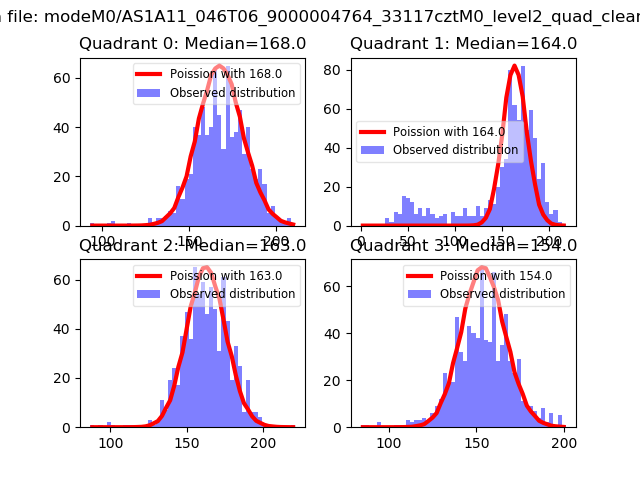 |
 |
| Quadrant-wise count rates Data is divided into 100 sec bins |
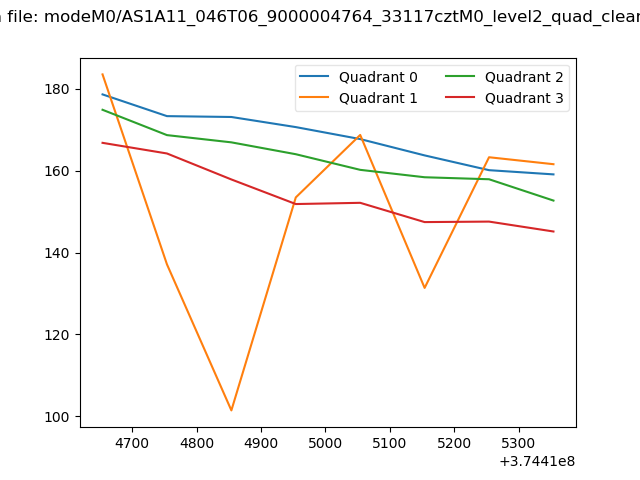 |
|
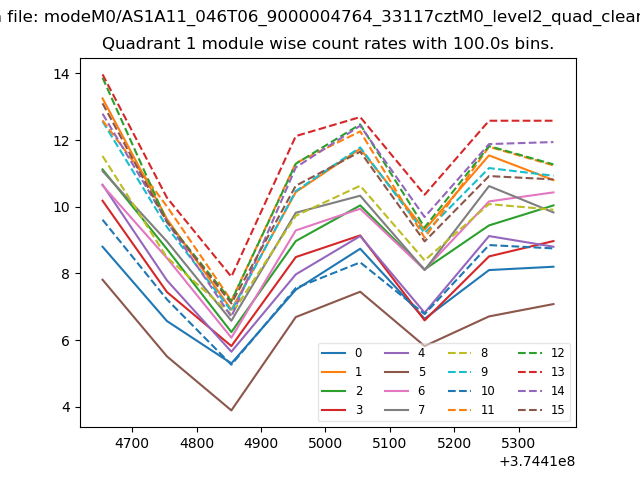
| Module-wise count rates for Quadrant A Data is divided into 100 sec bins |
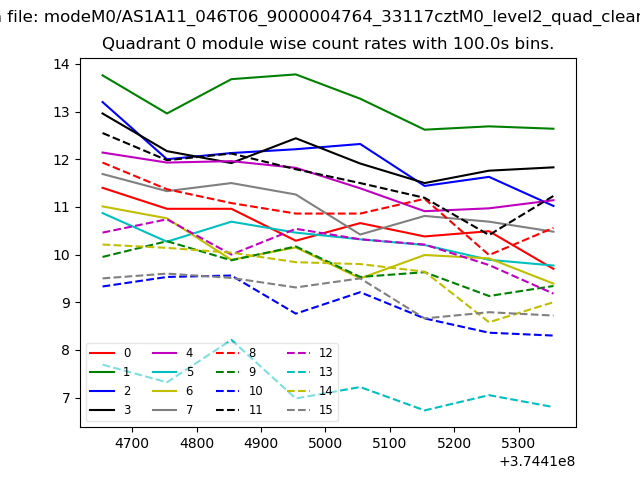 |
 |
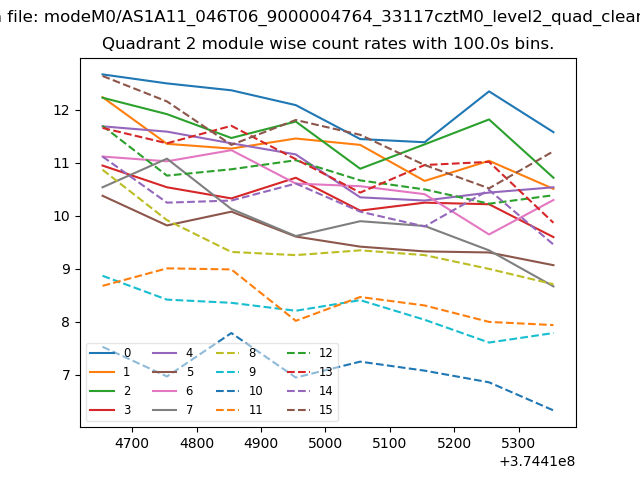
| Module-wise count rates for Quadrant B Data is divided into 100 sec bins |
 |
 |
| Module-wise count rates for Quadrant C Data is divided into 100 sec bins |
 |
 |
| Module-wise count rates for Quadrant D Data is divided into 100 sec bins |
 |
 |
| Parameter | Plot |
|---|---|
| CZT HV Monitor | 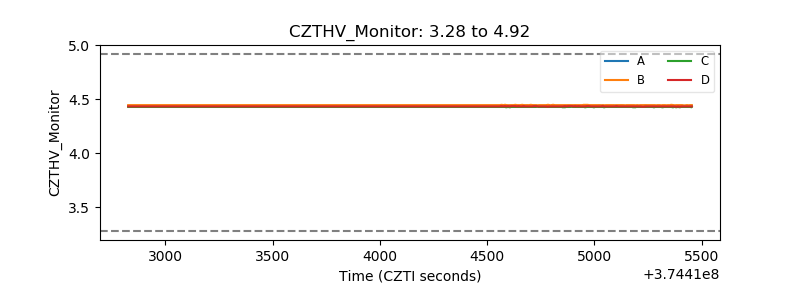 |
| D_VDD | 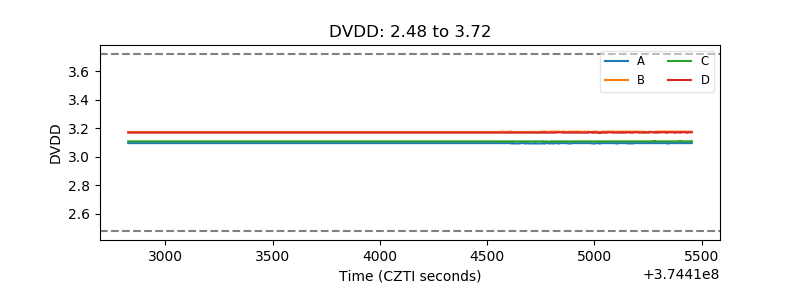 |
| Temperature 1 | 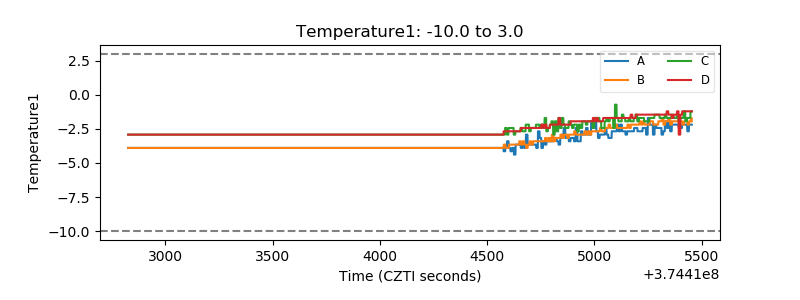 |
| Veto HV Monitor | 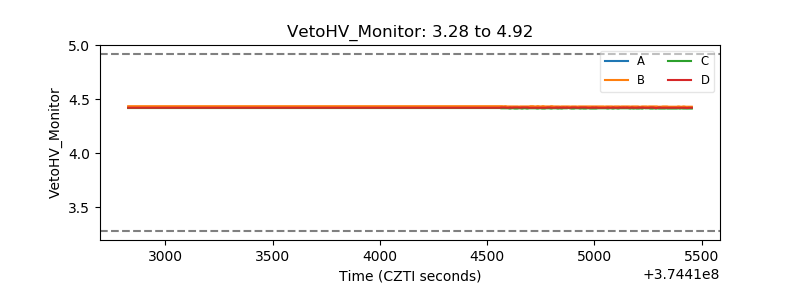 |
| Veto LLD | 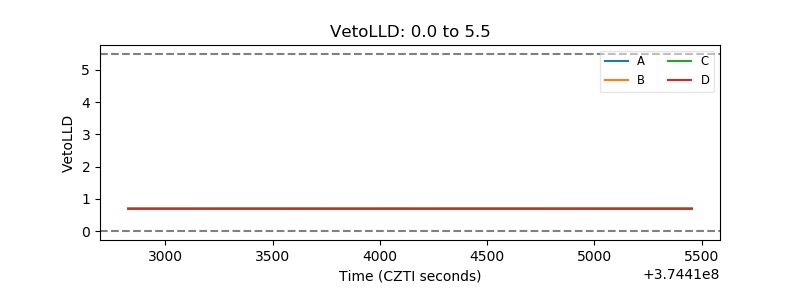 |
| Alpha Counter | 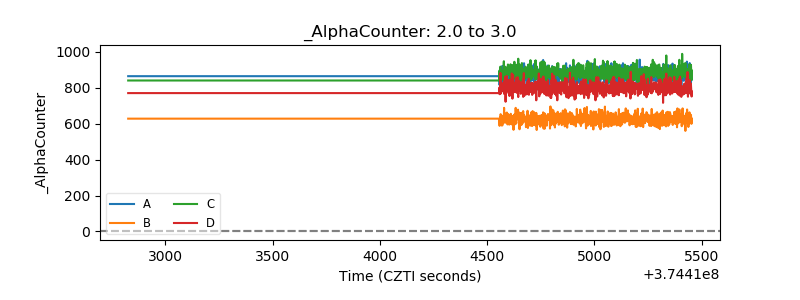 |
| _CPM_Rate | 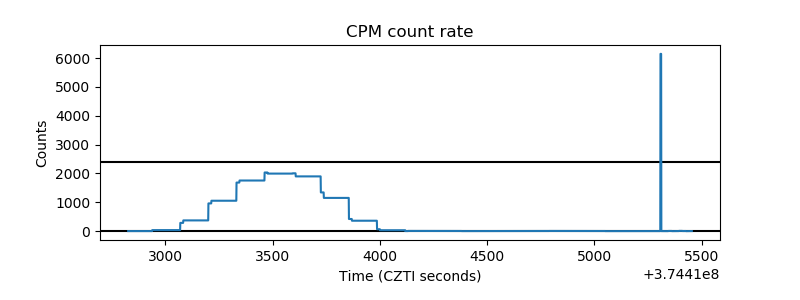 |
| CZT Counter | 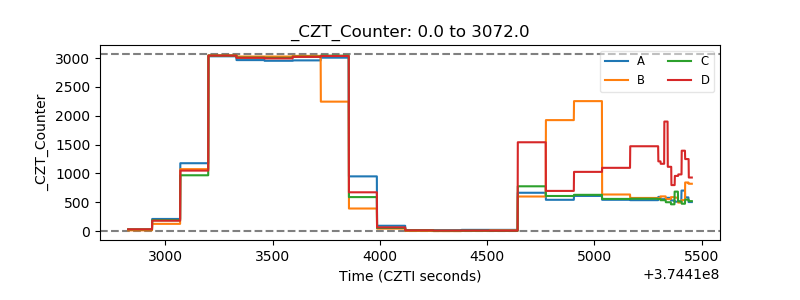 |
| +2.5 Volts monitor |  |
| +5 Volts monitor | 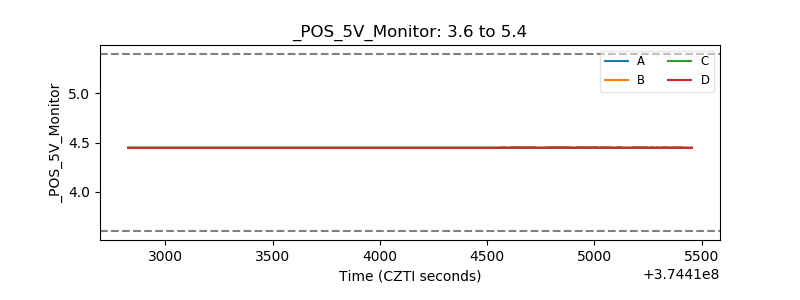 |
| _ROLL_ROT | 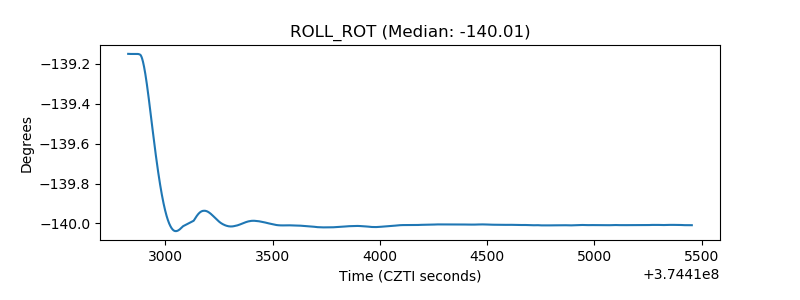 |
| _Roll_DEC | 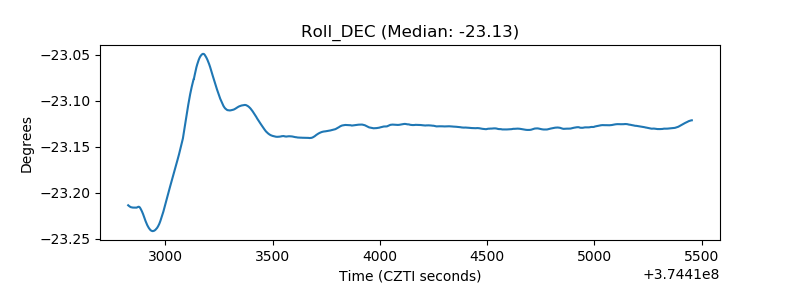 |
| _Roll_RA | 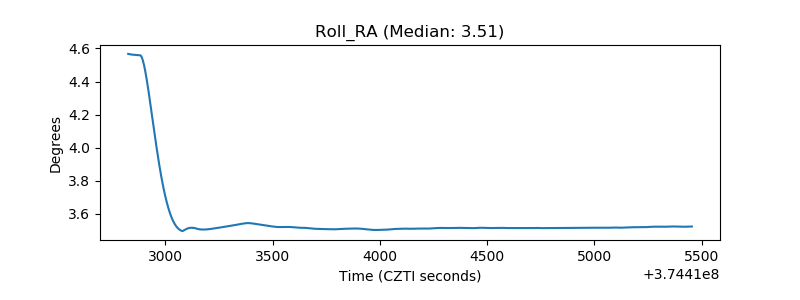 |
| Veto Counter | 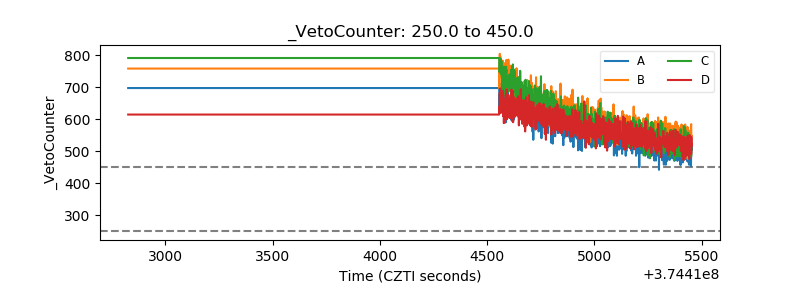 |