| Param | Original file | Final file |
|---|---|---|
| Filename | modeM0/AS1A11_046T06_9000004764_33118cztM0_level2.evt | modeM0/AS1A11_046T06_9000004764_33118cztM0_level2_quad_clean.evt |
| Size (bytes) | 572,379,840 | 95,109,120 |
| Size | 545.9 MB | 90.7 MB |
| Events in quadrant A | 2,587,081 | 676,020 |
| Events in quadrant B | 3,959,946 | 645,028 |
| Events in quadrant C | 2,945,761 | 647,303 |
| Events in quadrant D | 7,501,249 | 558,385 |
| Mode M0 | |||
|---|---|---|---|
| Quadrant | BADHDUFLAG | Total packets | Discarded packets |
| A | 0 | 10812 | 2 |
| B | 0 | 15085 | 1 |
| C | 0 | 11979 | 1 |
| D | 0 | 25811 | 1 |
| Mode M9 | |||
|---|---|---|---|
| Quadrant | BADHDUFLAG | Total packets | Discarded packets |
| A | 0 | 23 | 0 |
| B | 0 | 23 | 0 |
| C | 0 | 23 | 0 |
| D | 0 | 24 | 0 |
| Mode SS | |||
|---|---|---|---|
| Quadrant | BADHDUFLAG | Total packets | Discarded packets |
| A | 0 | 102 | 0 |
| B | 0 | 102 | 0 |
| C | 0 | 102 | 0 |
| D | 0 | 102 | 0 |
| Quadrant | Total seconds | Saturated seconds | Saturation percentage |
|---|---|---|---|
| A | 5036 | 7 | 0.138999% |
| B | 5036 | 452 | 8.975377% |
| C | 5036 | 70 | 1.389992% |
| D | 5036 | 1393 | 27.660842% |
Noise dominated data is calculated using 1-second bins in cleaned event files. If a bin has >2000 counts, and if more than 50% of those come from <1% of pixels, then it is considered to be noise-dominated and hence unusable.
| Quadrant | # 1 sec bins | Bins with >0 counts | Bins with >2000 counts | High rate bins dominated by noise | Noise dominated (total time) | Noise dominated (detector-on time) | Marked lightcurve |
|---|---|---|---|---|---|---|---|
| A | 7009 | 5037 | 0 | 0 | 0.00% | 0.00% | 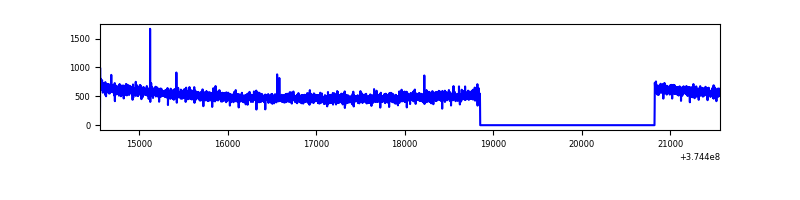 |
| B | 7009 | 5037 | 288 | 288 | 4.11% | 5.72% | 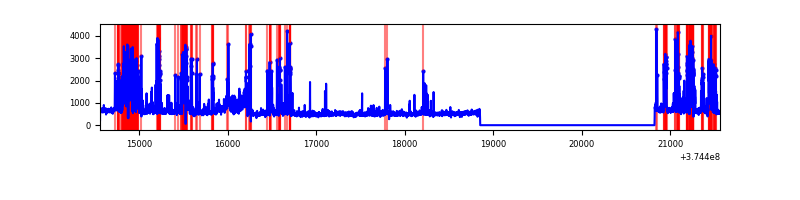 |
| C | 7009 | 5037 | 47 | 47 | 0.67% | 0.93% | 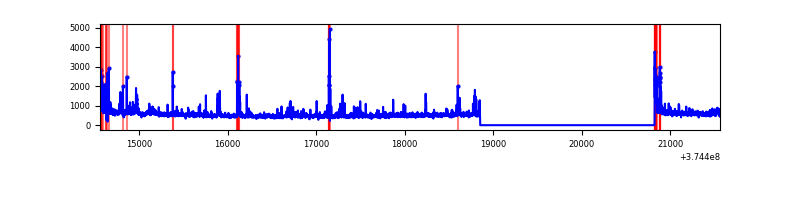 |
| D | 7009 | 5037 | 1393 | 1393 | 19.87% | 27.66% | 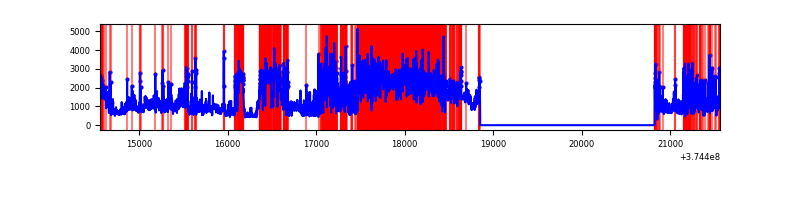 |
Top three noisy pixels from each quadrant. If the there are fewer than three noisy pixels in the level2.evt file, extra rows are filled as -1
| Pixel properties | Quadrant properties | ||||||
|---|---|---|---|---|---|---|---|
| Quadrant | DetID | PixID | Counts | Sigma | Mean | Median | Sigma |
| A | 13 | 254 | 8694 | 60.77 | 667 | 658 | 132.2 |
| A | 0 | 226 | 5776 | 38.7 | 667 | 658 | 132.2 |
| A | 3 | 137 | 5748 | 38.49 | 667 | 658 | 132.2 |
| B | 5 | 172 | 1155103 | 9644.2 | 635 | 623 | 119.7 |
| B | 0 | 189 | 71105 | 588.79 | 635 | 623 | 119.7 |
| B | 5 | 200 | 52809 | 435.95 | 635 | 623 | 119.7 |
| C | 7 | 221 | 248109 | 1739.4 | 623 | 631 | 142.3 |
| C | 0 | 10 | 169119 | 1184.22 | 623 | 631 | 142.3 |
| C | 1 | 241 | 40971 | 283.53 | 623 | 631 | 142.3 |
| D | 7 | 223 | 2542191 | 17397.07 | 582 | 570 | 146.1 |
| D | 2 | 249 | 980784 | 6709.44 | 582 | 570 | 146.1 |
| D | 8 | 195 | 676993 | 4630.03 | 582 | 570 | 146.1 |
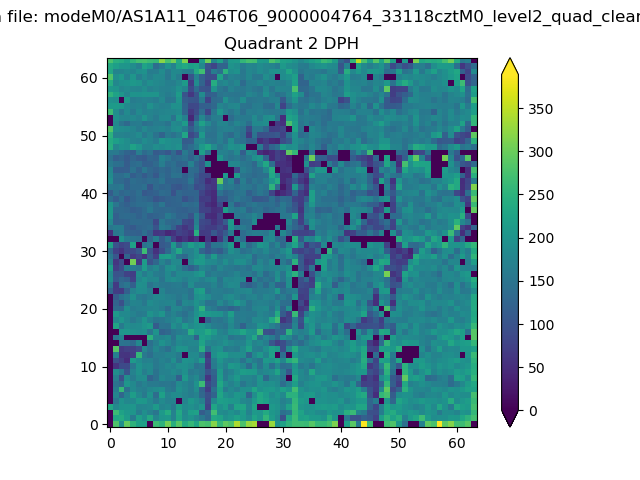
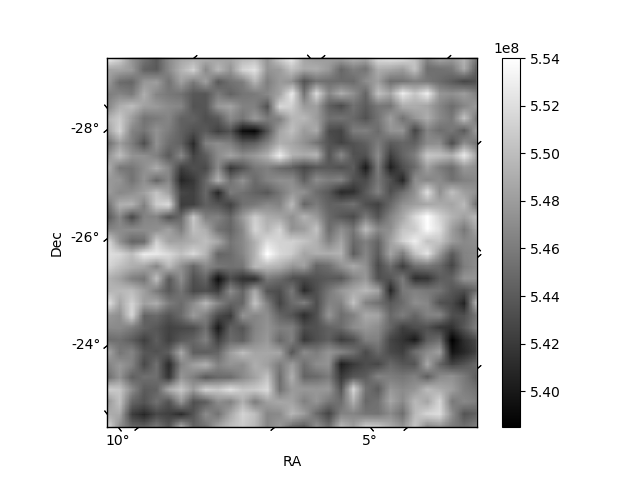
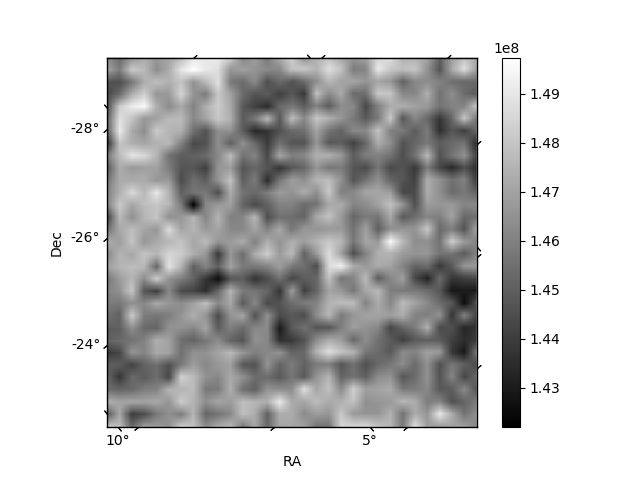
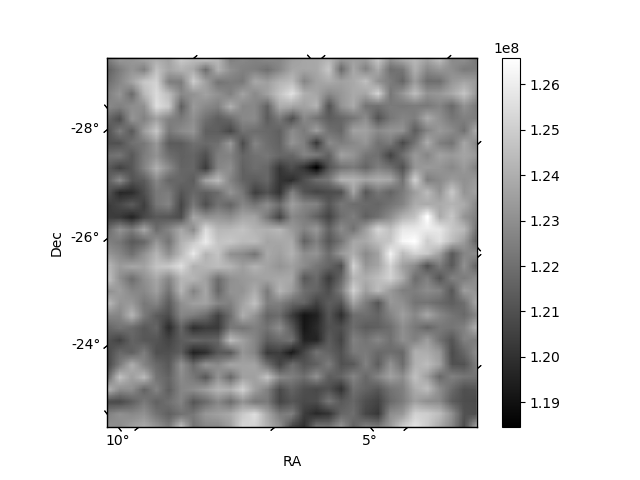
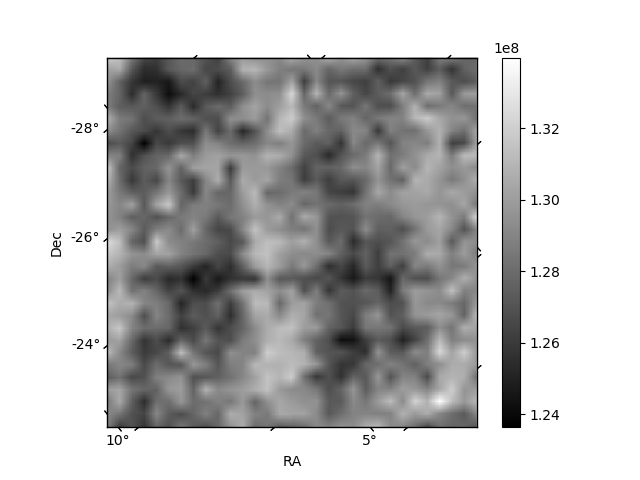
Histogram calculated using DETX and DETY for each event in the final _common_clean file
| Quadrant A | 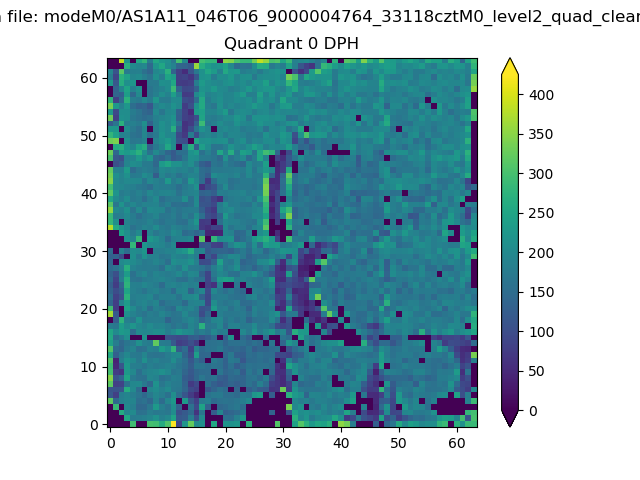 |
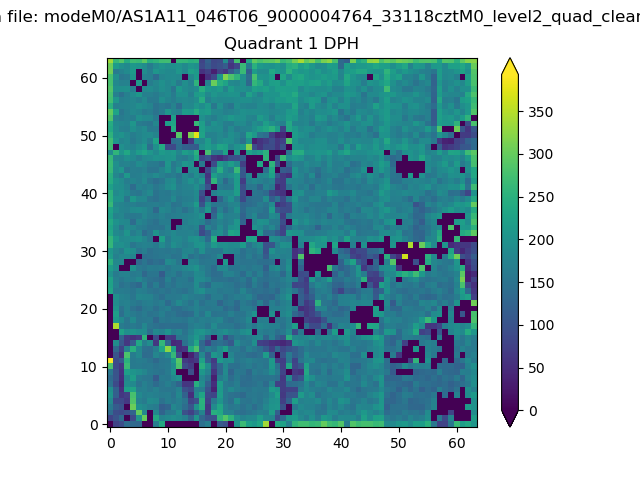 |
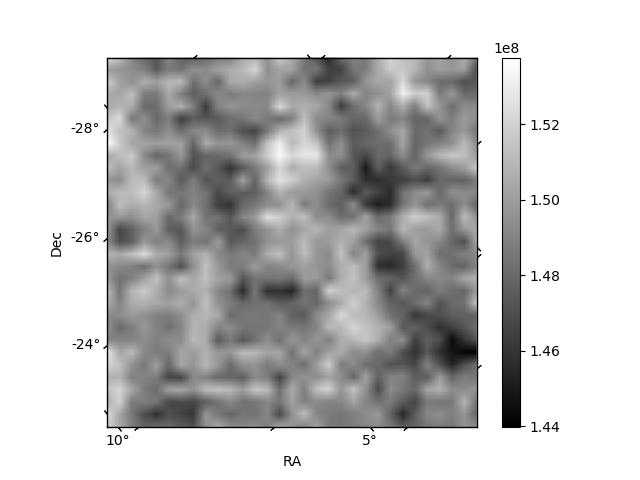
Quadrant B |
|---|---|---|---|
| Quadrant D | 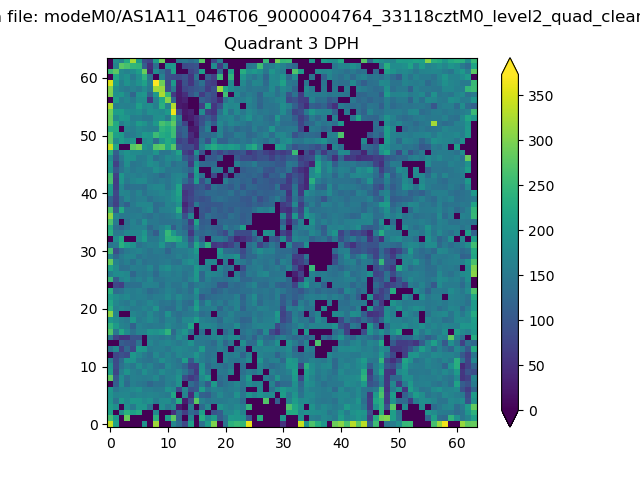 |
 |
Quadrant C |
| Plot type | Count rate plots | Images |
|---|---|---|
| Comparison with Poisson distribution Blue bars denote a histogram of data divided into 1 sec bins. Red curve is a Poisson curve with rate = median count rate of data. |
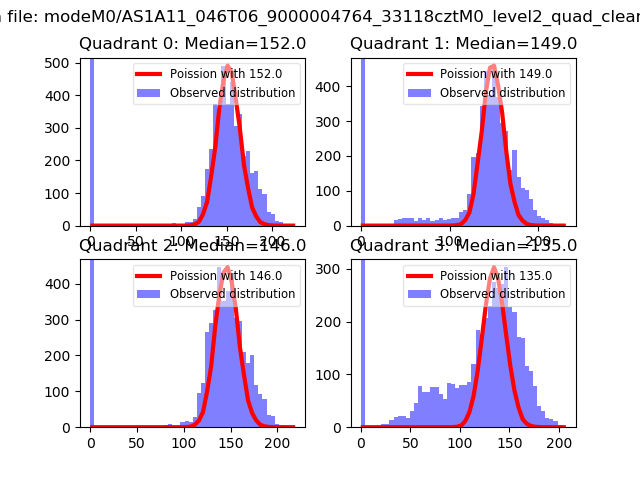 |
 |
| Quadrant-wise count rates Data is divided into 100 sec bins |
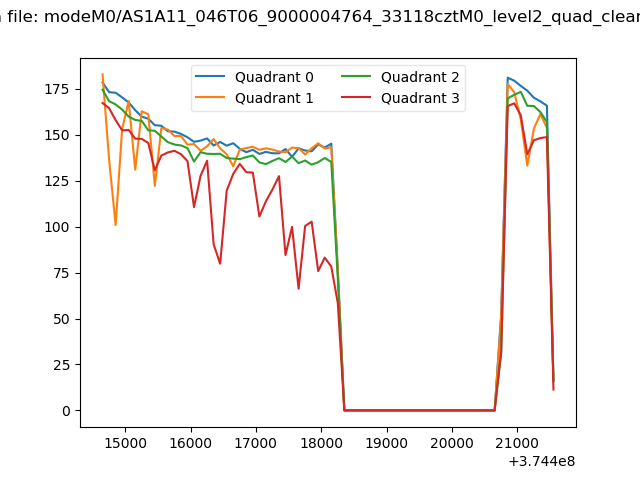 |
|
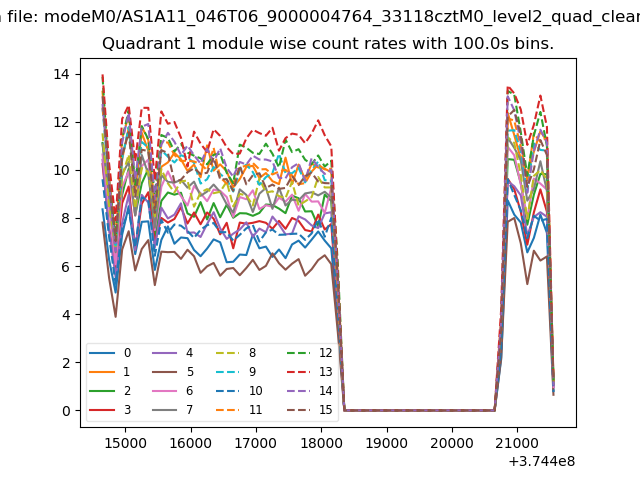
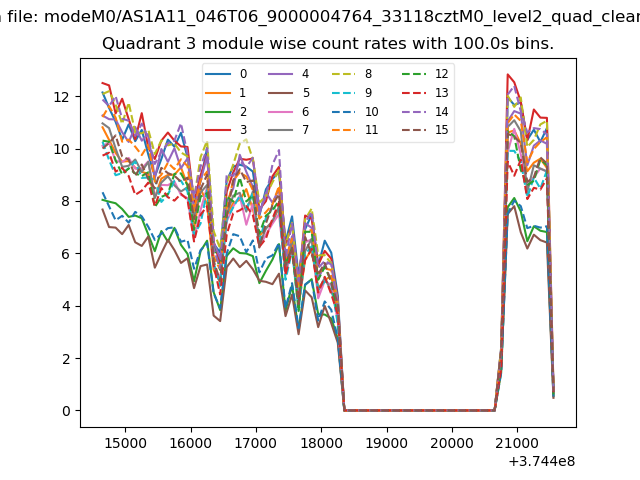
| Module-wise count rates for Quadrant A Data is divided into 100 sec bins |
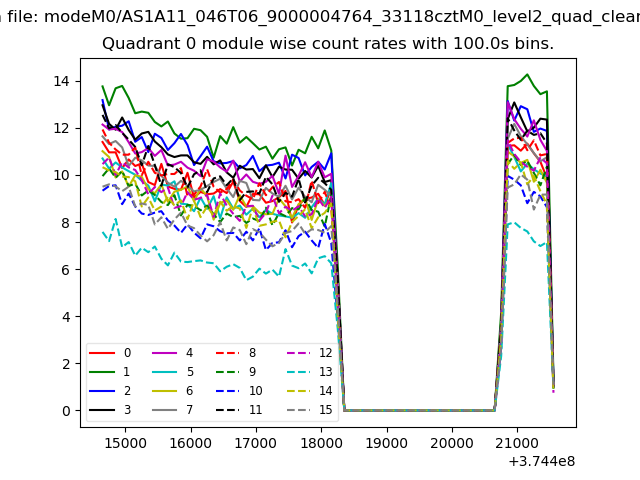 |
 |
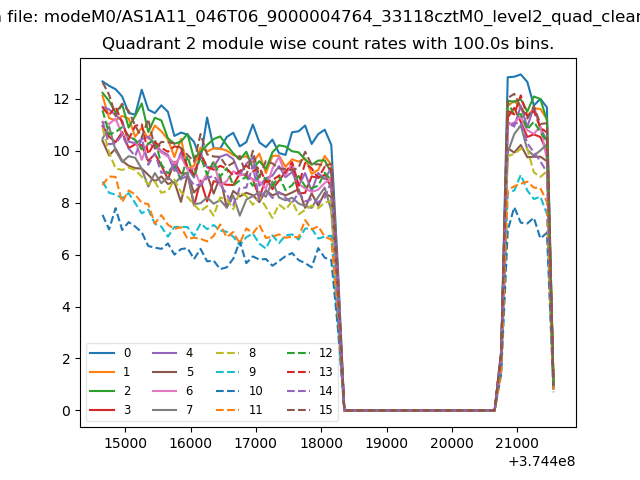
| Module-wise count rates for Quadrant B Data is divided into 100 sec bins |
 |
 |
| Module-wise count rates for Quadrant C Data is divided into 100 sec bins |
 |
 |
| Module-wise count rates for Quadrant D Data is divided into 100 sec bins |
 |
 |
| Parameter | Plot |
|---|---|
| CZT HV Monitor | 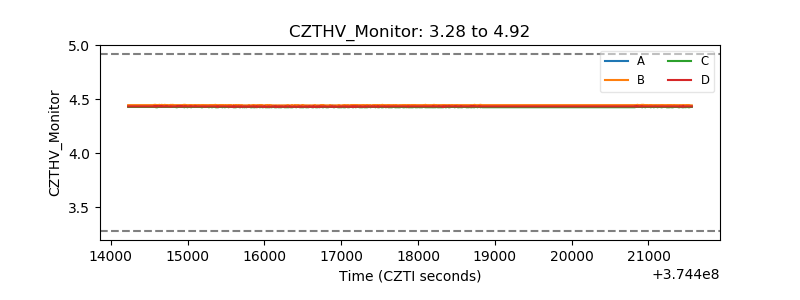 |
| D_VDD | 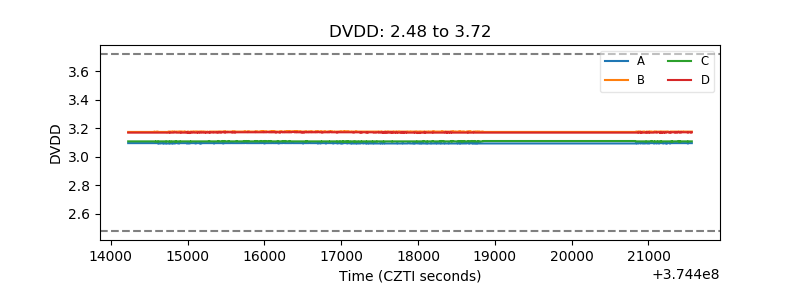 |
| Temperature 1 |  |
| Veto HV Monitor | 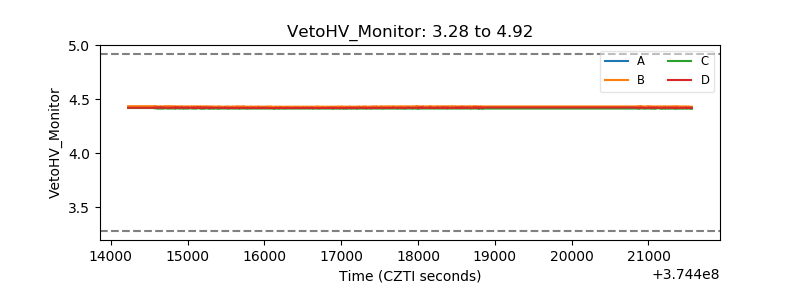 |
| Veto LLD | 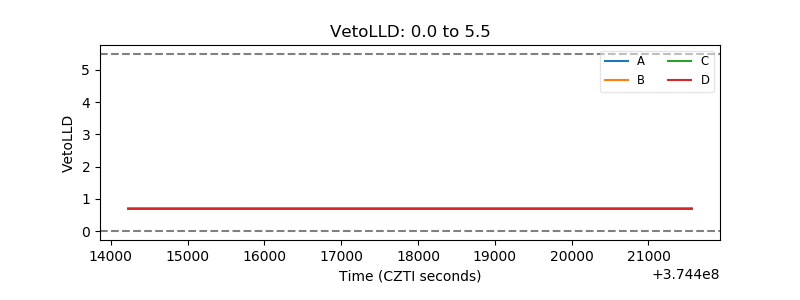 |
| Alpha Counter | 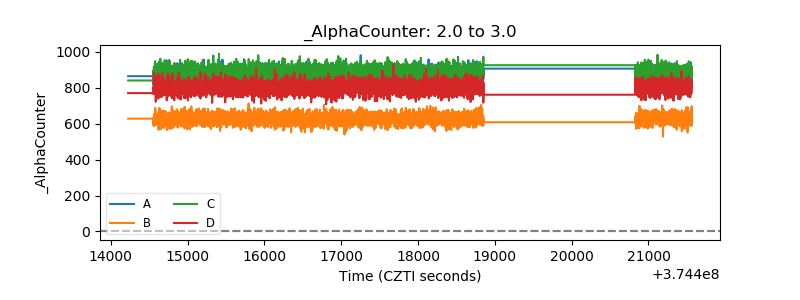 |
| _CPM_Rate | 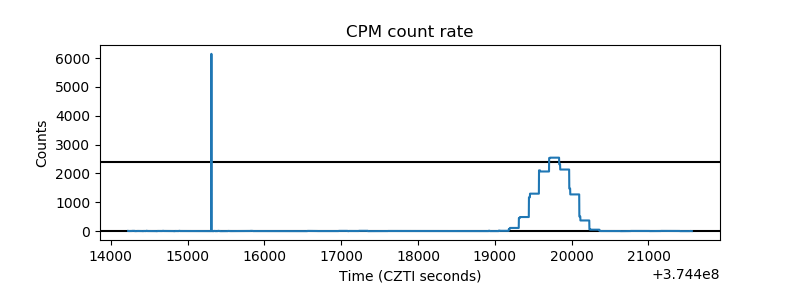 |
| CZT Counter |  |
| +2.5 Volts monitor |  |
| +5 Volts monitor |  |
| _ROLL_ROT | 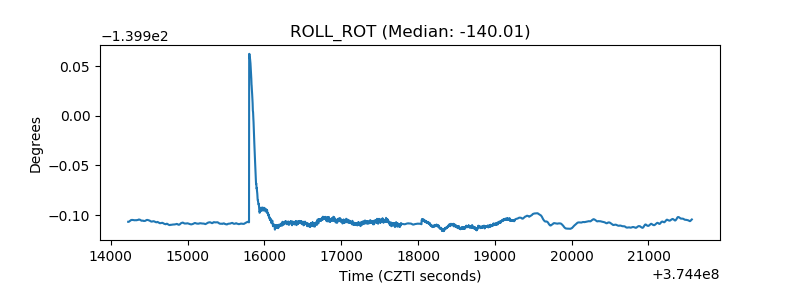 |
| _Roll_DEC | 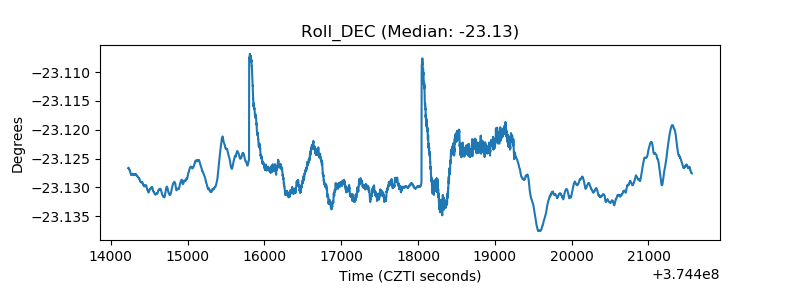 |
| _Roll_RA |  |
| Veto Counter | 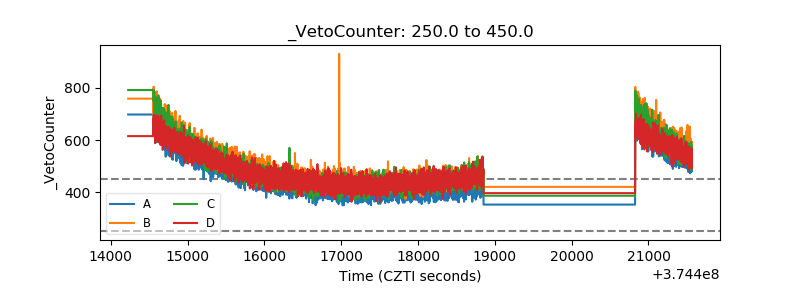 |