| Param | Original file | Final file |
|---|---|---|
| Filename | modeM0/AS1A11_046T06_9000004764_33119cztM0_level2.evt | modeM0/AS1A11_046T06_9000004764_33119cztM0_level2_quad_clean.evt |
| Size (bytes) | 510,134,400 | 100,128,960 |
| Size | 486.5 MB | 95.5 MB |
| Events in quadrant A | 2,729,501 | 698,042 |
| Events in quadrant B | 4,084,222 | 675,509 |
| Events in quadrant C | 3,260,454 | 659,170 |
| Events in quadrant D | 5,011,400 | 623,562 |
| Mode M0 | |||
|---|---|---|---|
| Quadrant | BADHDUFLAG | Total packets | Discarded packets |
| A | 0 | 11266 | 2 |
| B | 0 | 15558 | 1 |
| C | 0 | 13047 | 1 |
| D | 0 | 18577 | 1 |
| Mode M9 | |||
|---|---|---|---|
| Quadrant | BADHDUFLAG | Total packets | Discarded packets |
| A | 0 | 21 | 0 |
| B | 0 | 21 | 0 |
| C | 0 | 21 | 0 |
| D | 0 | 22 | 0 |
| Mode SS | |||
|---|---|---|---|
| Quadrant | BADHDUFLAG | Total packets | Discarded packets |
| A | 0 | 110 | 0 |
| B | 0 | 110 | 0 |
| C | 0 | 110 | 0 |
| D | 0 | 110 | 0 |
| Quadrant | Total seconds | Saturated seconds | Saturation percentage |
|---|---|---|---|
| A | 5368 | 8 | 0.149031% |
| B | 5368 | 467 | 8.699702% |
| C | 5368 | 87 | 1.620715% |
| D | 5368 | 439 | 8.178092% |
Noise dominated data is calculated using 1-second bins in cleaned event files. If a bin has >2000 counts, and if more than 50% of those come from <1% of pixels, then it is considered to be noise-dominated and hence unusable.
| Quadrant | # 1 sec bins | Bins with >0 counts | Bins with >2000 counts | High rate bins dominated by noise | Noise dominated (total time) | Noise dominated (detector-on time) | Marked lightcurve |
|---|---|---|---|---|---|---|---|
| A | 7431 | 5369 | 0 | 0 | 0.00% | 0.00% | 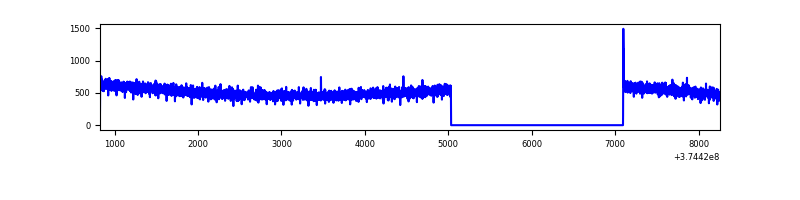 |
| B | 7431 | 5369 | 311 | 311 | 4.19% | 5.79% | 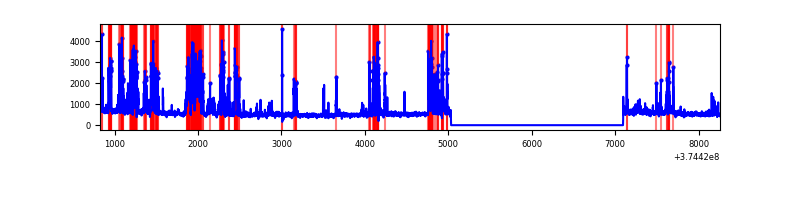 |
| C | 7431 | 5369 | 63 | 63 | 0.85% | 1.17% | 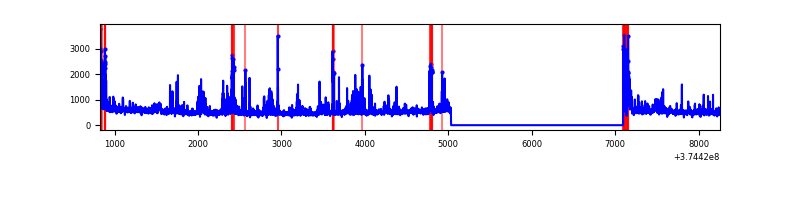 |
| D | 7431 | 5369 | 370 | 370 | 4.98% | 6.89% | 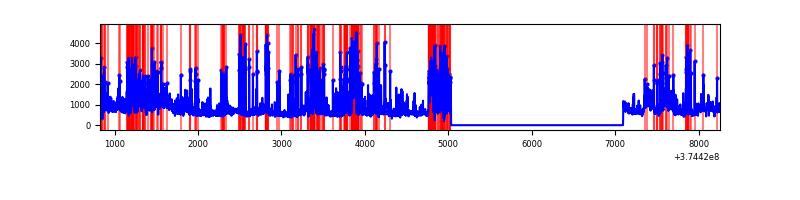 |
Top three noisy pixels from each quadrant. If the there are fewer than three noisy pixels in the level2.evt file, extra rows are filled as -1
| Pixel properties | Quadrant properties | ||||||
|---|---|---|---|---|---|---|---|
| Quadrant | DetID | PixID | Counts | Sigma | Mean | Median | Sigma |
| A | 13 | 254 | 10764 | 71.36 | 704 | 694 | 141.1 |
| A | 13 | 6 | 6275 | 39.55 | 704 | 694 | 141.1 |
| A | 0 | 226 | 6041 | 37.89 | 704 | 694 | 141.1 |
| B | 5 | 172 | 1150474 | 9013.33 | 674 | 662 | 127.6 |
| B | 5 | 200 | 153300 | 1196.52 | 674 | 662 | 127.6 |
| B | 0 | 189 | 43936 | 339.22 | 674 | 662 | 127.6 |
| C | 7 | 221 | 449894 | 3001.02 | 654 | 662 | 149.7 |
| C | 0 | 10 | 207177 | 1379.59 | 654 | 662 | 149.7 |
| C | 8 | 79 | 12099 | 76.4 | 654 | 662 | 149.7 |
| D | 7 | 223 | 634255 | 4047.73 | 643 | 628 | 156.5 |
| D | 8 | 195 | 597536 | 3813.16 | 643 | 628 | 156.5 |
| D | 12 | 6 | 487682 | 3111.39 | 643 | 628 | 156.5 |
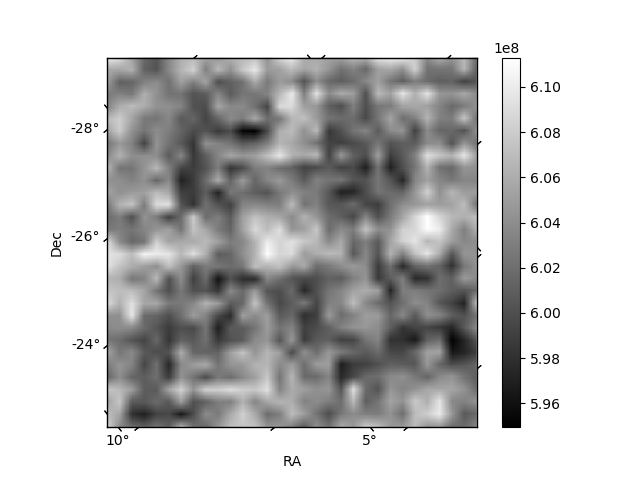
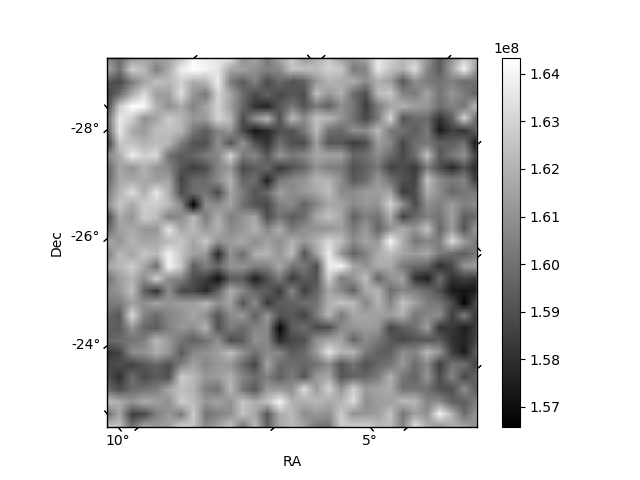
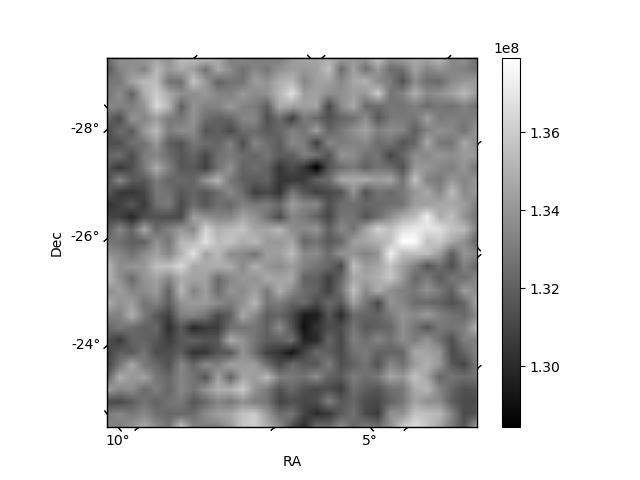
Histogram calculated using DETX and DETY for each event in the final _common_clean file
| Quadrant A | 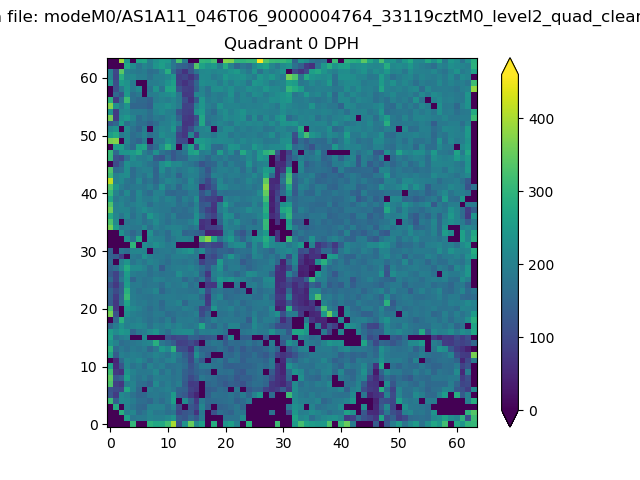 |
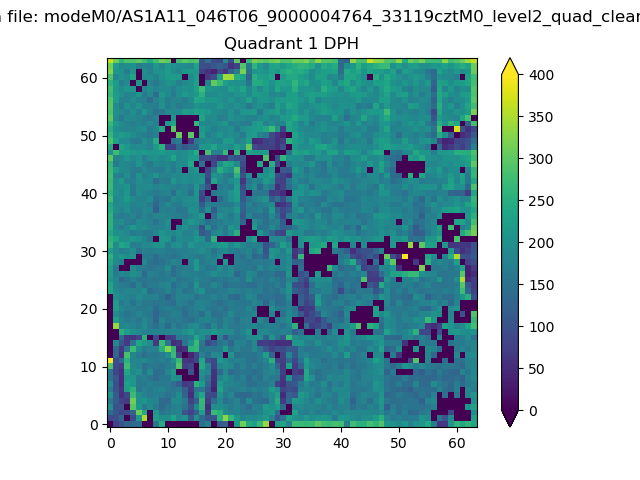 |
Quadrant B |
|---|---|---|---|
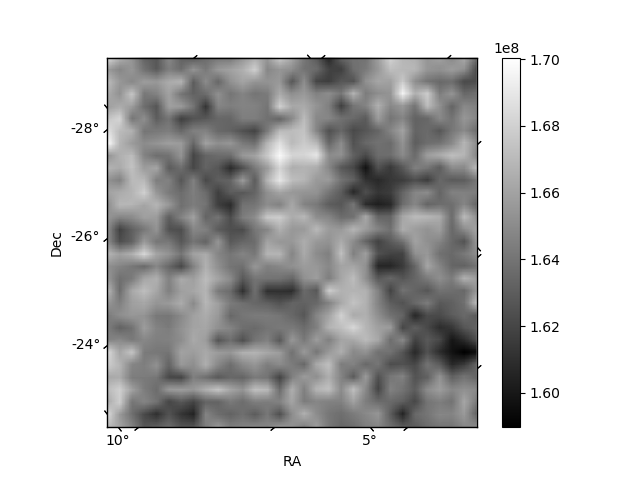
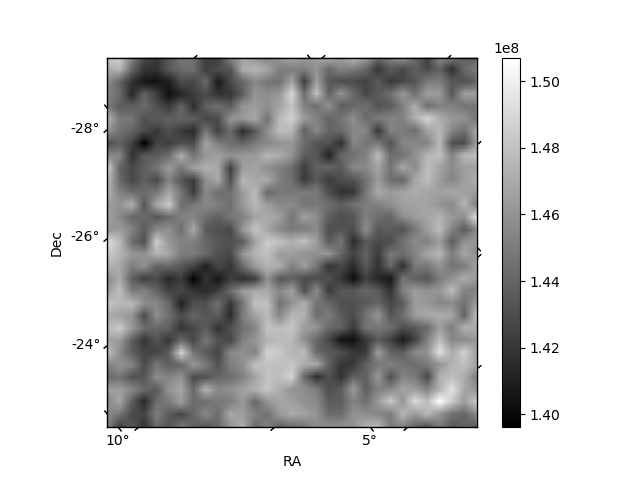
| Quadrant D | 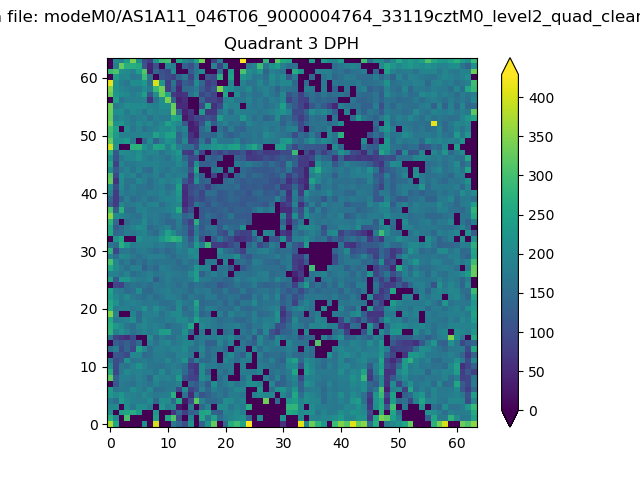 |
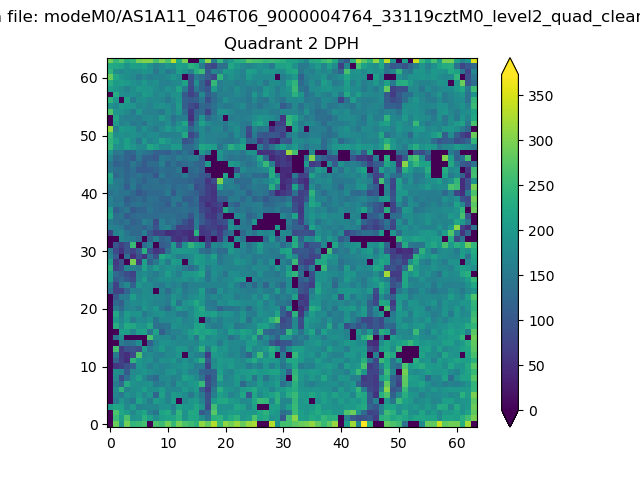 |
Quadrant C |
| Plot type | Count rate plots | Images |
|---|---|---|
| Comparison with Poisson distribution Blue bars denote a histogram of data divided into 1 sec bins. Red curve is a Poisson curve with rate = median count rate of data. |
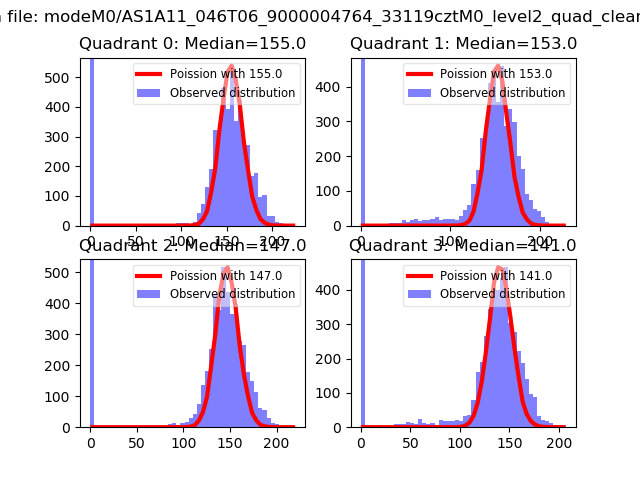 |
 |
| Quadrant-wise count rates Data is divided into 100 sec bins |
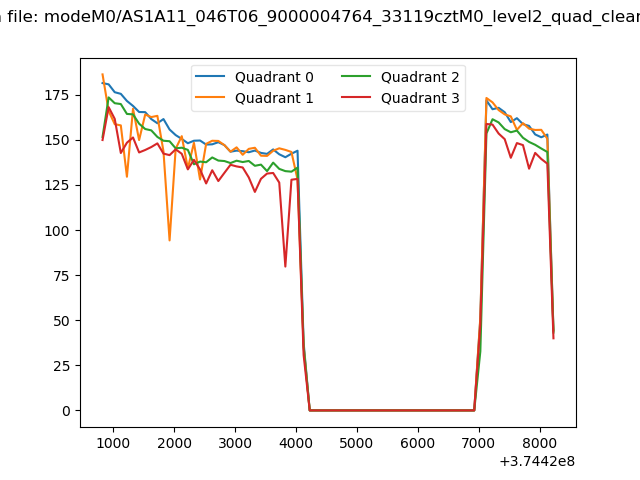 |
|
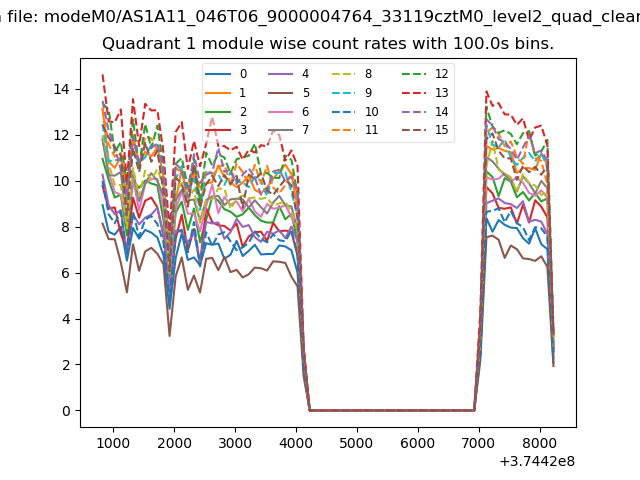
| Module-wise count rates for Quadrant A Data is divided into 100 sec bins |
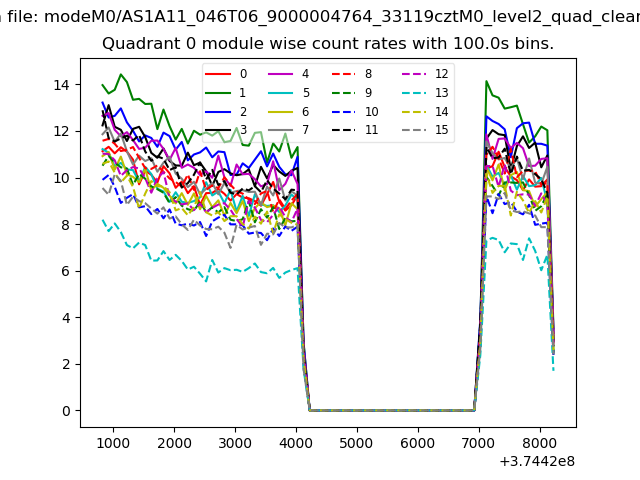 |
 |
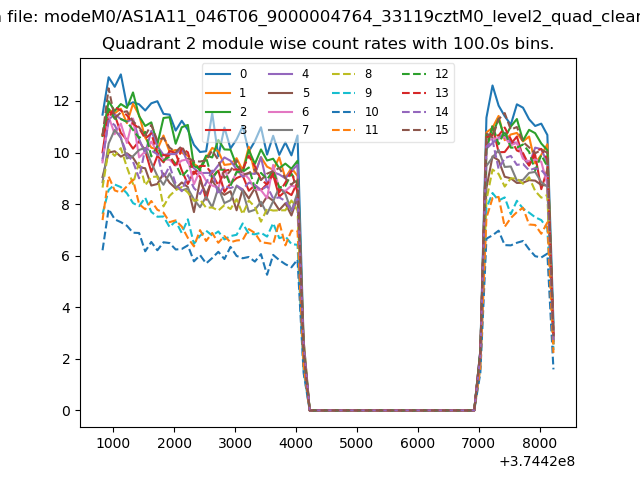
| Module-wise count rates for Quadrant B Data is divided into 100 sec bins |
 |
 |
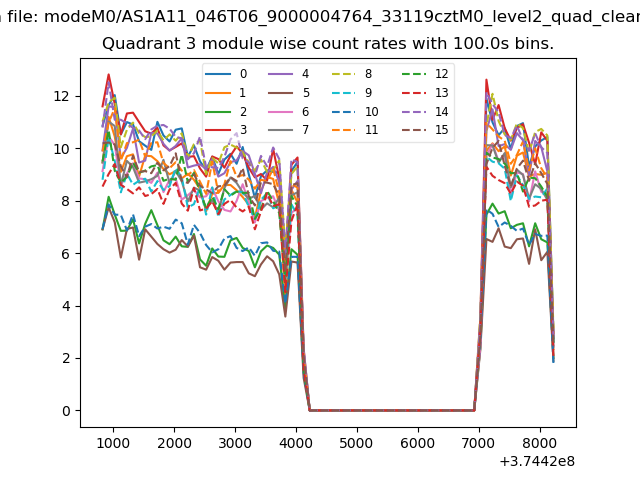
| Module-wise count rates for Quadrant C Data is divided into 100 sec bins |
 |
 |
| Module-wise count rates for Quadrant D Data is divided into 100 sec bins |
 |
 |
| Parameter | Plot |
|---|---|
| CZT HV Monitor |  |
| D_VDD | 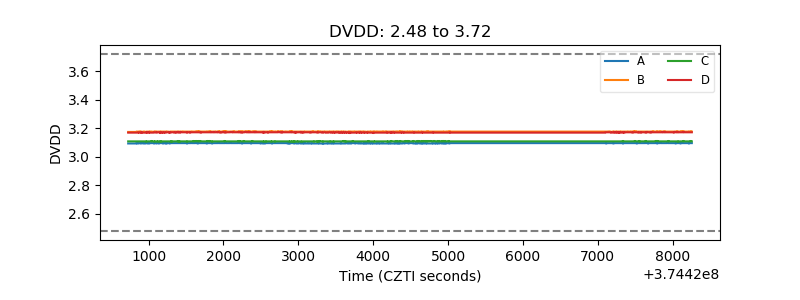 |
| Temperature 1 | 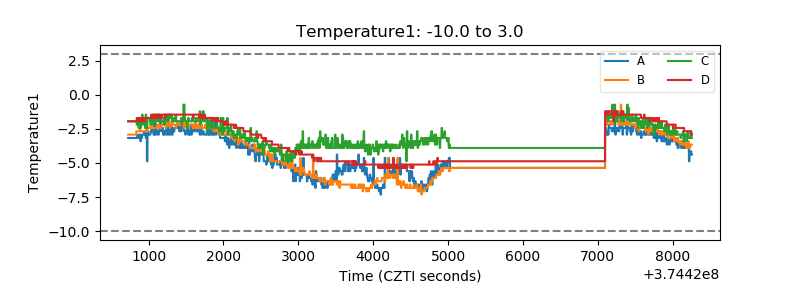 |
| Veto HV Monitor | 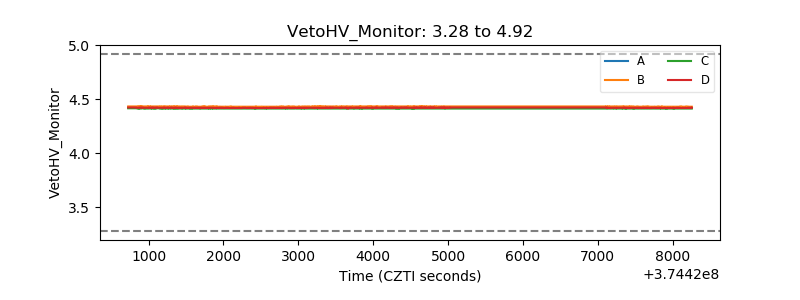 |
| Veto LLD | 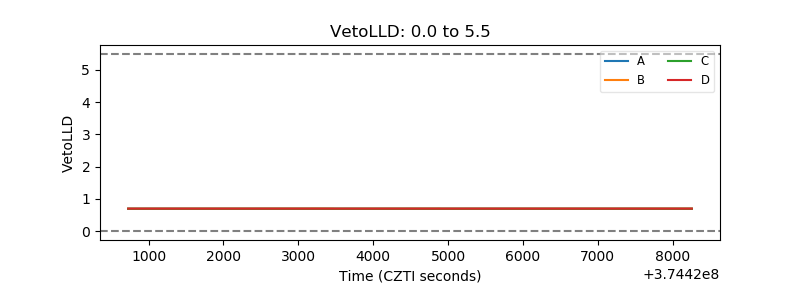 |
| Alpha Counter | 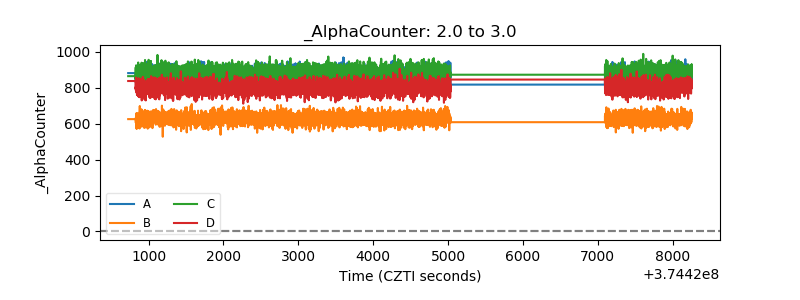 |
| _CPM_Rate | 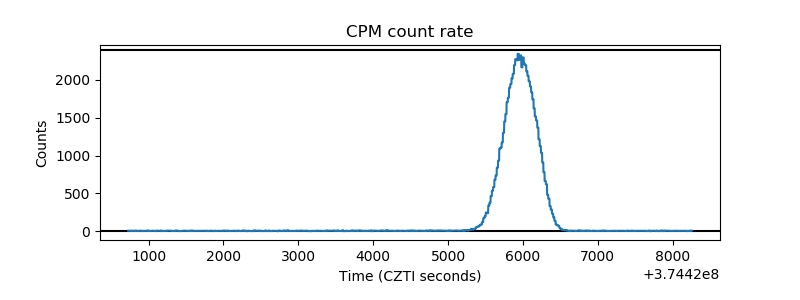 |
| CZT Counter | 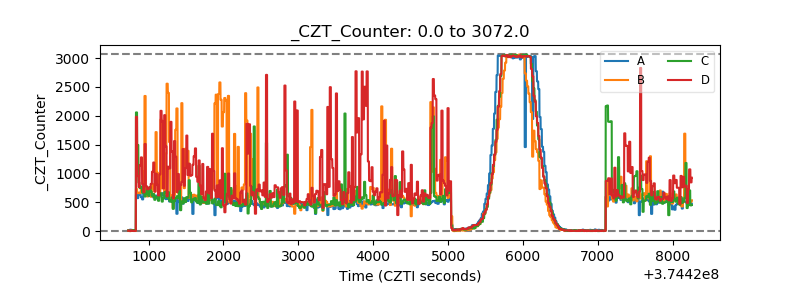 |
| +2.5 Volts monitor | 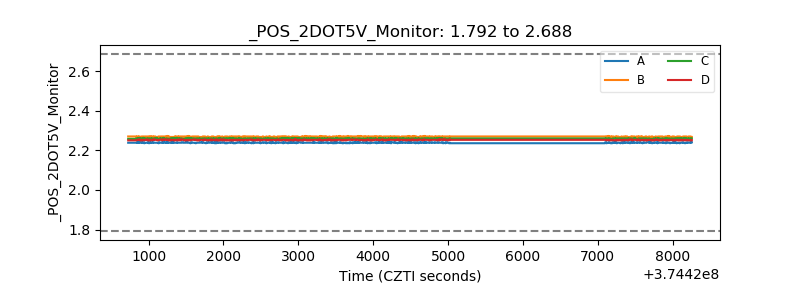 |
| +5 Volts monitor |  |
| _ROLL_ROT | 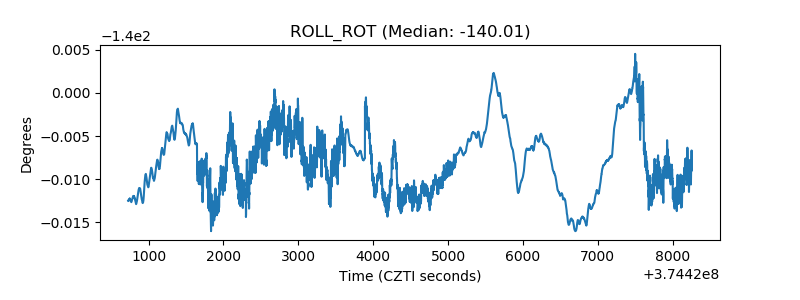 |
| _Roll_DEC | 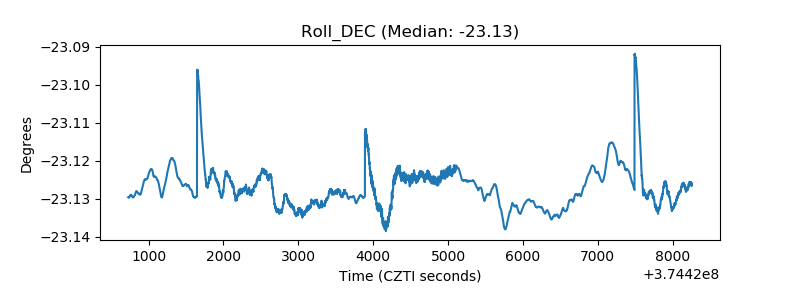 |
| _Roll_RA | 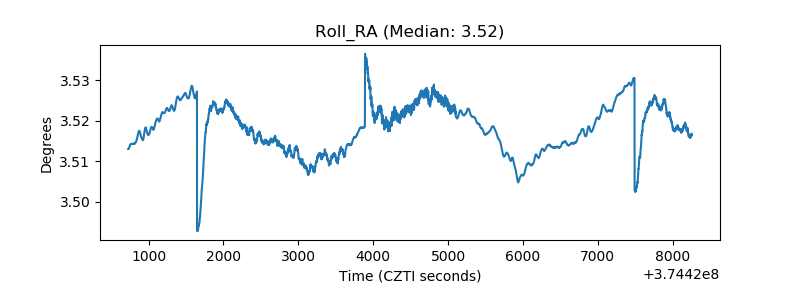 |
| Veto Counter | 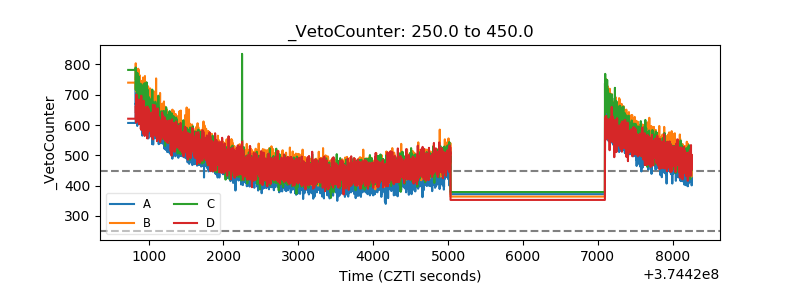 |