| Param | Original file | Final file |
|---|---|---|
| Filename | modeM0/AS1A11_046T06_9000004764_33121cztM0_level2.evt | modeM0/AS1A11_046T06_9000004764_33121cztM0_level2_quad_clean.evt |
| Size (bytes) | 491,725,440 | 72,573,120 |
| Size | 468.9 MB | 69.2 MB |
| Events in quadrant A | 2,423,522 | 483,038 |
| Events in quadrant B | 3,005,996 | 484,272 |
| Events in quadrant C | 2,844,750 | 460,468 |
| Events in quadrant D | 6,264,705 | 404,822 |
| Mode M0 | |||
|---|---|---|---|
| Quadrant | BADHDUFLAG | Total packets | Discarded packets |
| A | 0 | 10523 | 3 |
| B | 0 | 12182 | 2 |
| C | 0 | 11818 | 2 |
| D | 0 | 22196 | 2 |
| Mode M9 | |||
|---|---|---|---|
| Quadrant | BADHDUFLAG | Total packets | Discarded packets |
| A | 0 | 29 | 0 |
| B | 0 | 29 | 0 |
| C | 0 | 29 | 0 |
| D | 0 | 30 | 0 |
| Mode SS | |||
|---|---|---|---|
| Quadrant | BADHDUFLAG | Total packets | Discarded packets |
| A | 0 | 106 | 0 |
| B | 0 | 106 | 0 |
| C | 0 | 106 | 0 |
| D | 0 | 106 | 0 |
| Quadrant | Total seconds | Saturated seconds | Saturation percentage |
|---|---|---|---|
| A | 5207 | 5 | 0.096025% |
| B | 5207 | 88 | 1.690033% |
| C | 5207 | 75 | 1.440369% |
| D | 5207 | 805 | 15.459958% |
Noise dominated data is calculated using 1-second bins in cleaned event files. If a bin has >2000 counts, and if more than 50% of those come from <1% of pixels, then it is considered to be noise-dominated and hence unusable.
| Quadrant | # 1 sec bins | Bins with >0 counts | Bins with >2000 counts | High rate bins dominated by noise | Noise dominated (total time) | Noise dominated (detector-on time) | Marked lightcurve |
|---|---|---|---|---|---|---|---|
| A | 7300 | 5208 | 1 | 1 | 0.01% | 0.02% | 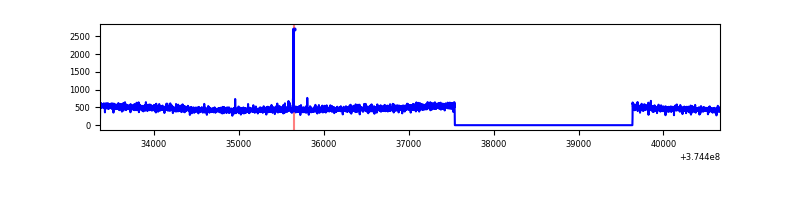 |
| B | 7300 | 5208 | 70 | 70 | 0.96% | 1.34% | 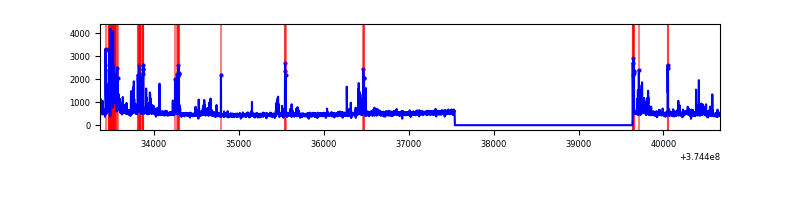 |
| C | 7300 | 5208 | 61 | 61 | 0.84% | 1.17% | 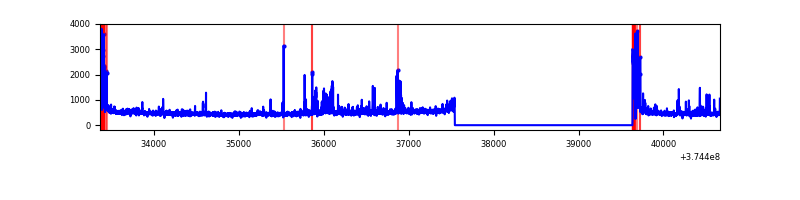 |
| D | 7300 | 5208 | 867 | 867 | 11.88% | 16.65% | 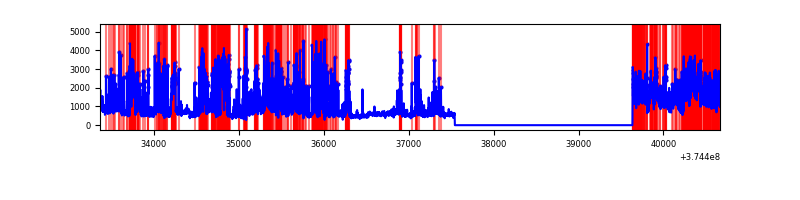 |
Top three noisy pixels from each quadrant. If the there are fewer than three noisy pixels in the level2.evt file, extra rows are filled as -1
| Pixel properties | Quadrant properties | ||||||
|---|---|---|---|---|---|---|---|
| Quadrant | DetID | PixID | Counts | Sigma | Mean | Median | Sigma |
| A | 13 | 6 | 11622 | 88.52 | 621 | 612 | 124.4 |
| A | 7 | 16 | 10323 | 78.07 | 621 | 612 | 124.4 |
| A | 13 | 254 | 9890 | 74.59 | 621 | 612 | 124.4 |
| B | 5 | 172 | 391701 | 3262.06 | 623 | 606 | 119.9 |
| B | 0 | 189 | 33793 | 276.8 | 623 | 606 | 119.9 |
| B | 0 | 190 | 31199 | 255.17 | 623 | 606 | 119.9 |
| C | 0 | 10 | 259229 | 1884.73 | 592 | 597 | 137.2 |
| C | 7 | 221 | 186226 | 1352.73 | 592 | 597 | 137.2 |
| C | 8 | 111 | 26400 | 188.03 | 592 | 597 | 137.2 |
| D | 7 | 223 | 2004157 | 13719.73 | 561 | 550 | 146.0 |
| D | 8 | 195 | 546193 | 3736.3 | 561 | 550 | 146.0 |
| D | 12 | 6 | 368877 | 2522.13 | 561 | 550 | 146.0 |
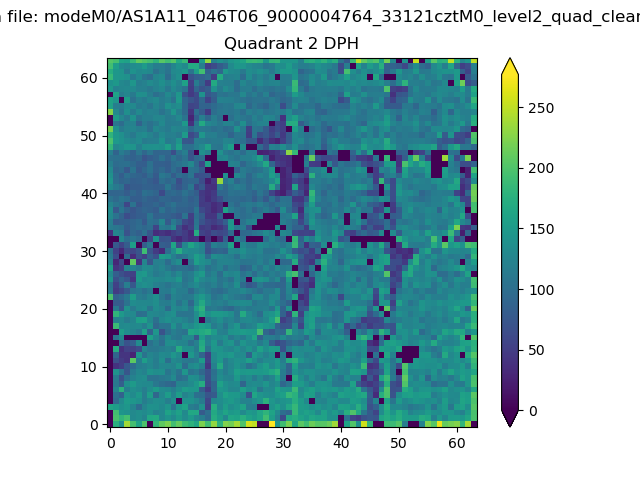
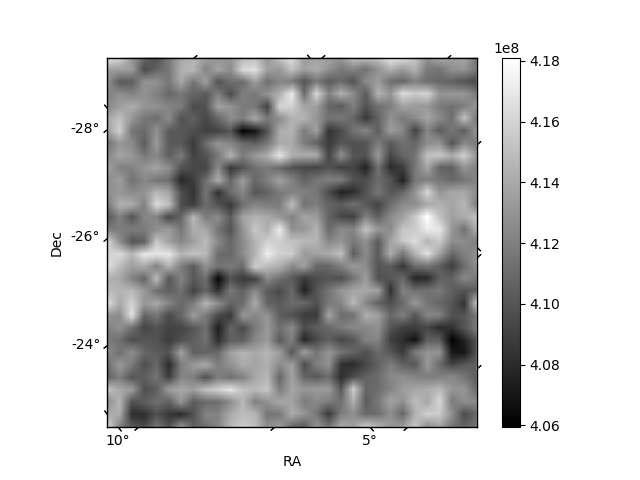
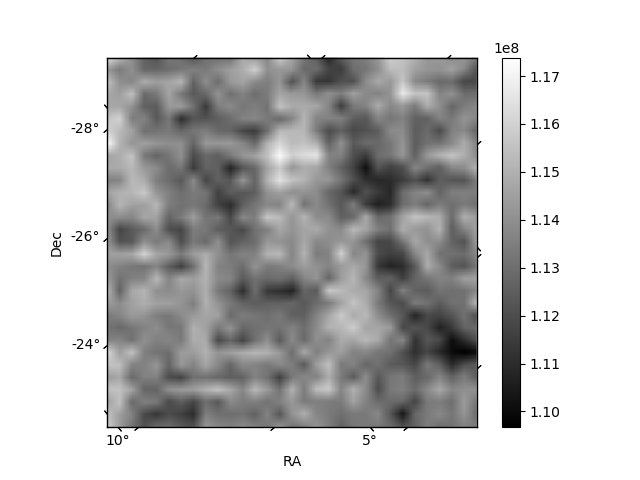
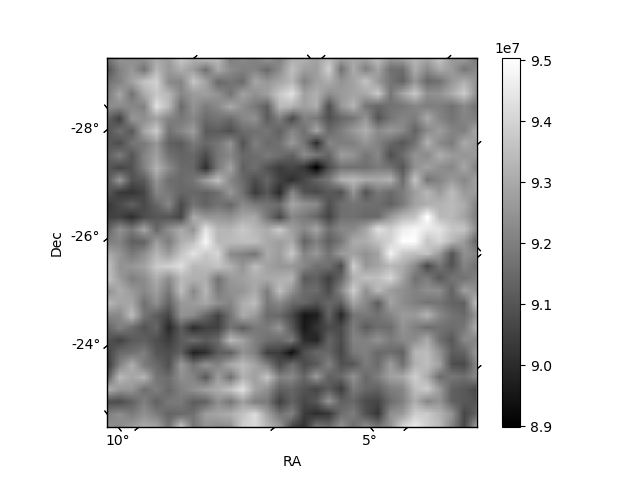
Histogram calculated using DETX and DETY for each event in the final _common_clean file
| Quadrant A | 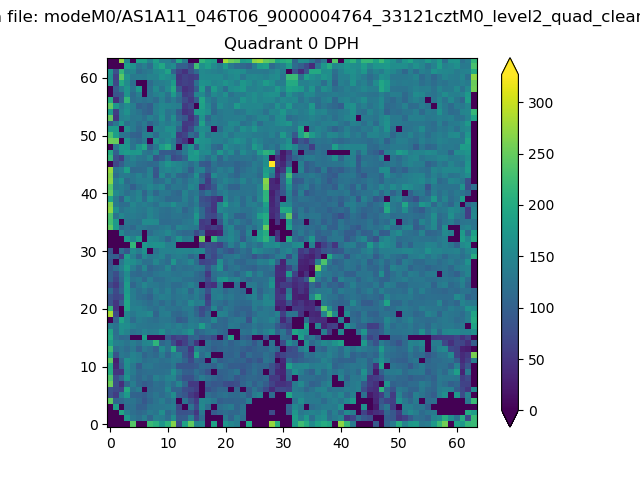 |
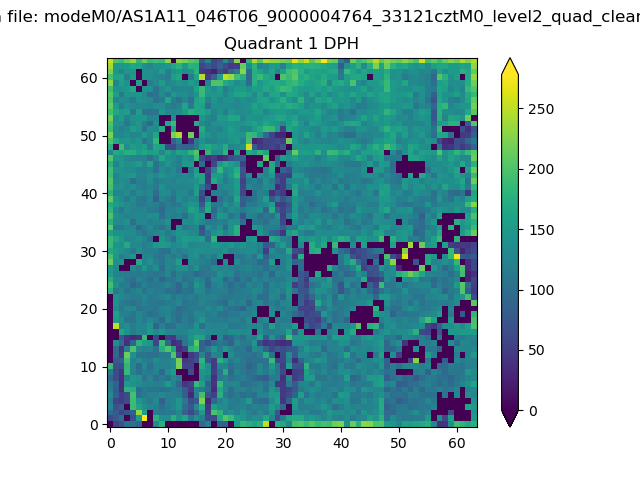 |
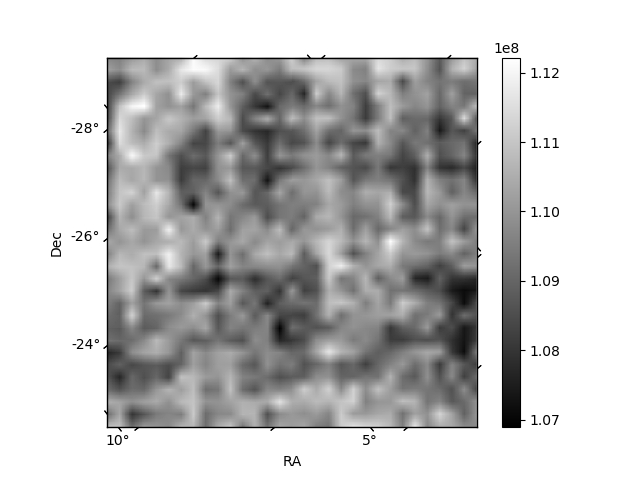
Quadrant B |
|---|---|---|---|
| Quadrant D | 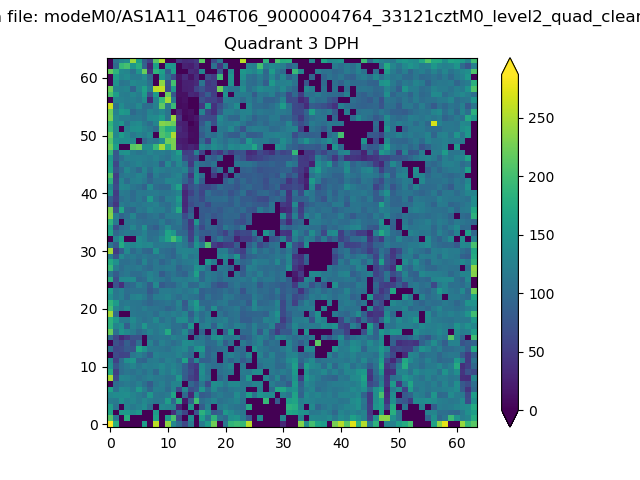 |
 |
Quadrant C |
| Plot type | Count rate plots | Images |
|---|---|---|
| Comparison with Poisson distribution Blue bars denote a histogram of data divided into 1 sec bins. Red curve is a Poisson curve with rate = median count rate of data. |
 |
 |
| Quadrant-wise count rates Data is divided into 100 sec bins |
 |
|
| Module-wise count rates for Quadrant A Data is divided into 100 sec bins |
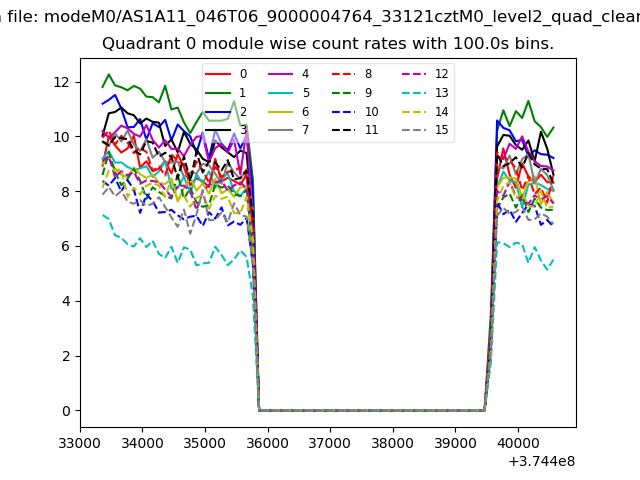 |
 |
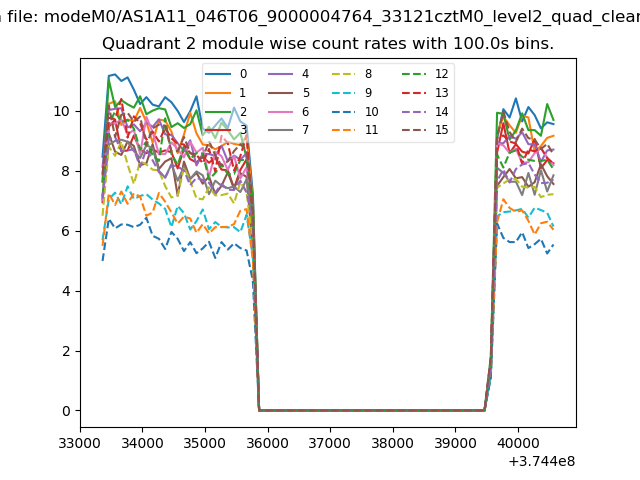
| Module-wise count rates for Quadrant B Data is divided into 100 sec bins |
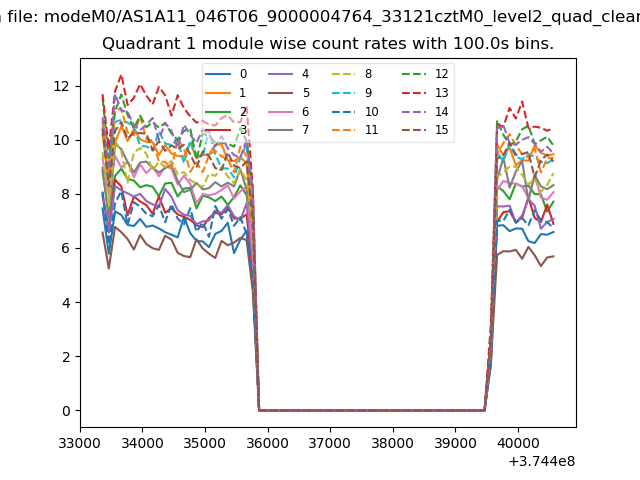 |
 |
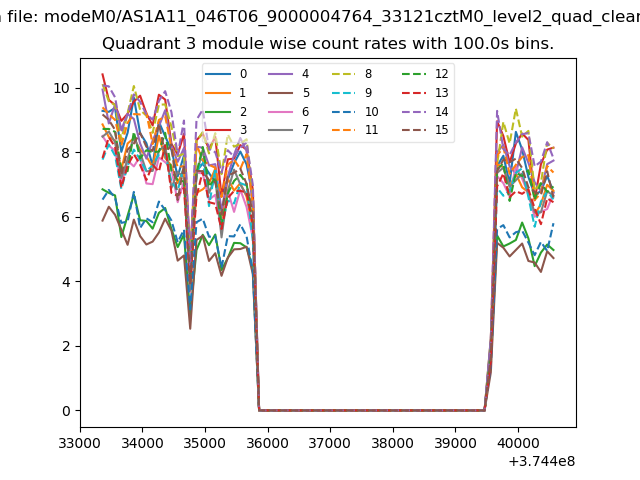
| Module-wise count rates for Quadrant C Data is divided into 100 sec bins |
 |
 |
| Module-wise count rates for Quadrant D Data is divided into 100 sec bins |
 |
 |
| Parameter | Plot |
|---|---|
| CZT HV Monitor | 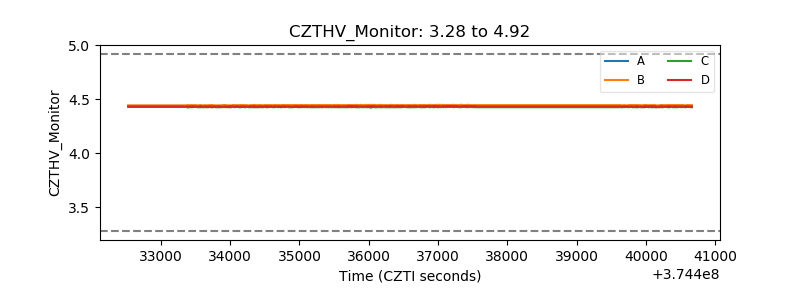 |
| D_VDD | 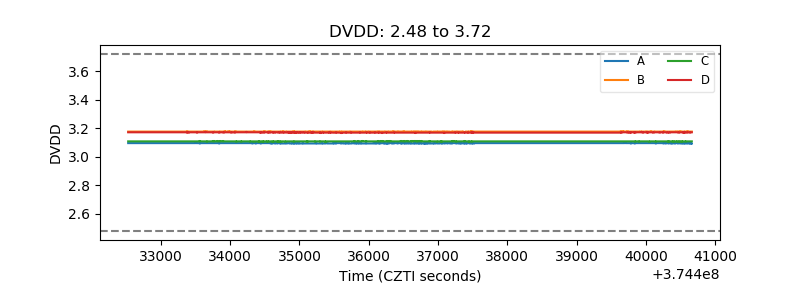 |
| Temperature 1 | 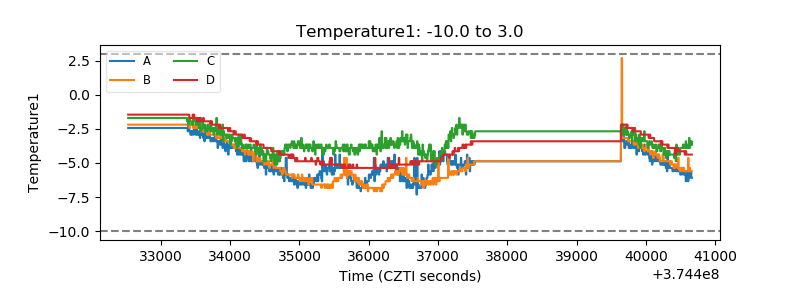 |
| Veto HV Monitor | 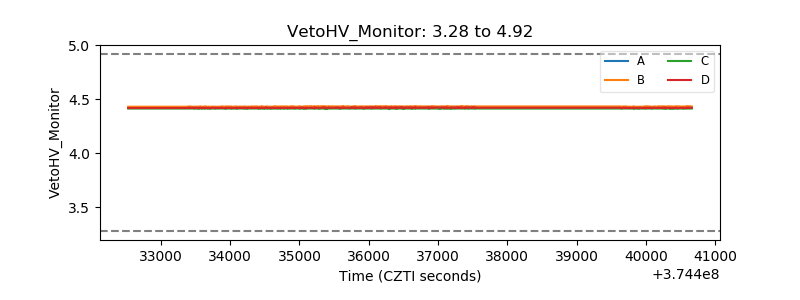 |
| Veto LLD | 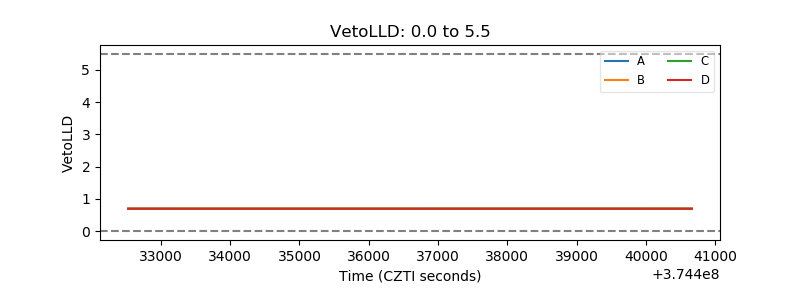 |
| Alpha Counter | 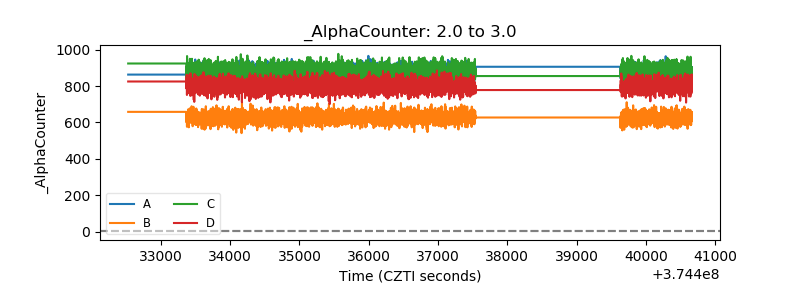 |
| _CPM_Rate | 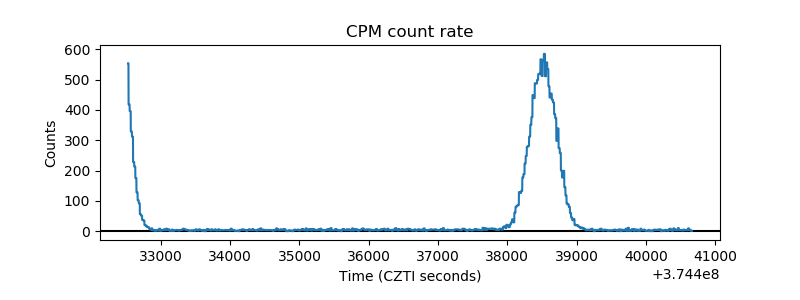 |
| CZT Counter | 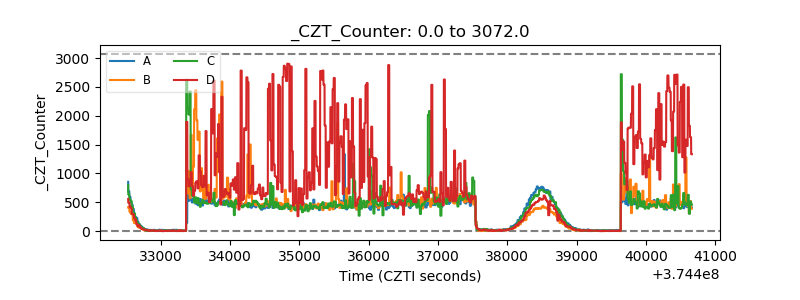 |
| +2.5 Volts monitor |  |
| +5 Volts monitor |  |
| _ROLL_ROT | 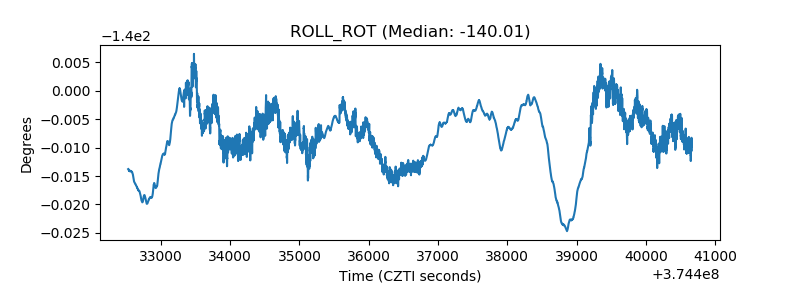 |
| _Roll_DEC | 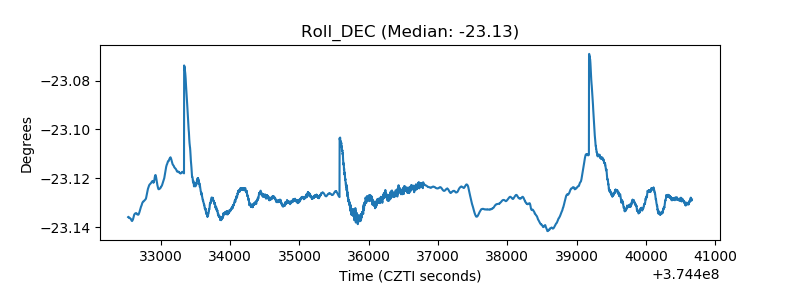 |
| _Roll_RA | 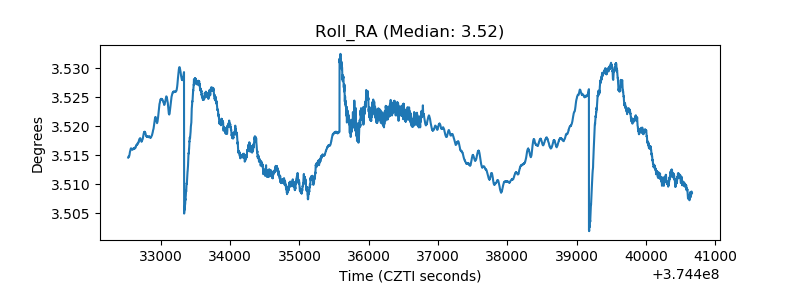 |
| Veto Counter | 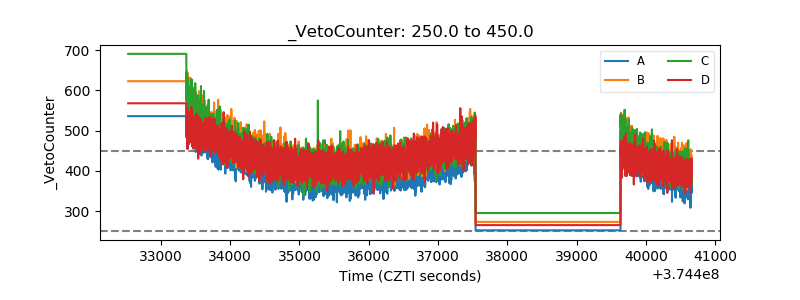 |