| Param | Original file | Final file |
|---|---|---|
| Filename | modeM0/AS1A11_046T06_9000004764_33122cztM0_level2.evt | modeM0/AS1A11_046T06_9000004764_33122cztM0_level2_quad_clean.evt |
| Size (bytes) | 427,075,200 | 50,601,600 |
| Size | 407.3 MB | 48.3 MB |
| Events in quadrant A | 2,108,848 | 317,776 |
| Events in quadrant B | 2,418,999 | 319,009 |
| Events in quadrant C | 2,697,739 | 302,521 |
| Events in quadrant D | 5,394,889 | 267,691 |
| Mode M0 | |||
|---|---|---|---|
| Quadrant | BADHDUFLAG | Total packets | Discarded packets |
| A | 0 | 9317 | 2 |
| B | 0 | 10094 | 2 |
| C | 0 | 10920 | 2 |
| D | 0 | 19341 | 2 |
| Mode M9 | |||
|---|---|---|---|
| Quadrant | BADHDUFLAG | Total packets | Discarded packets |
| A | 0 | 25 | 0 |
| B | 0 | 25 | 0 |
| C | 0 | 25 | 0 |
| D | 0 | 26 | 0 |
| Mode SS | |||
|---|---|---|---|
| Quadrant | BADHDUFLAG | Total packets | Discarded packets |
| A | 0 | 94 | 0 |
| B | 0 | 94 | 0 |
| C | 0 | 94 | 0 |
| D | 0 | 94 | 0 |
| Quadrant | Total seconds | Saturated seconds | Saturation percentage |
|---|---|---|---|
| A | 4620 | 6 | 0.129870% |
| B | 4620 | 47 | 1.017316% |
| C | 4620 | 78 | 1.688312% |
| D | 4620 | 556 | 12.034632% |
Noise dominated data is calculated using 1-second bins in cleaned event files. If a bin has >2000 counts, and if more than 50% of those come from <1% of pixels, then it is considered to be noise-dominated and hence unusable.
| Quadrant | # 1 sec bins | Bins with >0 counts | Bins with >2000 counts | High rate bins dominated by noise | Noise dominated (total time) | Noise dominated (detector-on time) | Marked lightcurve |
|---|---|---|---|---|---|---|---|
| A | 6503 | 4621 | 0 | 0 | 0.00% | 0.00% | 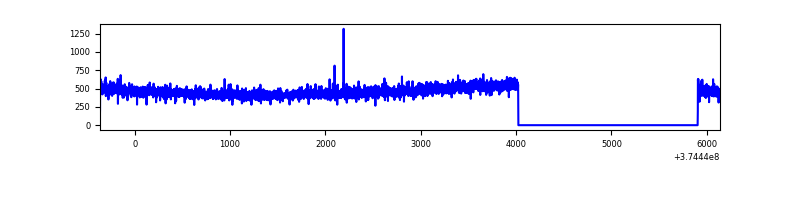 |
| B | 6503 | 4621 | 24 | 24 | 0.37% | 0.52% | 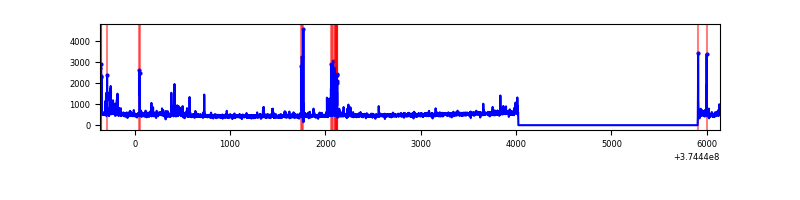 |
| C | 6503 | 4621 | 63 | 63 | 0.97% | 1.36% | 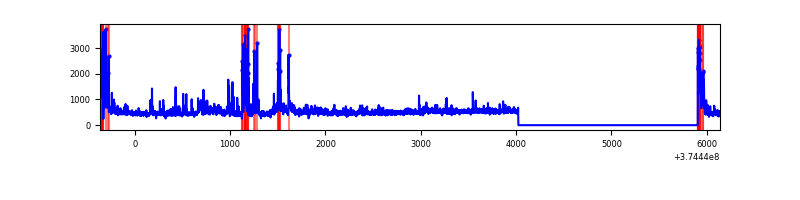 |
| D | 6503 | 4621 | 617 | 617 | 9.49% | 13.35% | 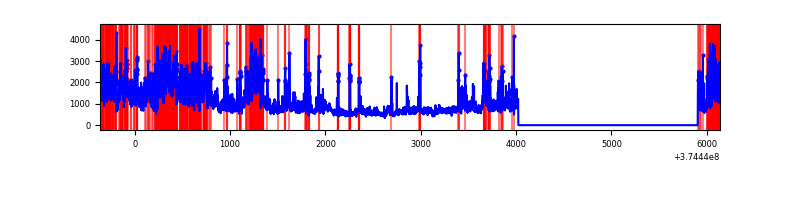 |
Top three noisy pixels from each quadrant. If the there are fewer than three noisy pixels in the level2.evt file, extra rows are filled as -1
| Pixel properties | Quadrant properties | ||||||
|---|---|---|---|---|---|---|---|
| Quadrant | DetID | PixID | Counts | Sigma | Mean | Median | Sigma |
| A | 13 | 6 | 9529 | 81.4 | 542 | 532 | 110.5 |
| A | 13 | 254 | 9463 | 80.81 | 542 | 532 | 110.5 |
| A | 3 | 137 | 5126 | 41.57 | 542 | 532 | 110.5 |
| B | 5 | 172 | 151569 | 1437.79 | 544 | 529 | 105.1 |
| B | 0 | 189 | 19336 | 179.03 | 544 | 529 | 105.1 |
| B | 0 | 190 | 18872 | 174.61 | 544 | 529 | 105.1 |
| C | 0 | 10 | 325866 | 2683.22 | 523 | 527 | 121.2 |
| C | 7 | 221 | 229782 | 1890.77 | 523 | 527 | 121.2 |
| C | 9 | 187 | 39807 | 323.96 | 523 | 527 | 121.2 |
| D | 7 | 223 | 2137055 | 15809.68 | 502 | 492 | 135.1 |
| D | 8 | 195 | 457005 | 3378.01 | 502 | 492 | 135.1 |
| D | 2 | 250 | 337113 | 2490.86 | 502 | 492 | 135.1 |
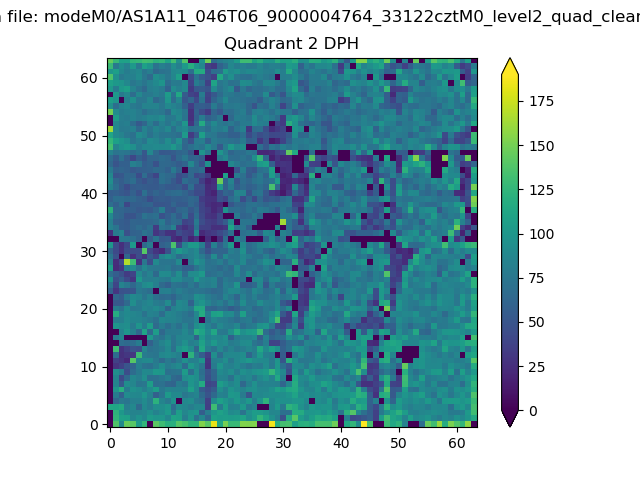
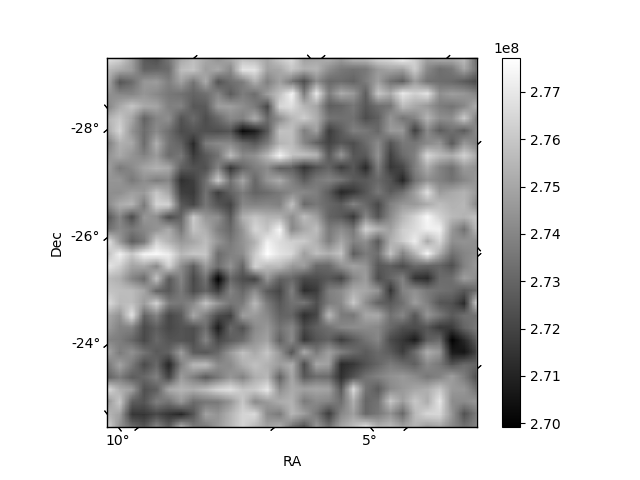
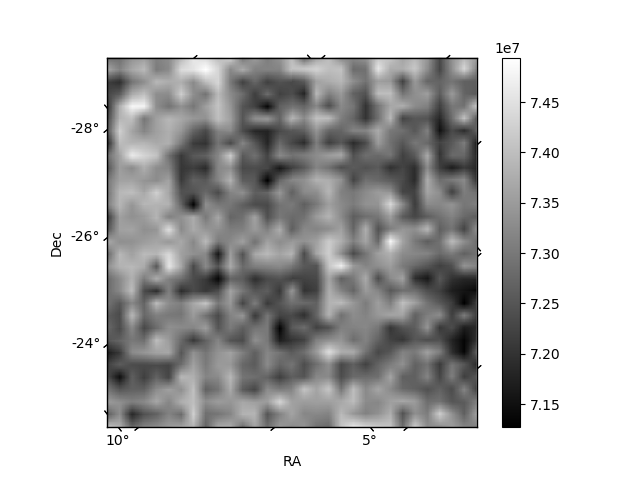
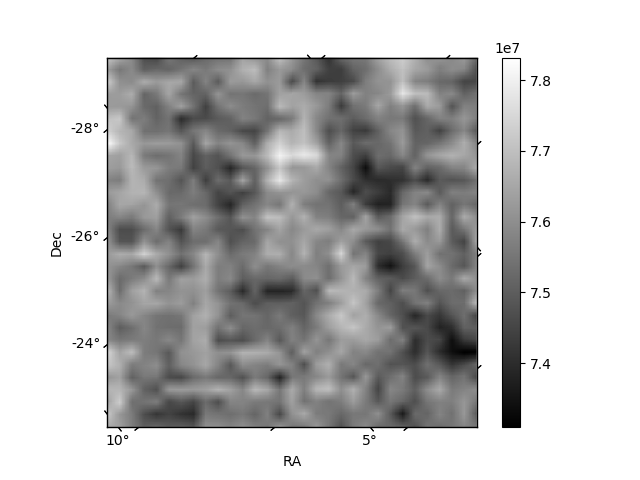
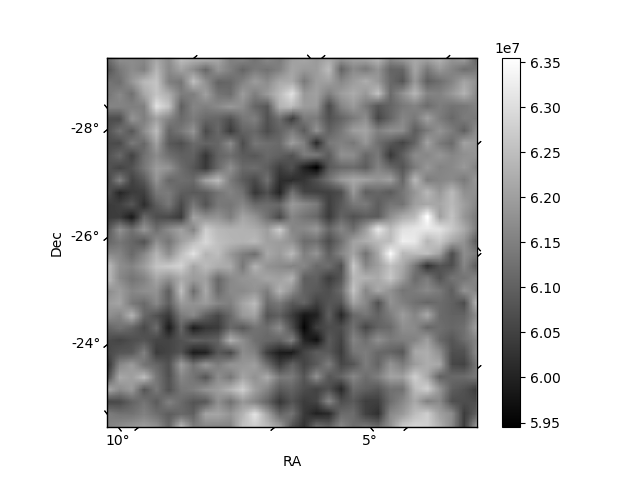
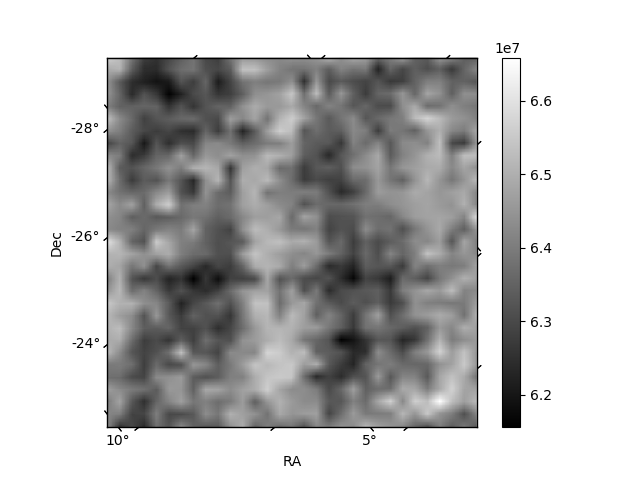
Histogram calculated using DETX and DETY for each event in the final _common_clean file
| Quadrant A | 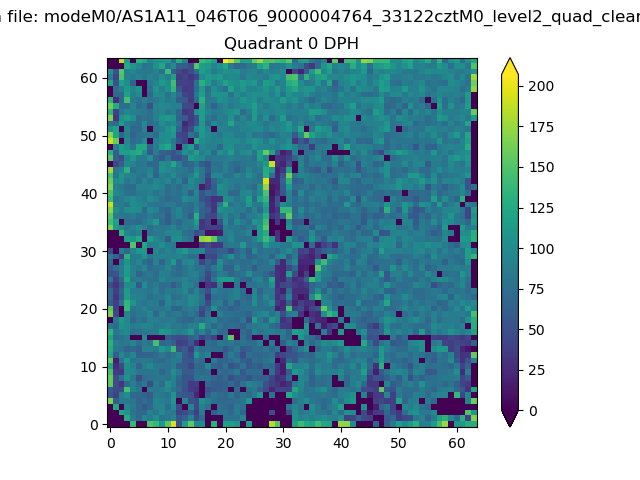 |
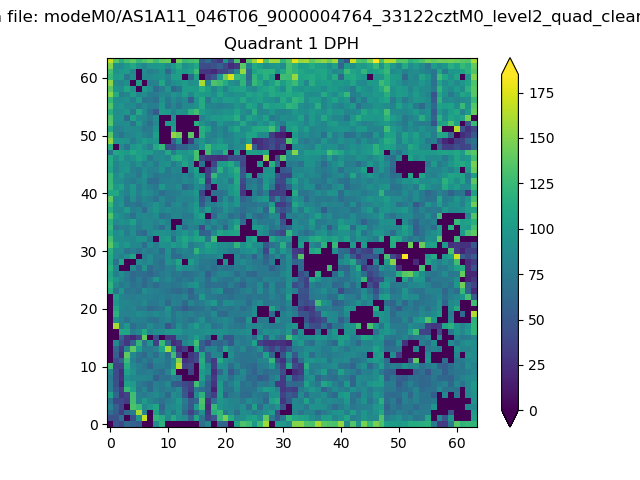 |
Quadrant B |
|---|---|---|---|
| Quadrant D | 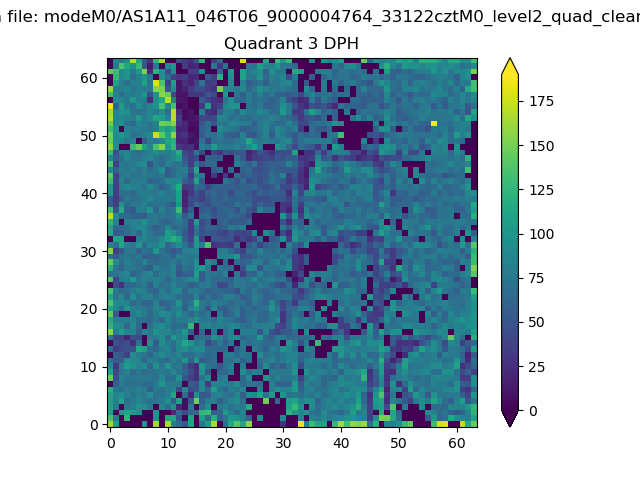 |
 |
Quadrant C |
| Plot type | Count rate plots | Images |
|---|---|---|
| Comparison with Poisson distribution Blue bars denote a histogram of data divided into 1 sec bins. Red curve is a Poisson curve with rate = median count rate of data. |
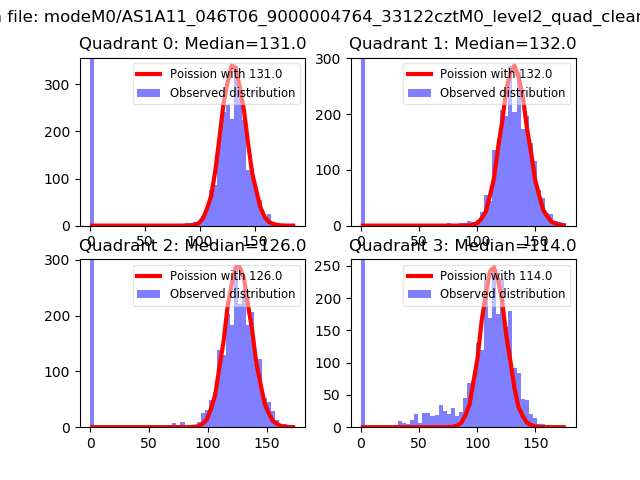 |
 |
| Quadrant-wise count rates Data is divided into 100 sec bins |
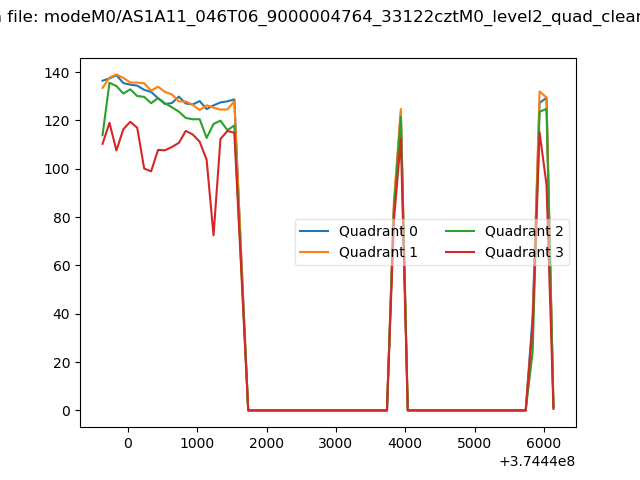 |
|
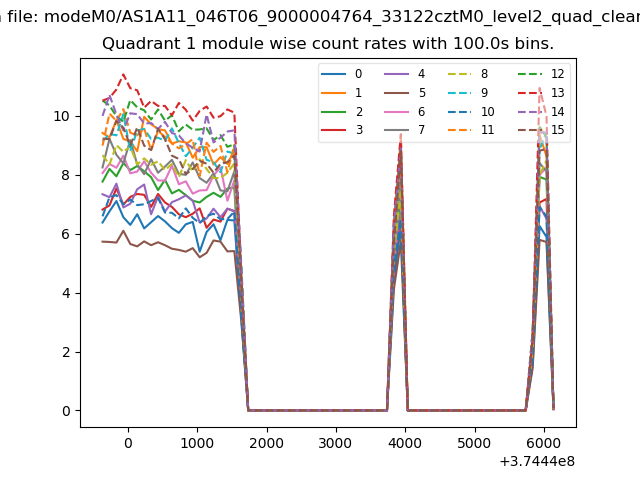
| Module-wise count rates for Quadrant A Data is divided into 100 sec bins |
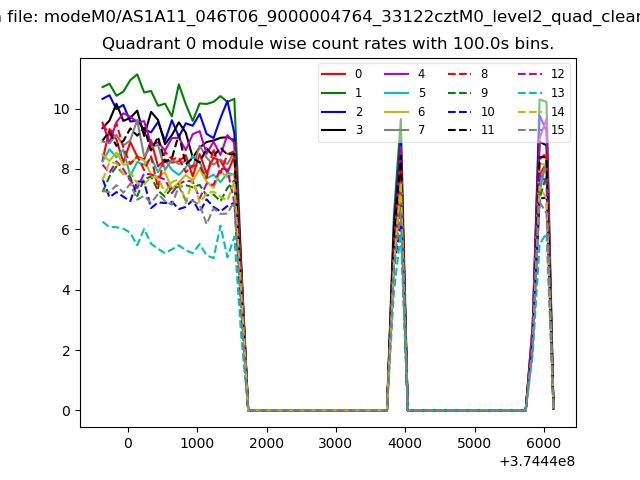 |
 |
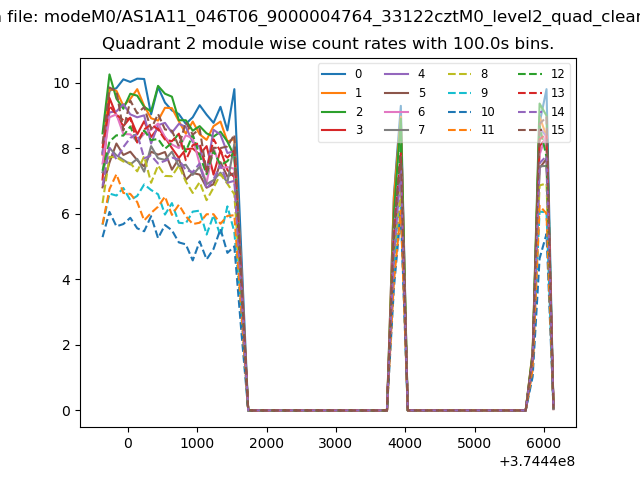
| Module-wise count rates for Quadrant B Data is divided into 100 sec bins |
 |
 |
| Module-wise count rates for Quadrant C Data is divided into 100 sec bins |
 |
 |
| Module-wise count rates for Quadrant D Data is divided into 100 sec bins |
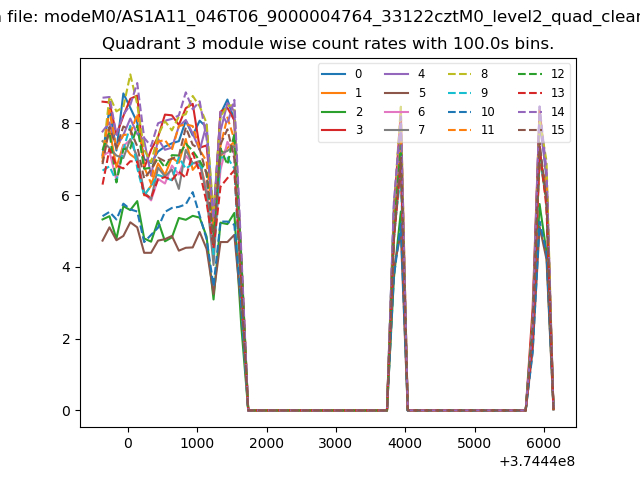 |
 |
| Parameter | Plot |
|---|---|
| CZT HV Monitor | 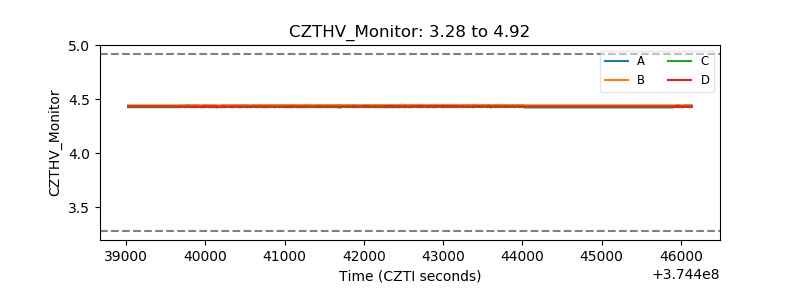 |
| D_VDD | 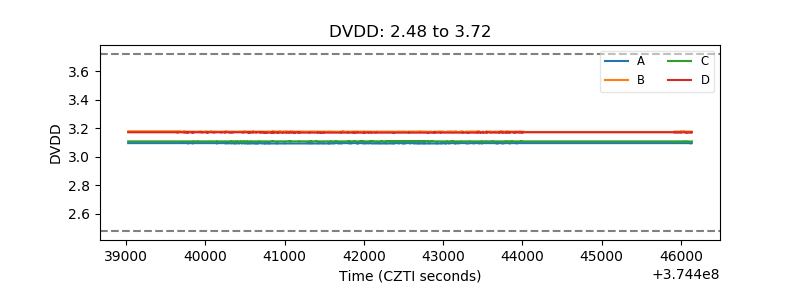 |
| Temperature 1 |  |
| Veto HV Monitor | 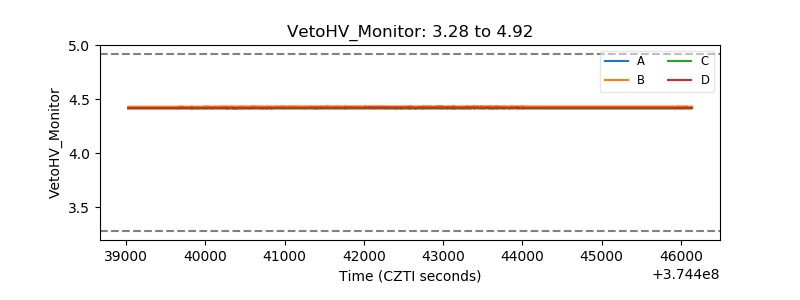 |
| Veto LLD | 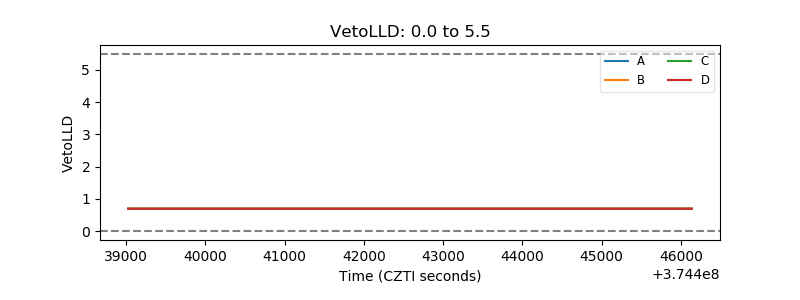 |
| Alpha Counter | 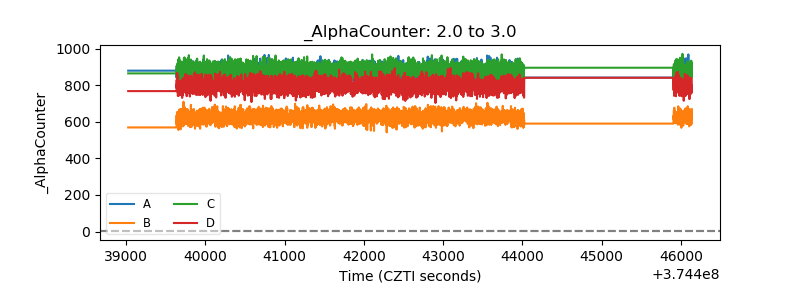 |
| _CPM_Rate | 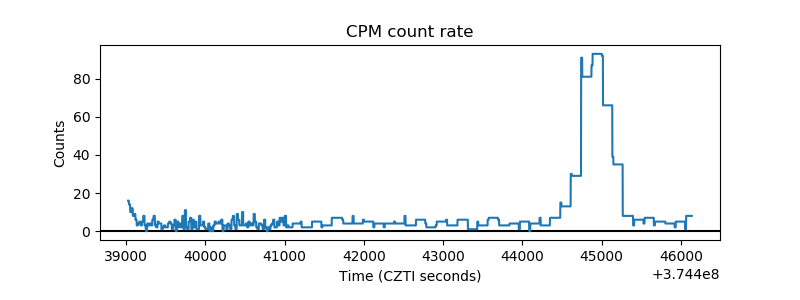 |
| CZT Counter | 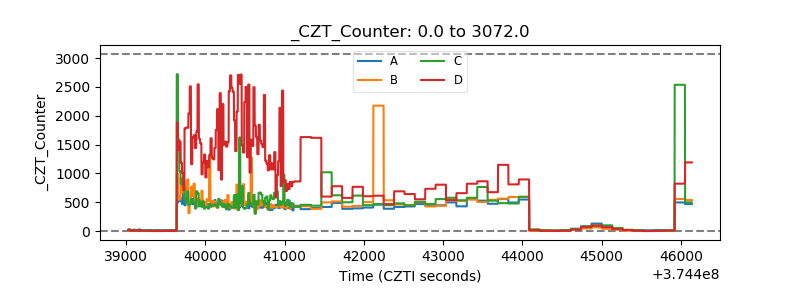 |
| +2.5 Volts monitor |  |
| +5 Volts monitor |  |
| _ROLL_ROT |  |
| _Roll_DEC |  |
| _Roll_RA | 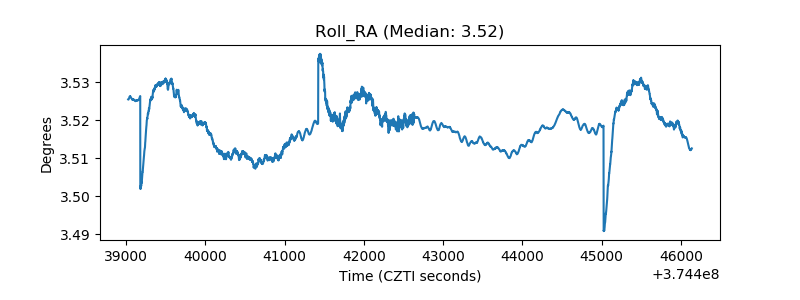 |
| Veto Counter | 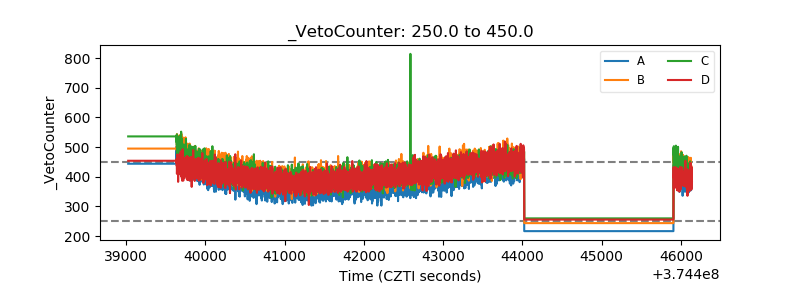 |