| Param | Original file | Final file |
|---|---|---|
| Filename | modeM0/AS1A11_096T01_9000004766_33123cztM0_level2.evt | modeM0/AS1A11_096T01_9000004766_33123cztM0_level2_quad_clean.evt |
| Size (bytes) | 392,281,920 | 65,036,160 |
| Size | 374.1 MB | 62.0 MB |
| Events in quadrant A | 1,967,760 | 429,987 |
| Events in quadrant B | 2,630,318 | 432,519 |
| Events in quadrant C | 2,343,666 | 420,592 |
| Events in quadrant D | 4,642,312 | 379,512 |
| Mode SS | |||
|---|---|---|---|
| Quadrant | BADHDUFLAG | Total packets | Discarded packets |
| A | 0 | 90 | 0 |
| B | 0 | 90 | 0 |
| C | 0 | 90 | 0 |
| D | 0 | 90 | 0 |
| Mode M0 | |||
|---|---|---|---|
| Quadrant | BADHDUFLAG | Total packets | Discarded packets |
| A | 0 | 8782 | 2 |
| B | 0 | 10742 | 1 |
| C | 0 | 9789 | 1 |
| D | 0 | 16795 | 1 |
| Mode M9 | |||
|---|---|---|---|
| Quadrant | BADHDUFLAG | Total packets | Discarded packets |
| A | 0 | 15 | 0 |
| B | 0 | 15 | 0 |
| C | 0 | 15 | 0 |
| D | 0 | 15 | 0 |
| Quadrant | Total seconds | Saturated seconds | Saturation percentage |
|---|---|---|---|
| A | 4353 | 8 | 0.183781% |
| B | 4353 | 148 | 3.399954% |
| C | 4353 | 70 | 1.608086% |
| D | 4353 | 471 | 10.820124% |
Noise dominated data is calculated using 1-second bins in cleaned event files. If a bin has >2000 counts, and if more than 50% of those come from <1% of pixels, then it is considered to be noise-dominated and hence unusable.
| Quadrant | # 1 sec bins | Bins with >0 counts | Bins with >2000 counts | High rate bins dominated by noise | Noise dominated (total time) | Noise dominated (detector-on time) | Marked lightcurve |
|---|---|---|---|---|---|---|---|
| A | 5876 | 4354 | 0 | 0 | 0.00% | 0.00% | 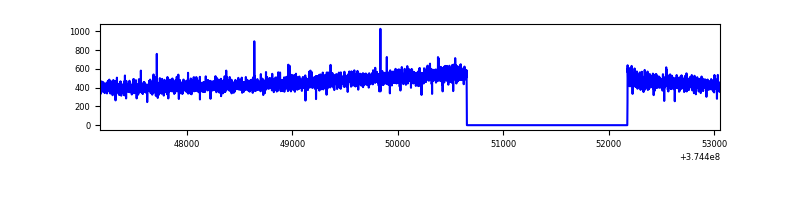 |
| B | 5876 | 4354 | 93 | 93 | 1.58% | 2.14% | 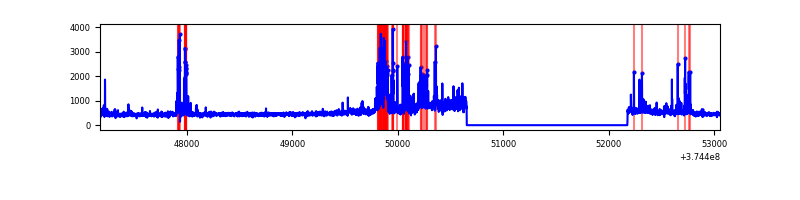 |
| C | 5876 | 4354 | 47 | 47 | 0.80% | 1.08% | 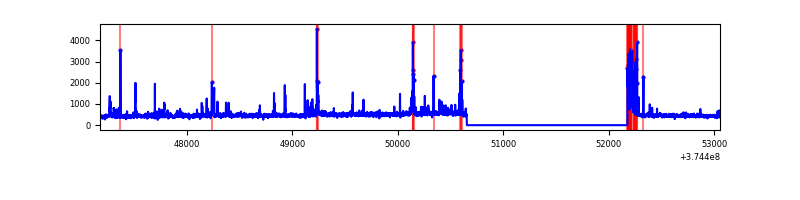 |
| D | 5876 | 4354 | 350 | 350 | 5.96% | 8.04% | 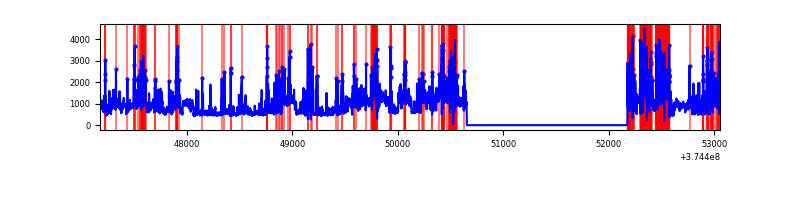 |
Top three noisy pixels from each quadrant. If the there are fewer than three noisy pixels in the level2.evt file, extra rows are filled as -1
| Pixel properties | Quadrant properties | ||||||
|---|---|---|---|---|---|---|---|
| Quadrant | DetID | PixID | Counts | Sigma | Mean | Median | Sigma |
| A | 13 | 254 | 7664 | 69.72 | 507 | 496 | 102.8 |
| A | 13 | 6 | 7659 | 69.67 | 507 | 496 | 102.8 |
| A | 3 | 137 | 4727 | 41.15 | 507 | 496 | 102.8 |
| B | 5 | 172 | 379513 | 3952.16 | 501 | 488 | 95.9 |
| B | 0 | 219 | 85342 | 884.79 | 501 | 488 | 95.9 |
| B | 0 | 189 | 84660 | 877.68 | 501 | 488 | 95.9 |
| C | 0 | 10 | 133064 | 1143.01 | 495 | 498 | 116.0 |
| C | 7 | 221 | 66649 | 570.37 | 495 | 498 | 116.0 |
| C | 1 | 241 | 55535 | 474.54 | 495 | 498 | 116.0 |
| D | 8 | 195 | 1088240 | 9454.91 | 466 | 456 | 115.0 |
| D | 12 | 218 | 505835 | 4392.7 | 466 | 456 | 115.0 |
| D | 7 | 223 | 251444 | 2181.56 | 466 | 456 | 115.0 |
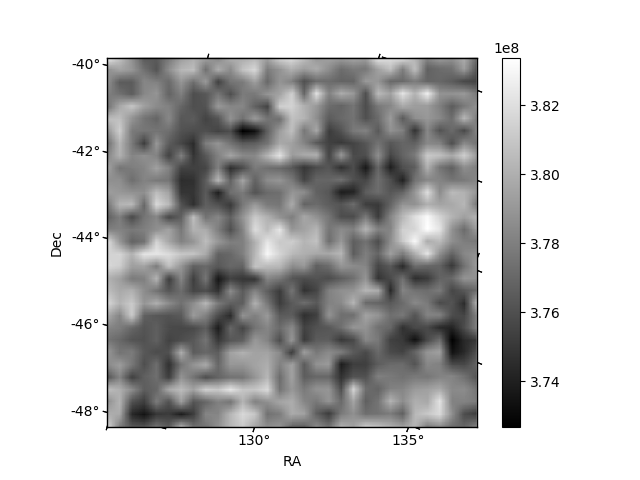
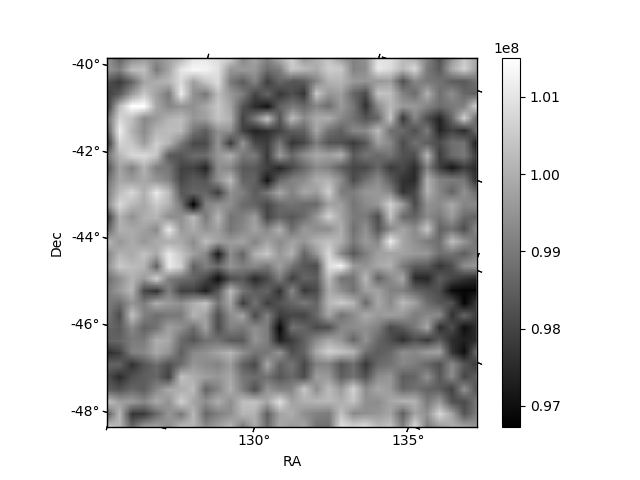
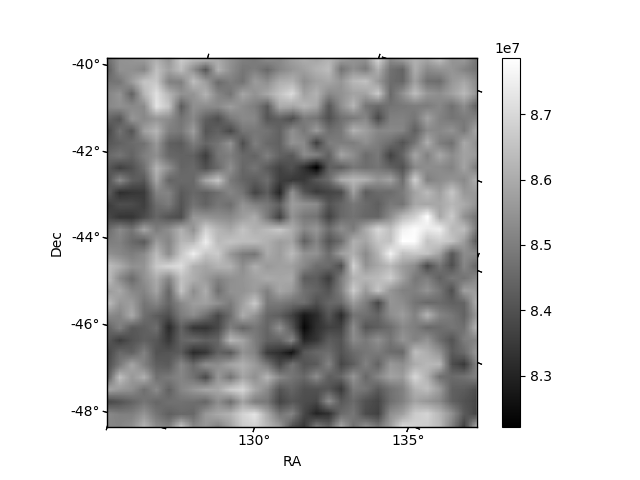
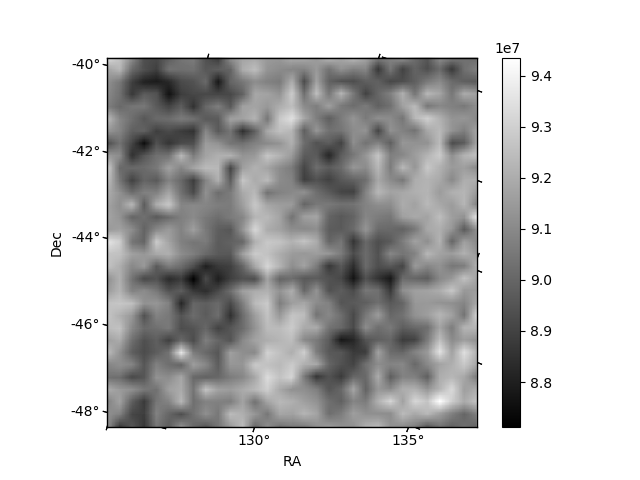
Histogram calculated using DETX and DETY for each event in the final _common_clean file
| Quadrant A | 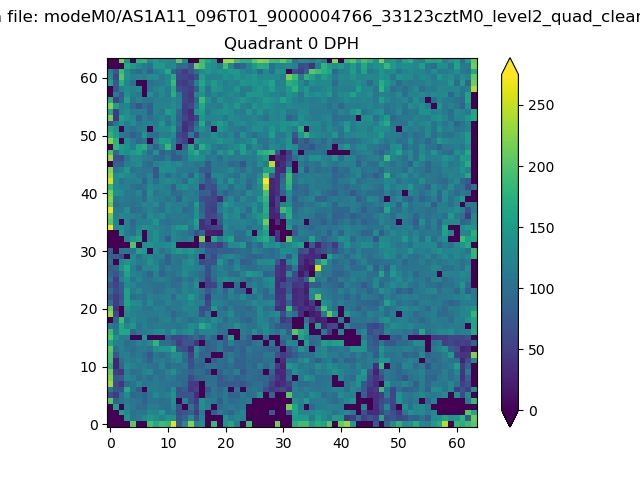 |
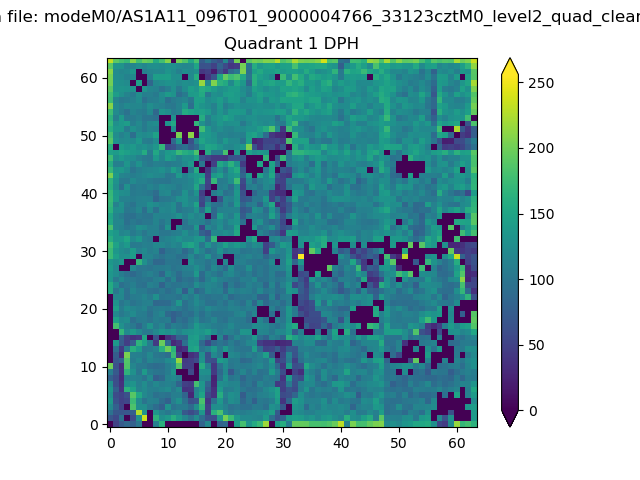 |
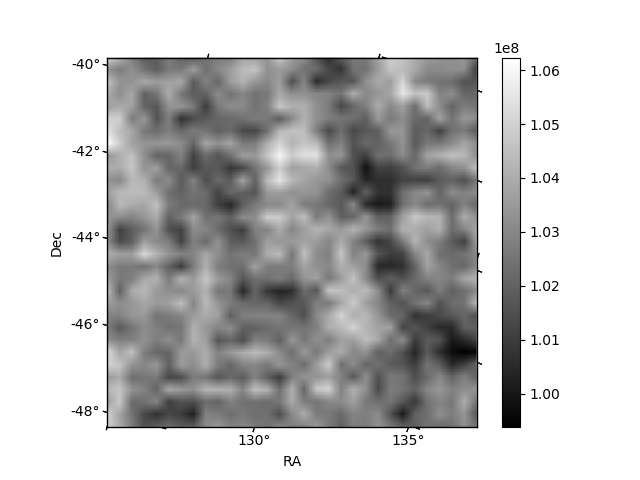
Quadrant B |
|---|---|---|---|
| Quadrant D | 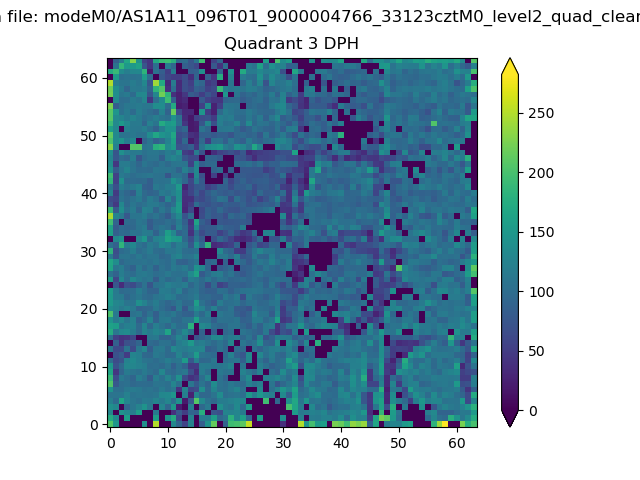 |
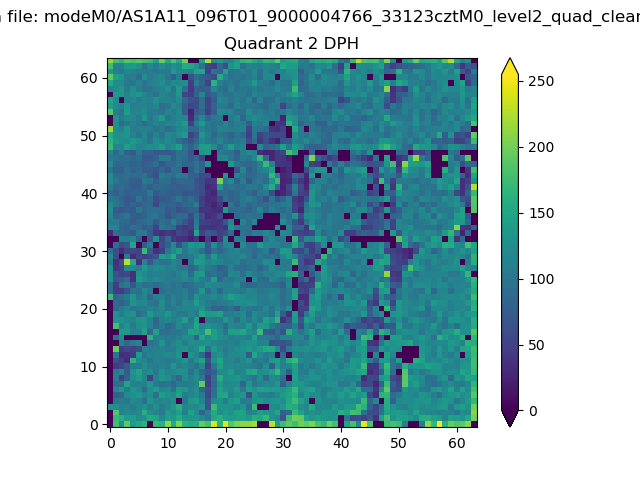 |
Quadrant C |
| Plot type | Count rate plots | Images |
|---|---|---|
| Comparison with Poisson distribution Blue bars denote a histogram of data divided into 1 sec bins. Red curve is a Poisson curve with rate = median count rate of data. |
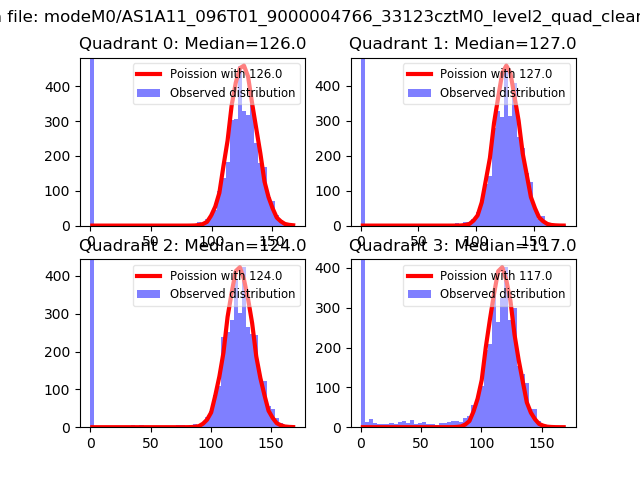 |
 |
| Quadrant-wise count rates Data is divided into 100 sec bins |
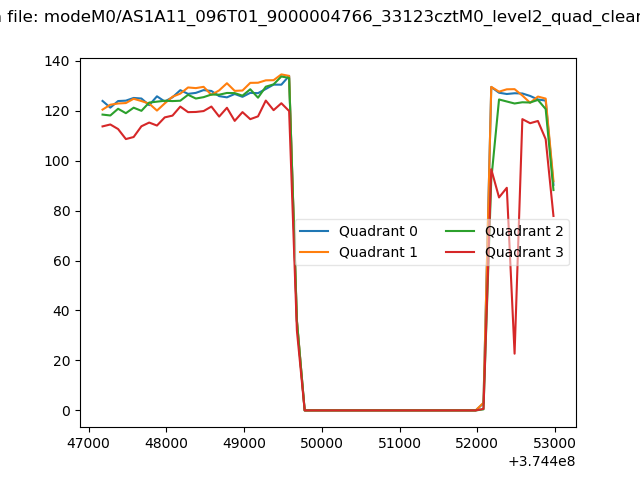 |
|
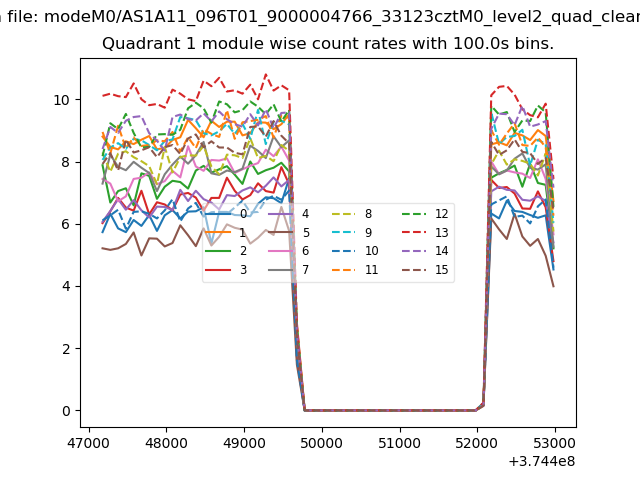
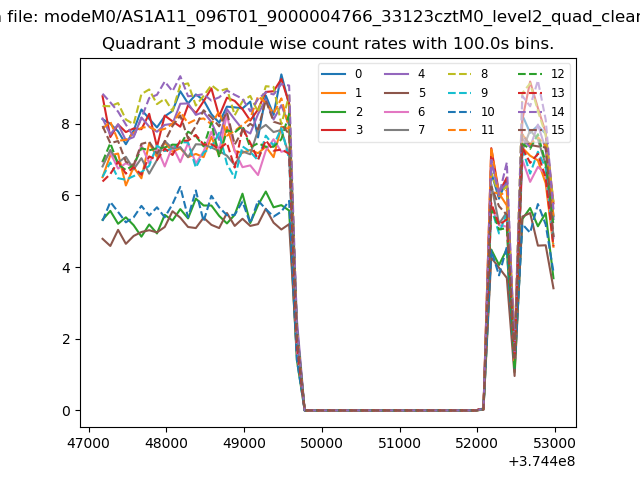
| Module-wise count rates for Quadrant A Data is divided into 100 sec bins |
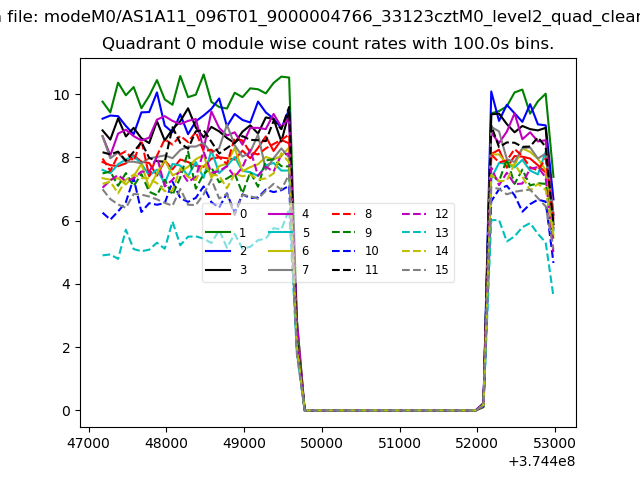 |
 |
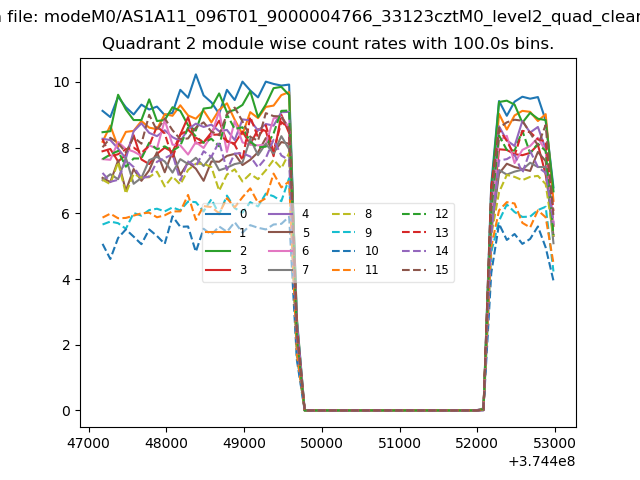
| Module-wise count rates for Quadrant B Data is divided into 100 sec bins |
 |
 |
| Module-wise count rates for Quadrant C Data is divided into 100 sec bins |
 |
 |
| Module-wise count rates for Quadrant D Data is divided into 100 sec bins |
 |
 |
| Parameter | Plot |
|---|---|
| CZT HV Monitor | 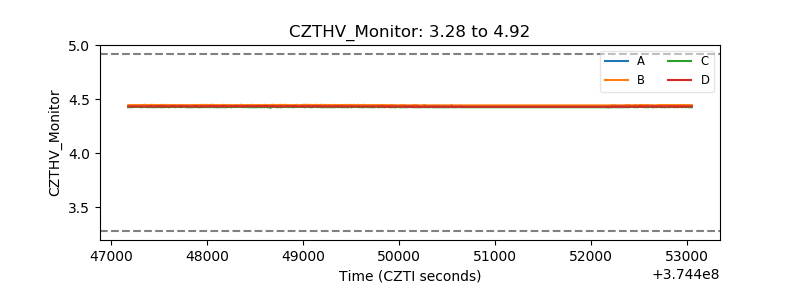 |
| D_VDD | 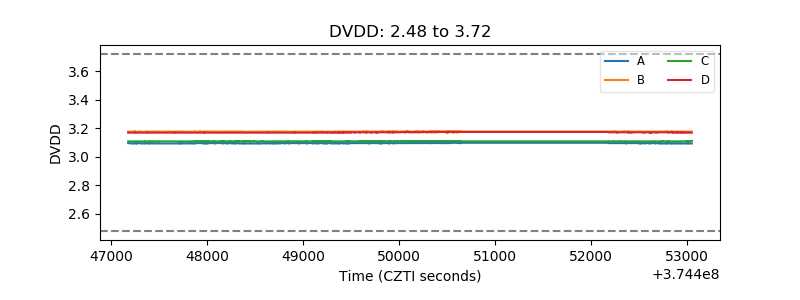 |
| Temperature 1 | 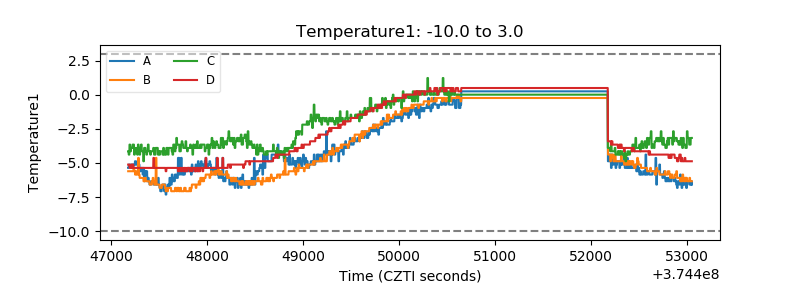 |
| Veto HV Monitor | 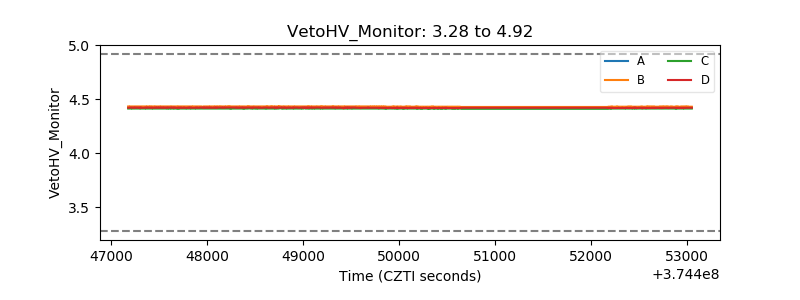 |
| Veto LLD | 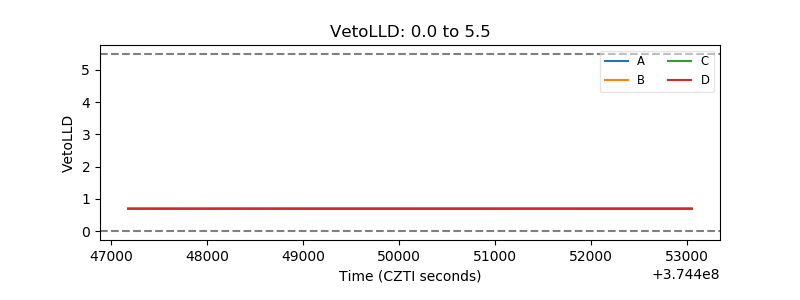 |
| Alpha Counter | 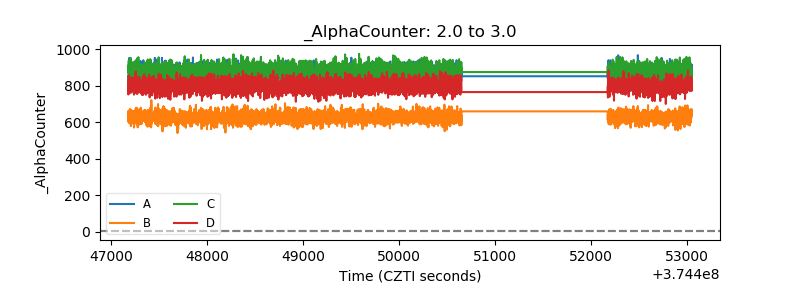 |
| _CPM_Rate | 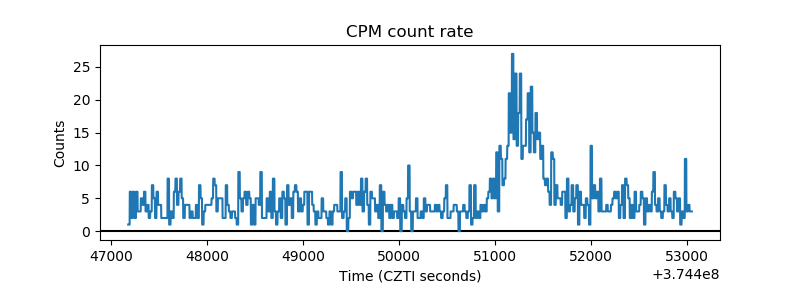 |
| CZT Counter | 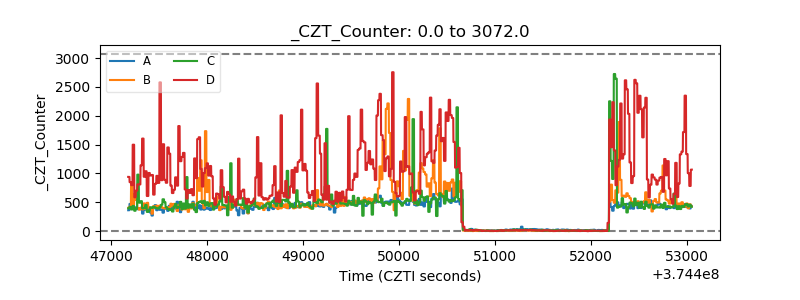 |
| +2.5 Volts monitor |  |
| +5 Volts monitor |  |
| _ROLL_ROT | 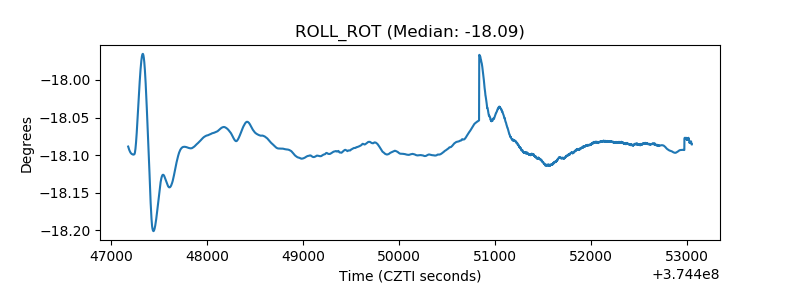 |
| _Roll_DEC | 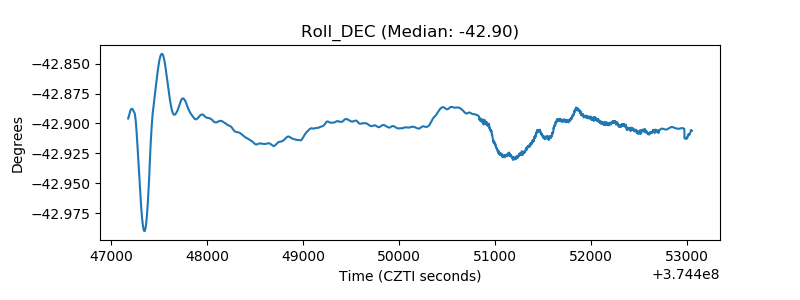 |
| _Roll_RA | 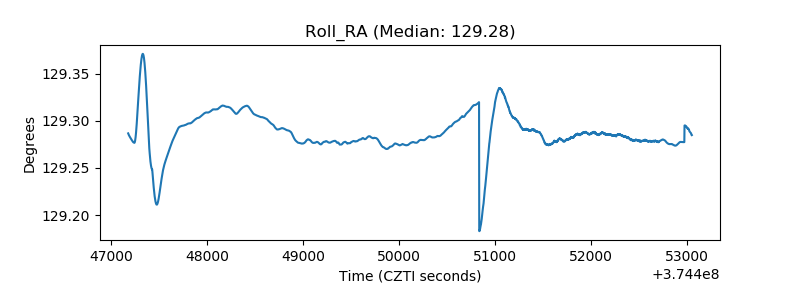 |
| Veto Counter | 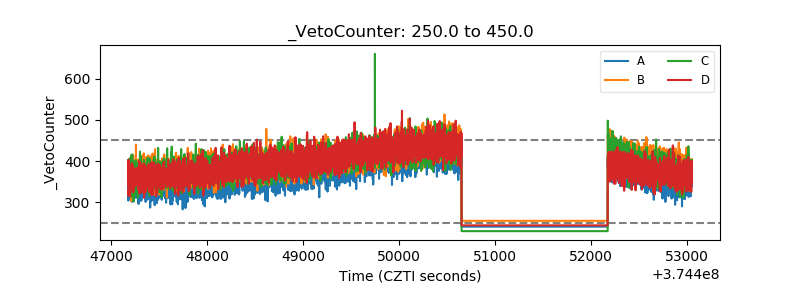 |