| Param | Original file | Final file |
|---|---|---|
| Filename | modeM0/AS1A11_096T01_9000004766_33124cztM0_level2.evt | modeM0/AS1A11_096T01_9000004766_33124cztM0_level2_quad_clean.evt |
| Size (bytes) | 550,316,160 | 81,624,960 |
| Size | 524.8 MB | 77.8 MB |
| Events in quadrant A | 2,649,972 | 534,852 |
| Events in quadrant B | 3,611,283 | 538,007 |
| Events in quadrant C | 3,000,012 | 523,132 |
| Events in quadrant D | 7,007,196 | 465,531 |
| Mode SS | |||
|---|---|---|---|
| Quadrant | BADHDUFLAG | Total packets | Discarded packets |
| A | 0 | 118 | 0 |
| B | 0 | 118 | 0 |
| C | 0 | 118 | 0 |
| D | 0 | 118 | 0 |
| Mode M0 | |||
|---|---|---|---|
| Quadrant | BADHDUFLAG | Total packets | Discarded packets |
| A | 0 | 11852 | 3 |
| B | 0 | 14629 | 2 |
| C | 0 | 12798 | 2 |
| D | 0 | 24947 | 2 |
| Mode M9 | |||
|---|---|---|---|
| Quadrant | BADHDUFLAG | Total packets | Discarded packets |
| A | 0 | 25 | 0 |
| B | 0 | 25 | 0 |
| C | 0 | 25 | 0 |
| D | 0 | 26 | 0 |
| Quadrant | Total seconds | Saturated seconds | Saturation percentage |
|---|---|---|---|
| A | 5871 | 6 | 0.102197% |
| B | 5871 | 144 | 2.452734% |
| C | 5871 | 82 | 1.396696% |
| D | 5871 | 1411 | 24.033384% |
Noise dominated data is calculated using 1-second bins in cleaned event files. If a bin has >2000 counts, and if more than 50% of those come from <1% of pixels, then it is considered to be noise-dominated and hence unusable.
| Quadrant | # 1 sec bins | Bins with >0 counts | Bins with >2000 counts | High rate bins dominated by noise | Noise dominated (total time) | Noise dominated (detector-on time) | Marked lightcurve |
|---|---|---|---|---|---|---|---|
| A | 7215 | 5872 | 0 | 0 | 0.00% | 0.00% | 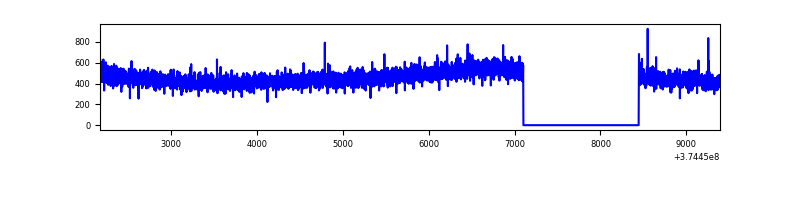 |
| B | 7215 | 5872 | 93 | 93 | 1.29% | 1.58% | 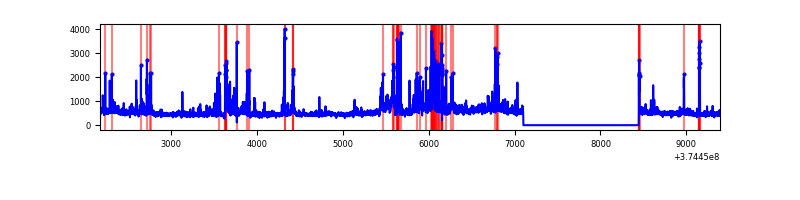 |
| C | 7215 | 5872 | 60 | 60 | 0.83% | 1.02% | 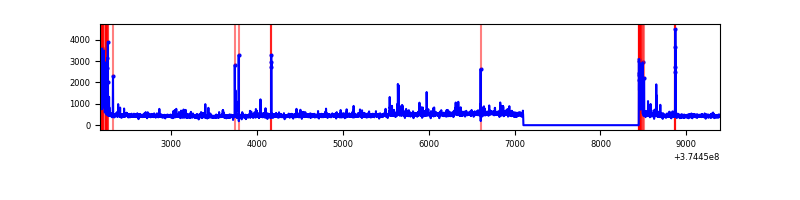 |
| D | 7215 | 5871 | 773 | 773 | 10.71% | 13.17% | 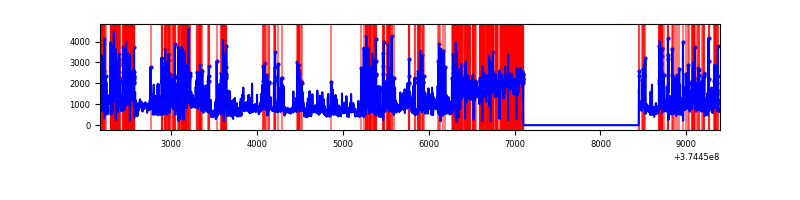 |
Top three noisy pixels from each quadrant. If the there are fewer than three noisy pixels in the level2.evt file, extra rows are filled as -1
| Pixel properties | Quadrant properties | ||||||
|---|---|---|---|---|---|---|---|
| Quadrant | DetID | PixID | Counts | Sigma | Mean | Median | Sigma |
| A | 13 | 6 | 16269 | 113.15 | 681 | 667 | 137.9 |
| A | 13 | 254 | 10464 | 71.05 | 681 | 667 | 137.9 |
| A | 3 | 137 | 6520 | 42.45 | 681 | 667 | 137.9 |
| B | 5 | 172 | 419397 | 3231.16 | 678 | 659 | 129.6 |
| B | 0 | 189 | 175527 | 1349.35 | 678 | 659 | 129.6 |
| B | 0 | 229 | 75241 | 575.5 | 678 | 659 | 129.6 |
| C | 0 | 10 | 232025 | 1513.63 | 660 | 664 | 152.9 |
| C | 7 | 221 | 120187 | 781.96 | 660 | 664 | 152.9 |
| C | 9 | 69 | 17344 | 109.13 | 660 | 664 | 152.9 |
| D | 12 | 218 | 1712879 | 12370.78 | 535 | 522 | 138.4 |
| D | 8 | 195 | 1044903 | 7545.04 | 535 | 522 | 138.4 |
| D | 2 | 250 | 640529 | 4623.68 | 535 | 522 | 138.4 |
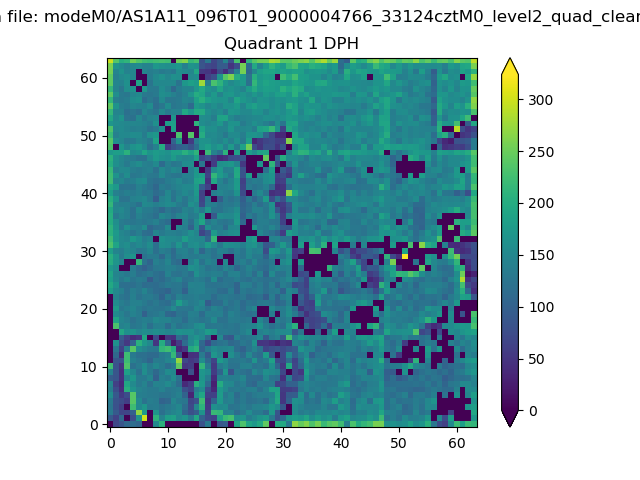
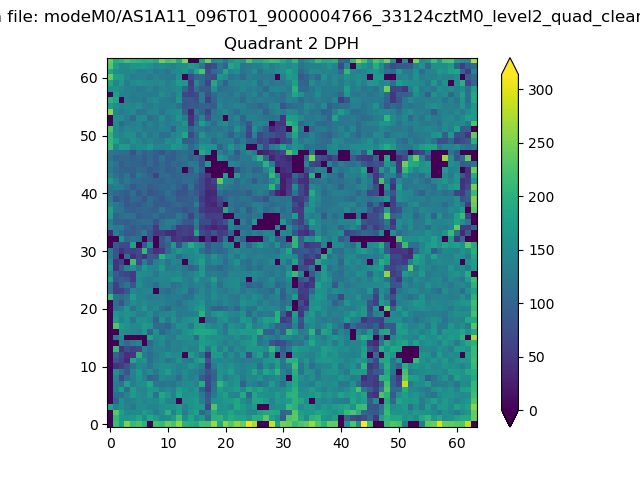
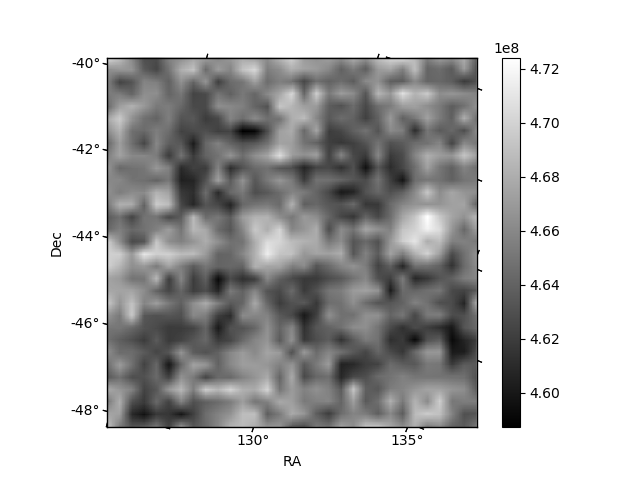
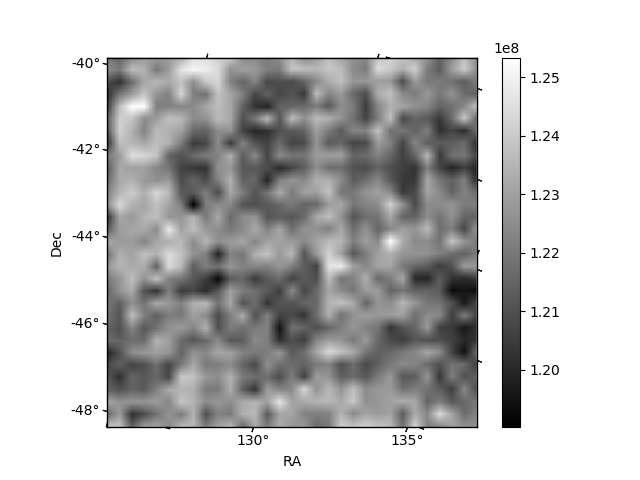
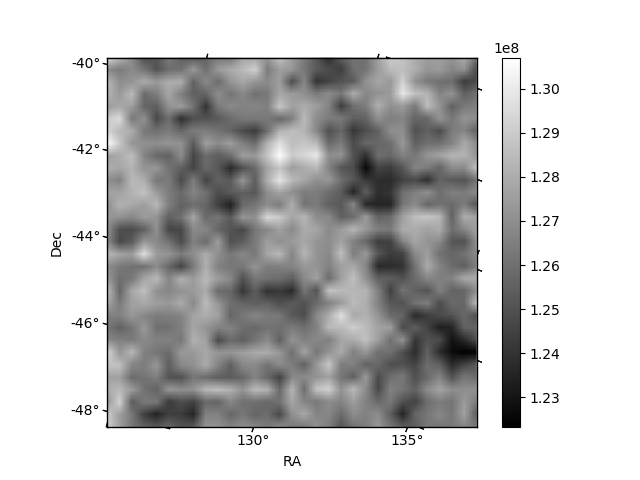
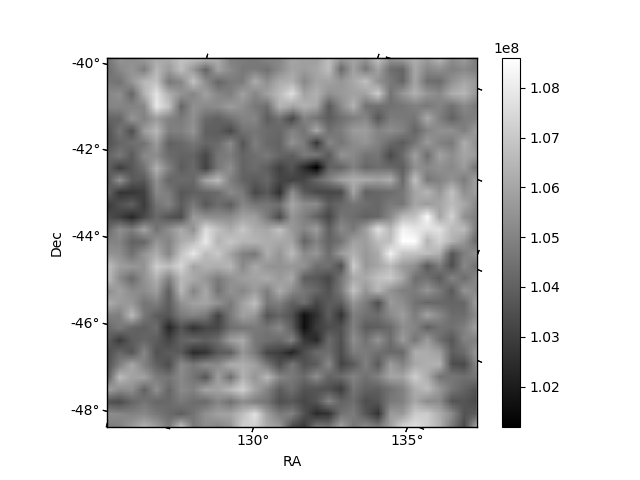
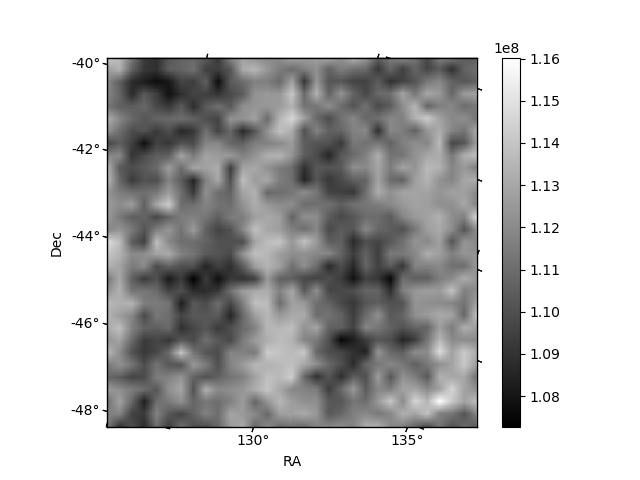
Histogram calculated using DETX and DETY for each event in the final _common_clean file
| Quadrant A |  |
 |
Quadrant B |
|---|---|---|---|
| Quadrant D | 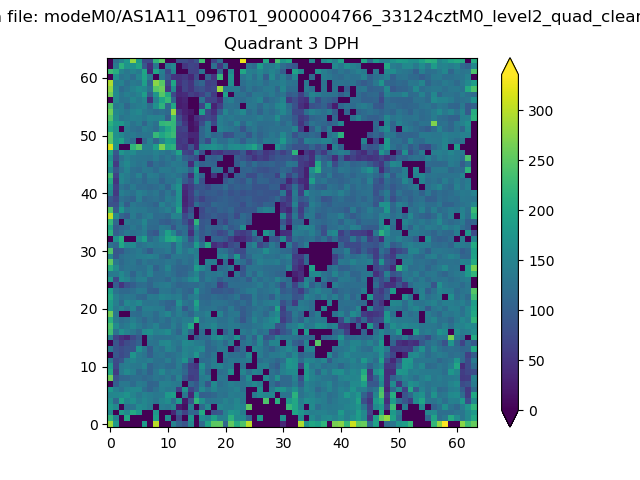 |
 |
Quadrant C |
| Plot type | Count rate plots | Images |
|---|---|---|
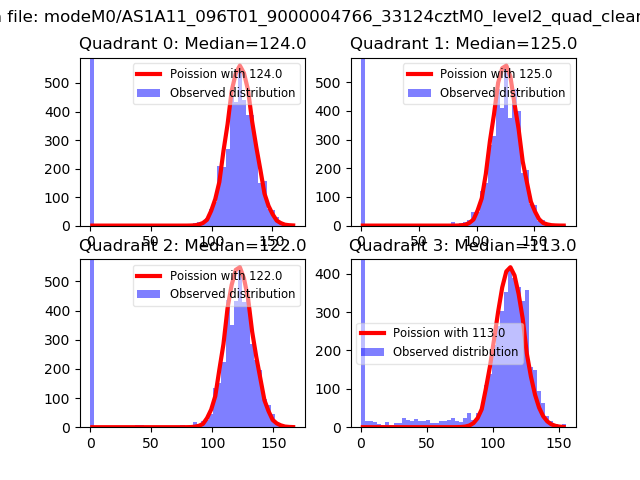
| Comparison with Poisson distribution Blue bars denote a histogram of data divided into 1 sec bins. Red curve is a Poisson curve with rate = median count rate of data. |
 |
 |
| Quadrant-wise count rates Data is divided into 100 sec bins |
 |
|
| Module-wise count rates for Quadrant A Data is divided into 100 sec bins |
 |
 |
| Module-wise count rates for Quadrant B Data is divided into 100 sec bins |
 |
 |
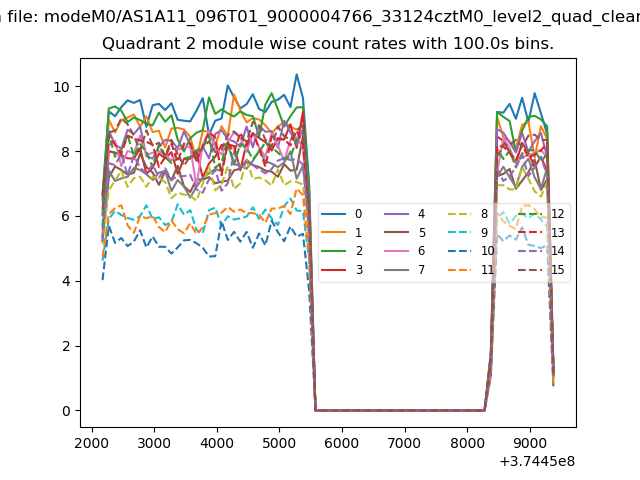
| Module-wise count rates for Quadrant C Data is divided into 100 sec bins |
 |
 |
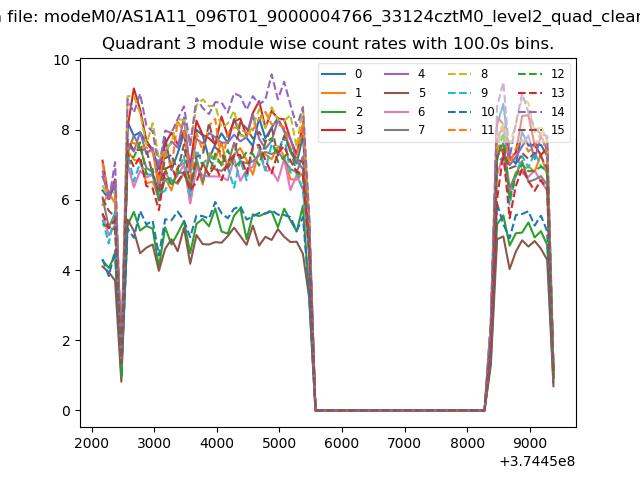
| Module-wise count rates for Quadrant D Data is divided into 100 sec bins |
 |
 |
| Parameter | Plot |
|---|---|
| CZT HV Monitor |  |
| D_VDD | 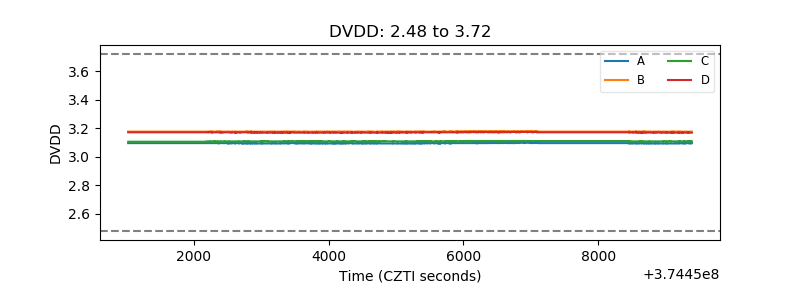 |
| Temperature 1 | 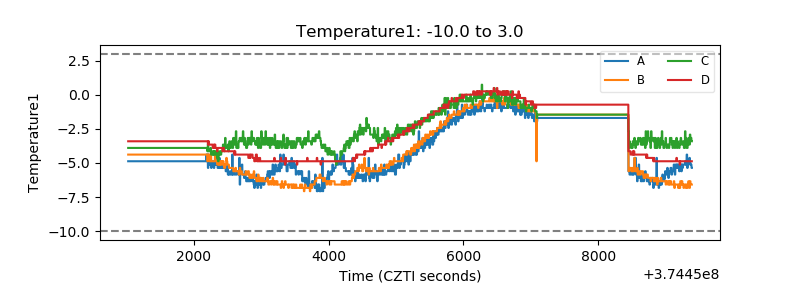 |
| Veto HV Monitor |  |
| Veto LLD |  |
| Alpha Counter | 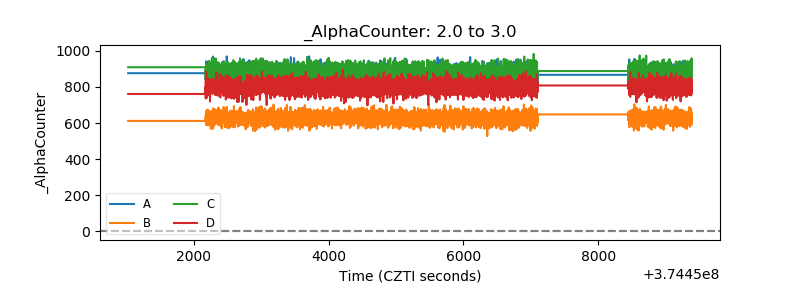 |
| _CPM_Rate | 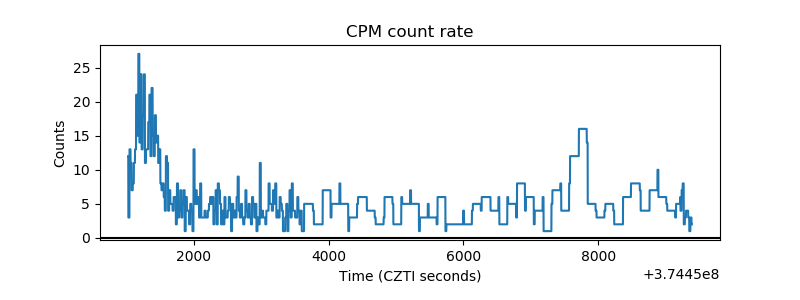 |
| CZT Counter | 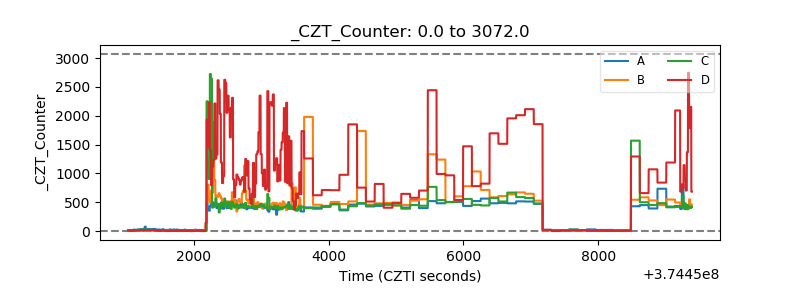 |
| +2.5 Volts monitor | 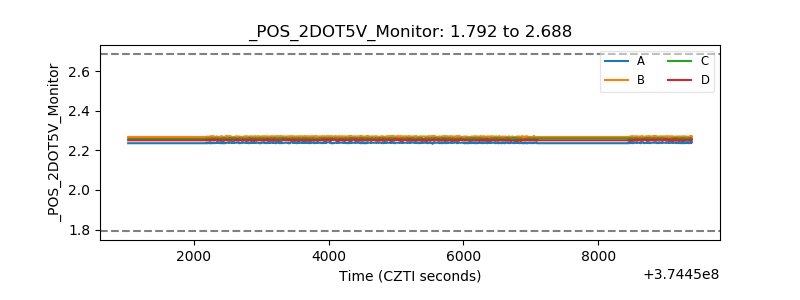 |
| +5 Volts monitor |  |
| _ROLL_ROT |  |
| _Roll_DEC | 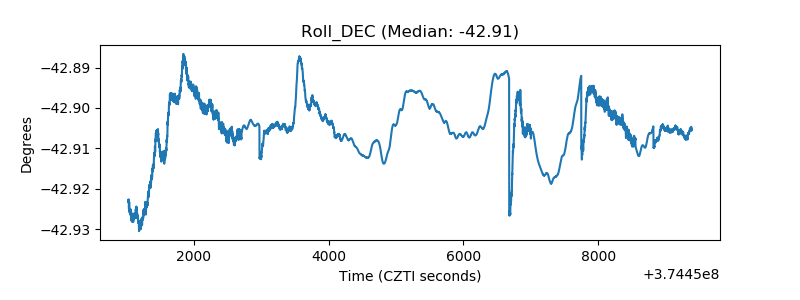 |
| _Roll_RA | 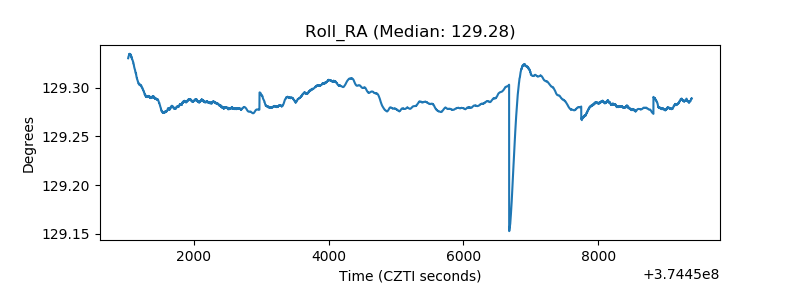 |
| Veto Counter |  |