| Param | Original file | Final file |
|---|---|---|
| Filename | modeM0/AS1A11_096T01_9000004766_33129cztM0_level2.evt | modeM0/AS1A11_096T01_9000004766_33129cztM0_level2_quad_clean.evt |
| Size (bytes) | 1,281,928,320 | 153,648,000 |
| Size | 1.2 GB | 146.5 MB |
| Events in quadrant A | 6,027,648 | 961,676 |
| Events in quadrant B | 9,381,627 | 968,460 |
| Events in quadrant C | 6,771,061 | 953,069 |
| Events in quadrant D | 15,747,590 | 852,180 |
| Mode SS | |||
|---|---|---|---|
| Quadrant | BADHDUFLAG | Total packets | Discarded packets |
| A | 0 | 272 | 0 |
| B | 0 | 272 | 0 |
| C | 0 | 272 | 0 |
| D | 0 | 272 | 0 |
| Mode M0 | |||
|---|---|---|---|
| Quadrant | BADHDUFLAG | Total packets | Discarded packets |
| A | 0 | 26869 | 4 |
| B | 0 | 36743 | 3 |
| C | 0 | 28849 | 3 |
| D | 0 | 56059 | 3 |
| Mode M9 | |||
|---|---|---|---|
| Quadrant | BADHDUFLAG | Total packets | Discarded packets |
| A | 0 | 37 | 0 |
| B | 0 | 37 | 0 |
| C | 0 | 37 | 0 |
| D | 0 | 38 | 0 |
| Quadrant | Total seconds | Saturated seconds | Saturation percentage |
|---|---|---|---|
| A | 13270 | 24 | 0.180859% |
| B | 13270 | 914 | 6.887717% |
| C | 13270 | 139 | 1.047476% |
| D | 13270 | 2920 | 22.004521% |
Noise dominated data is calculated using 1-second bins in cleaned event files. If a bin has >2000 counts, and if more than 50% of those come from <1% of pixels, then it is considered to be noise-dominated and hence unusable.
| Quadrant | # 1 sec bins | Bins with >0 counts | Bins with >2000 counts | High rate bins dominated by noise | Noise dominated (total time) | Noise dominated (detector-on time) | Marked lightcurve |
|---|---|---|---|---|---|---|---|
| A | 15894 | 13272 | 2 | 2 | 0.01% | 0.02% | 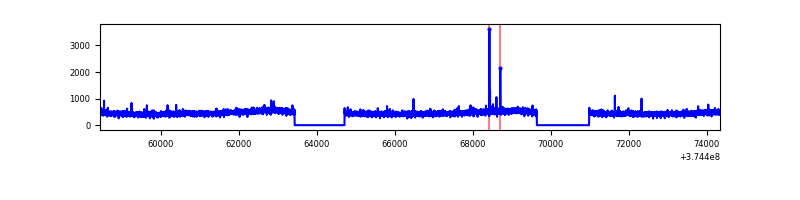 |
| B | 15894 | 13272 | 577 | 577 | 3.63% | 4.35% | 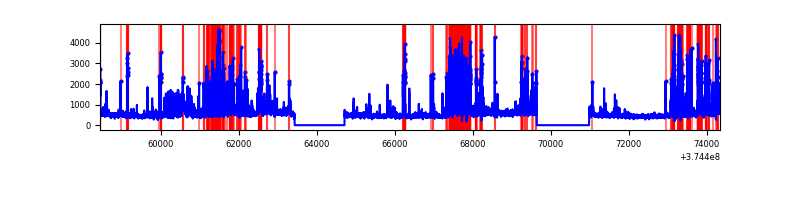 |
| C | 15894 | 13272 | 83 | 83 | 0.52% | 0.63% | 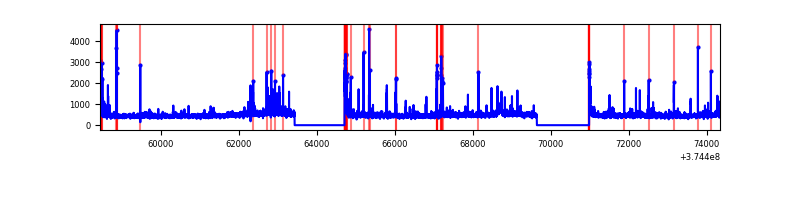 |
| D | 15894 | 13270 | 2156 | 2156 | 13.56% | 16.25% | 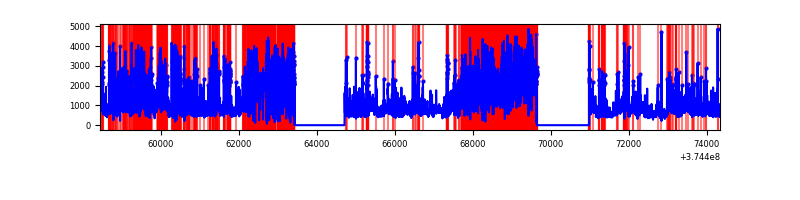 |
Top three noisy pixels from each quadrant. If the there are fewer than three noisy pixels in the level2.evt file, extra rows are filled as -1
| Pixel properties | Quadrant properties | ||||||
|---|---|---|---|---|---|---|---|
| Quadrant | DetID | PixID | Counts | Sigma | Mean | Median | Sigma |
| A | 13 | 6 | 30279 | 93.38 | 1543 | 1510 | 308.1 |
| A | 13 | 254 | 25045 | 76.39 | 1543 | 1510 | 308.1 |
| A | 14 | 235 | 15842 | 46.52 | 1543 | 1510 | 308.1 |
| B | 5 | 172 | 2050526 | 7145.71 | 1503 | 1465 | 286.8 |
| B | 5 | 200 | 898307 | 3127.57 | 1503 | 1465 | 286.8 |
| B | 0 | 219 | 136639 | 471.39 | 1503 | 1465 | 286.8 |
| C | 0 | 10 | 406472 | 1168.61 | 1504 | 1516 | 346.5 |
| C | 7 | 221 | 257711 | 739.32 | 1504 | 1516 | 346.5 |
| C | 9 | 187 | 105879 | 301.17 | 1504 | 1516 | 346.5 |
| D | 12 | 218 | 2563049 | 7310.33 | 1319 | 1292 | 350.4 |
| D | 2 | 249 | 2094763 | 5974.01 | 1319 | 1292 | 350.4 |
| D | 8 | 195 | 1906867 | 5437.83 | 1319 | 1292 | 350.4 |
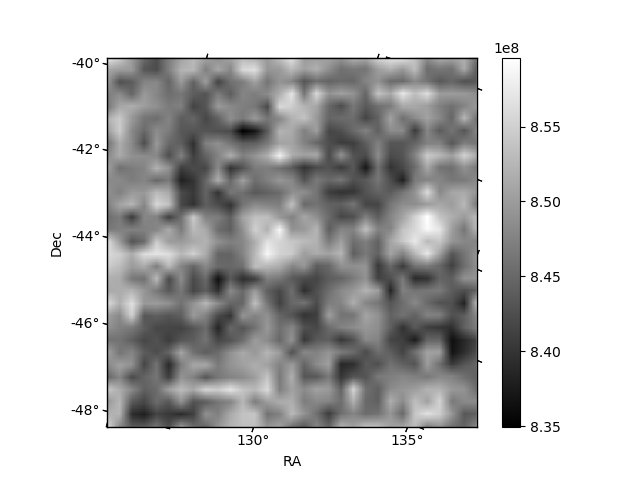
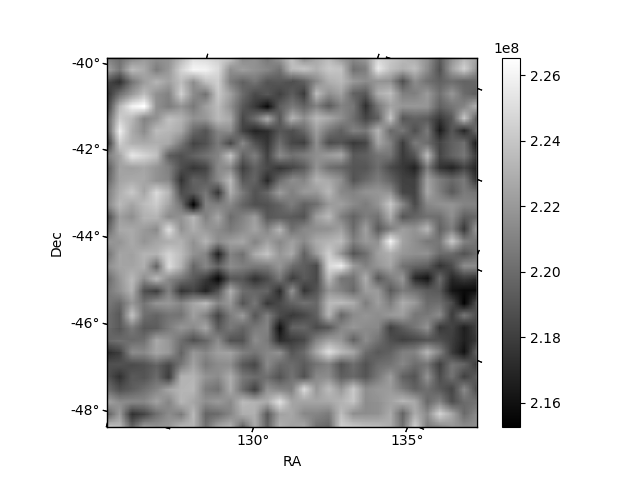
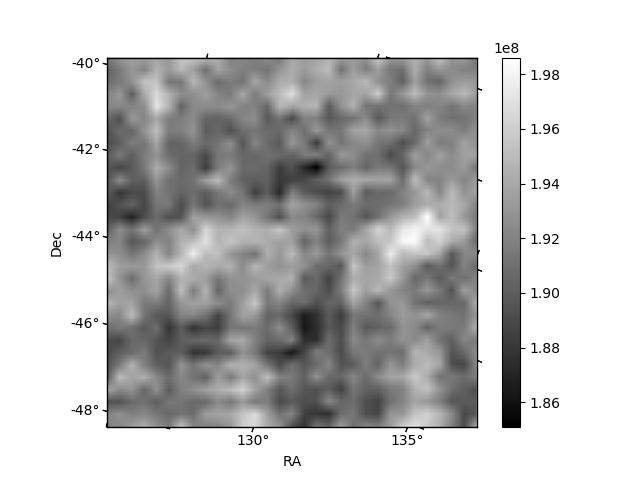
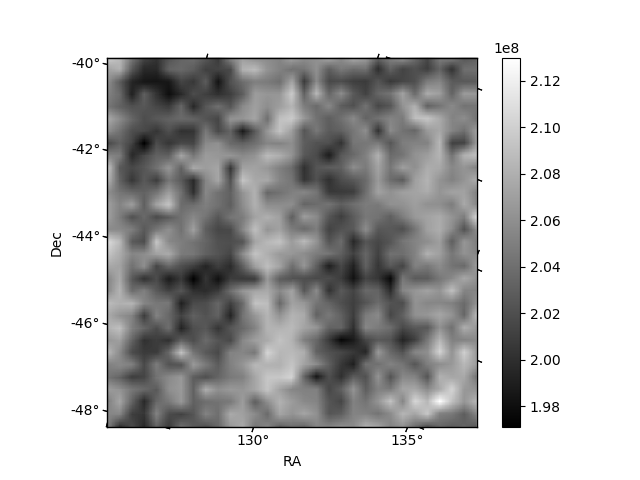
Histogram calculated using DETX and DETY for each event in the final _common_clean file
| Quadrant A | 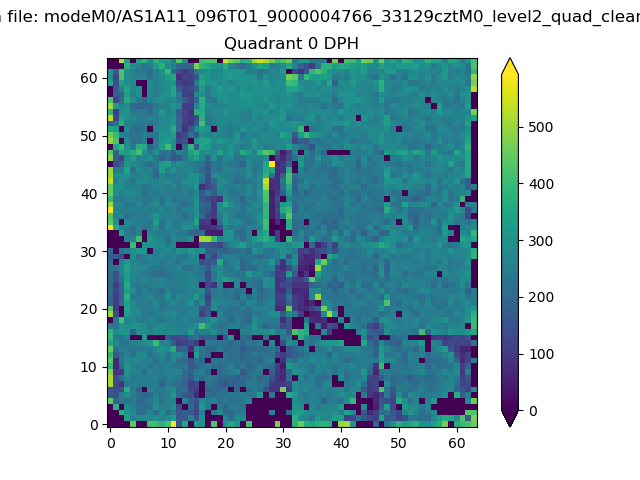 |
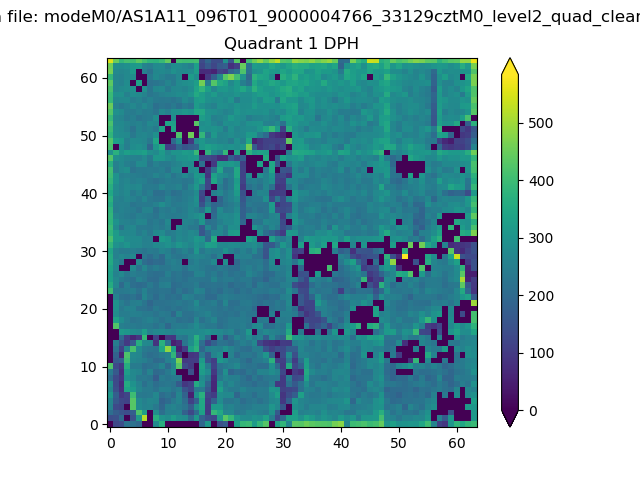 |
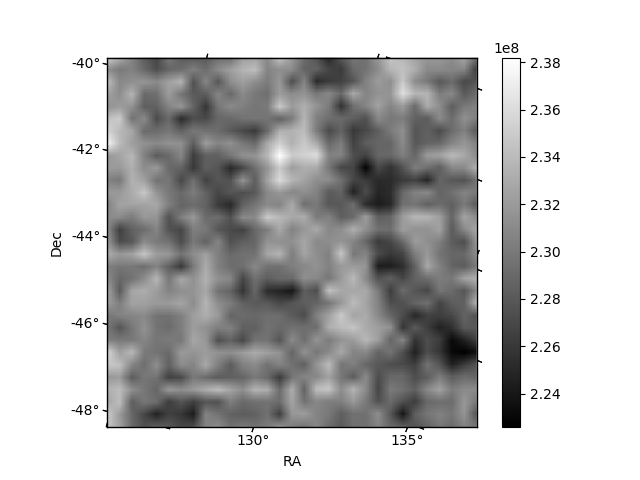
Quadrant B |
|---|---|---|---|
| Quadrant D | 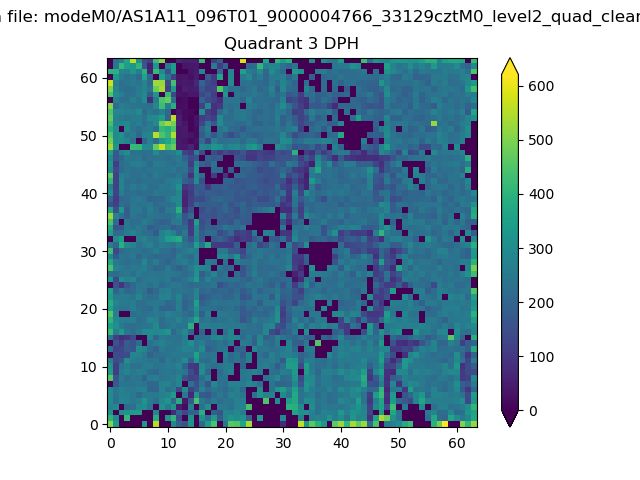 |
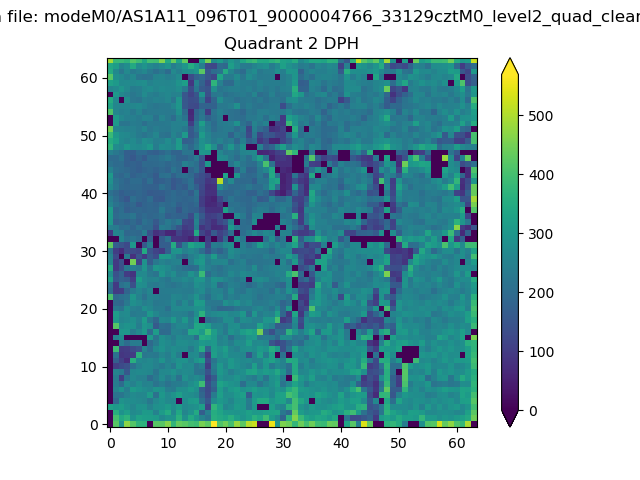 |
Quadrant C |
| Plot type | Count rate plots | Images |
|---|---|---|
| Comparison with Poisson distribution Blue bars denote a histogram of data divided into 1 sec bins. Red curve is a Poisson curve with rate = median count rate of data. |
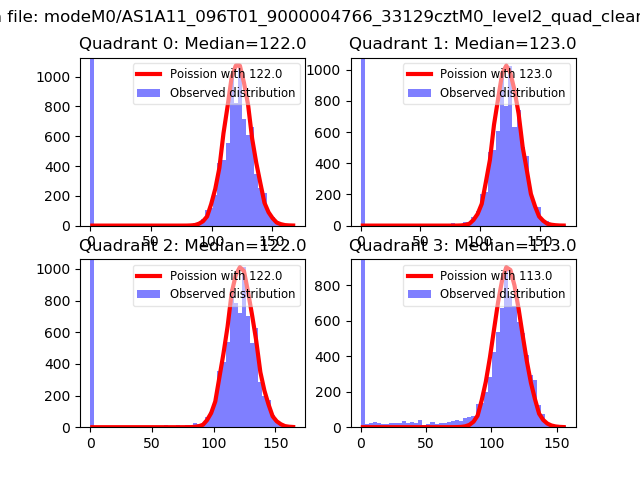 |
 |
| Quadrant-wise count rates Data is divided into 100 sec bins |
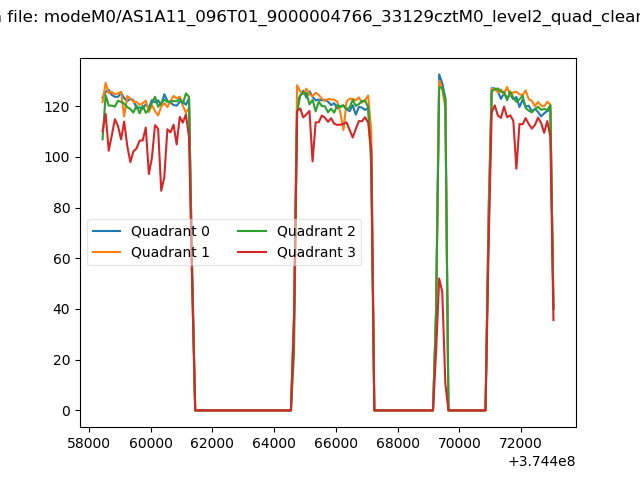 |
|
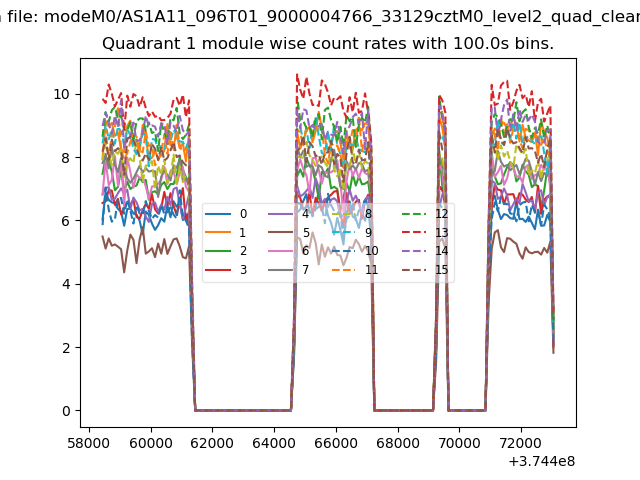
| Module-wise count rates for Quadrant A Data is divided into 100 sec bins |
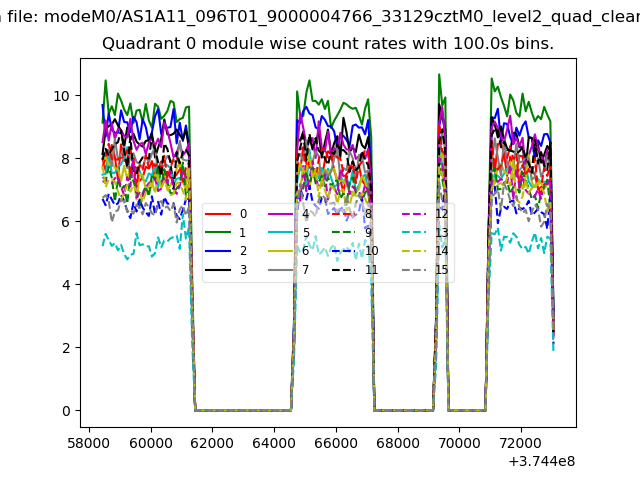 |
 |
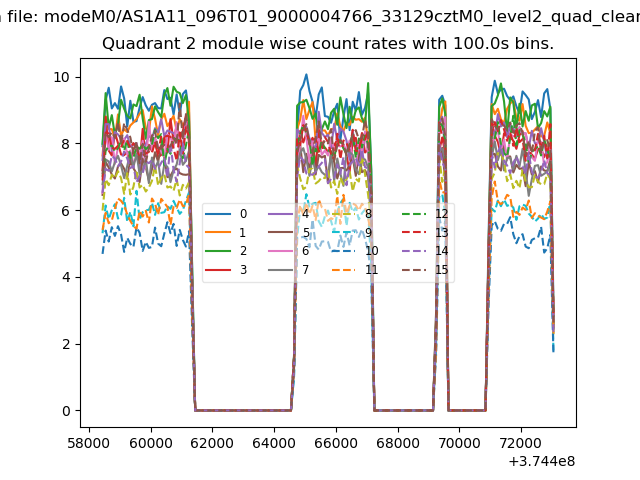
| Module-wise count rates for Quadrant B Data is divided into 100 sec bins |
 |
 |
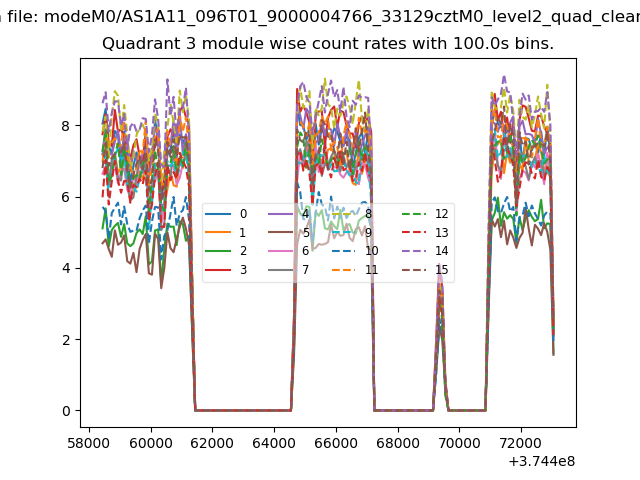
| Module-wise count rates for Quadrant C Data is divided into 100 sec bins |
 |
 |
| Module-wise count rates for Quadrant D Data is divided into 100 sec bins |
 |
 |
| Parameter | Plot |
|---|---|
| CZT HV Monitor | 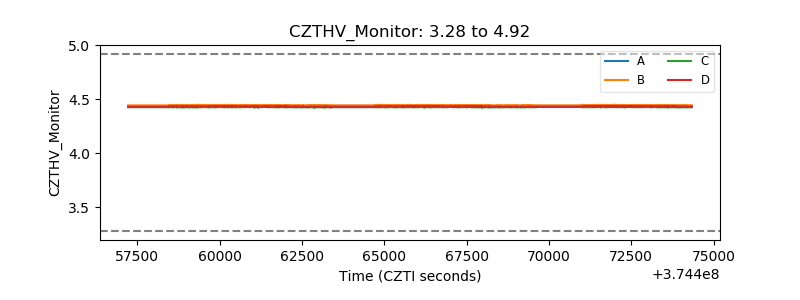 |
| D_VDD | 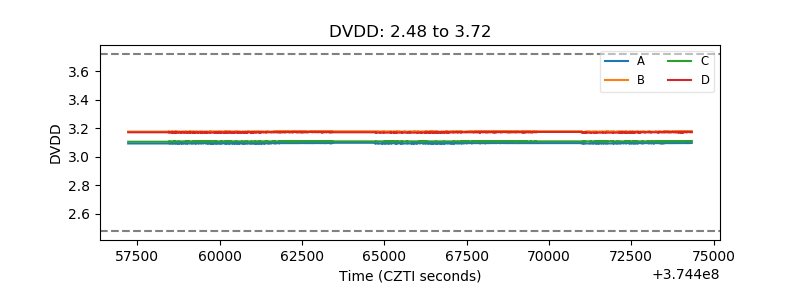 |
| Temperature 1 | 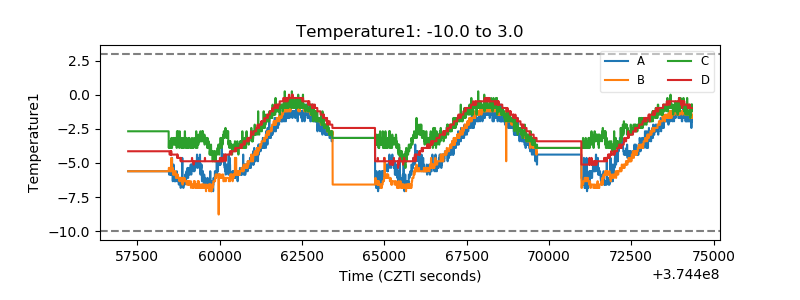 |
| Veto HV Monitor | 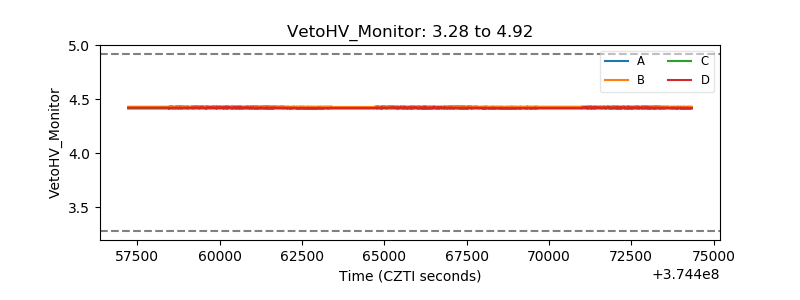 |
| Veto LLD | 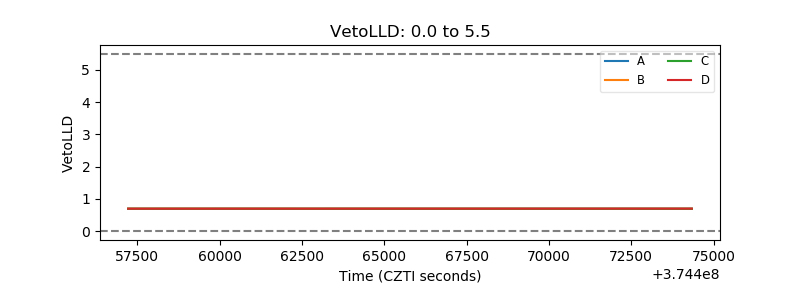 |
| Alpha Counter | 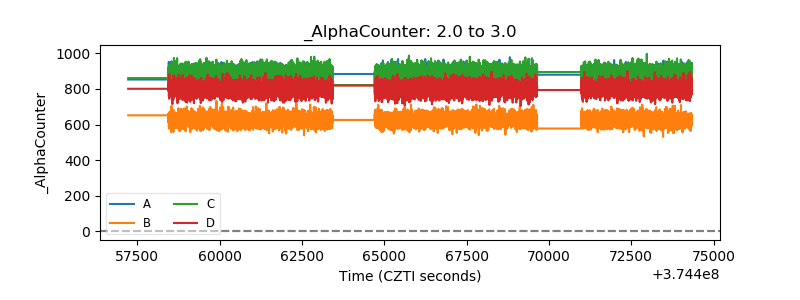 |
| _CPM_Rate | 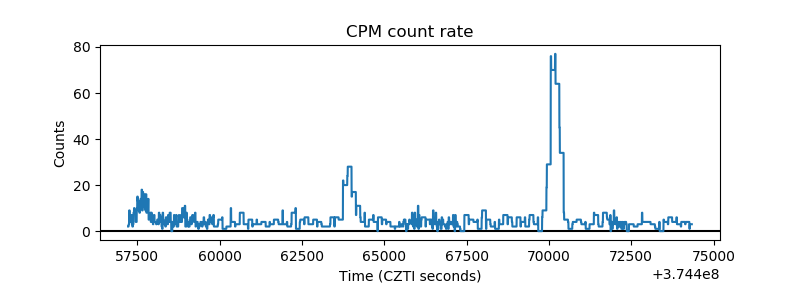 |
| CZT Counter | 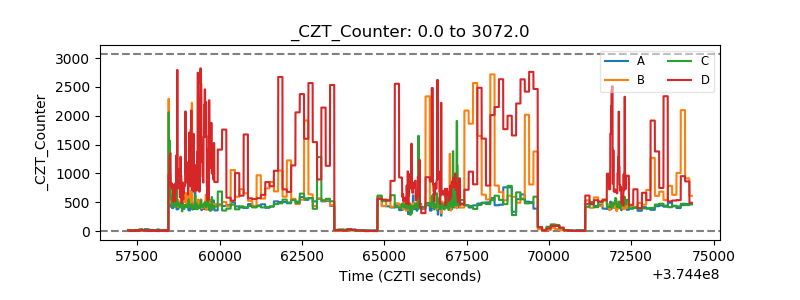 |
| +2.5 Volts monitor | 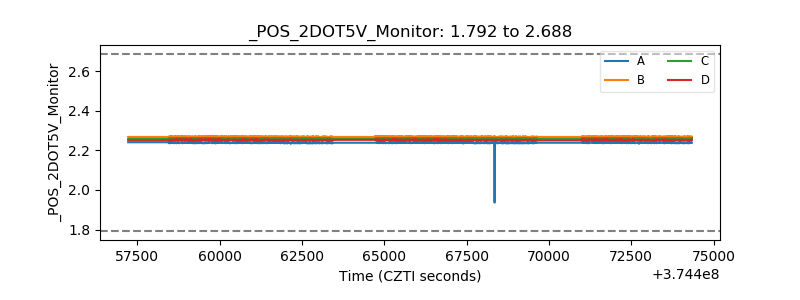 |
| +5 Volts monitor | 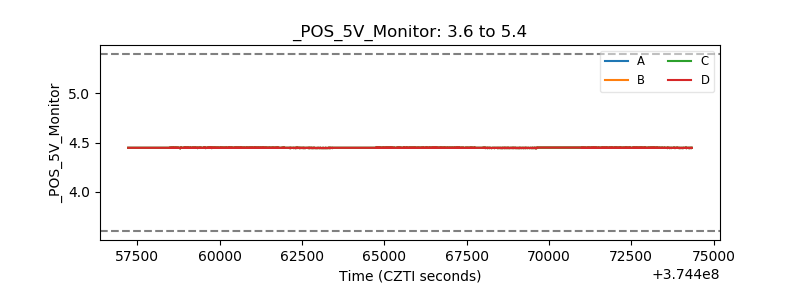 |
| _ROLL_ROT | 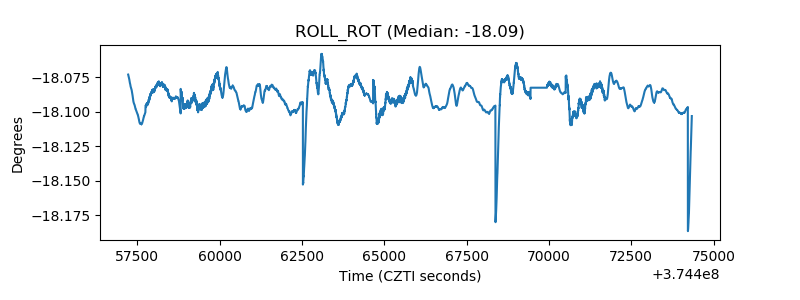 |
| _Roll_DEC | 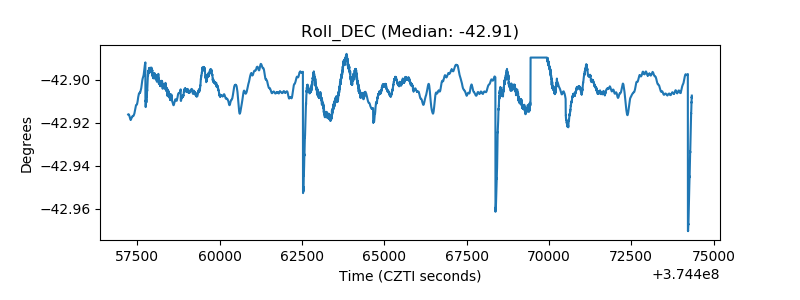 |
| _Roll_RA | 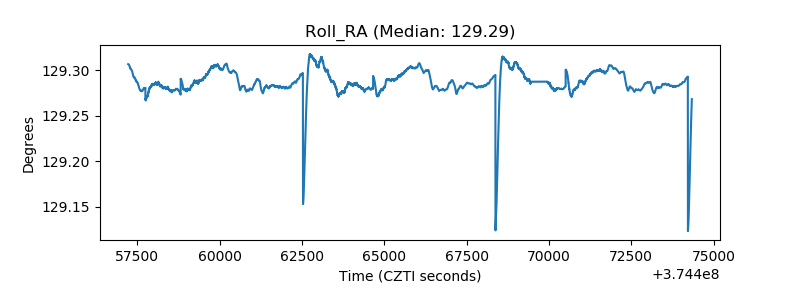 |
| Veto Counter | 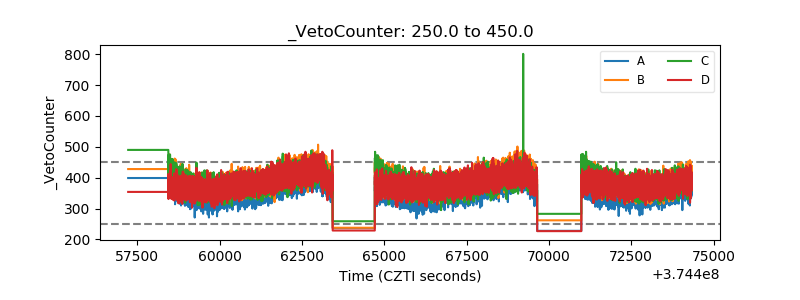 |