| Param | Original file | Final file |
|---|---|---|
| Filename | modeM0/AS1A11_096T01_9000004766_33131cztM0_level2.evt | modeM0/AS1A11_096T01_9000004766_33131cztM0_level2_quad_clean.evt |
| Size (bytes) | 1,642,008,960 | 186,053,760 |
| Size | 1.5 GB | 177.4 MB |
| Events in quadrant A | 8,092,916 | 1,148,680 |
| Events in quadrant B | 12,194,105 | 1,151,539 |
| Events in quadrant C | 9,630,082 | 1,127,691 |
| Events in quadrant D | 18,662,851 | 1,030,280 |
| Mode SS | |||
|---|---|---|---|
| Quadrant | BADHDUFLAG | Total packets | Discarded packets |
| A | 0 | 346 | 0 |
| B | 0 | 346 | 0 |
| C | 0 | 346 | 0 |
| D | 0 | 346 | 0 |
| Mode M0 | |||
|---|---|---|---|
| Quadrant | BADHDUFLAG | Total packets | Discarded packets |
| A | 0 | 34547 | 4 |
| B | 0 | 46828 | 3 |
| C | 0 | 39200 | 3 |
| D | 0 | 67368 | 3 |
| Mode M9 | |||
|---|---|---|---|
| Quadrant | BADHDUFLAG | Total packets | Discarded packets |
| A | 0 | 66 | 0 |
| B | 0 | 66 | 0 |
| C | 0 | 66 | 0 |
| D | 0 | 66 | 0 |
| Quadrant | Total seconds | Saturated seconds | Saturation percentage |
|---|---|---|---|
| A | 17069 | 17 | 0.099596% |
| B | 17069 | 1178 | 6.901400% |
| C | 17069 | 256 | 1.499795% |
| D | 17069 | 2609 | 15.285020% |
Noise dominated data is calculated using 1-second bins in cleaned event files. If a bin has >2000 counts, and if more than 50% of those come from <1% of pixels, then it is considered to be noise-dominated and hence unusable.
| Quadrant | # 1 sec bins | Bins with >0 counts | Bins with >2000 counts | High rate bins dominated by noise | Noise dominated (total time) | Noise dominated (detector-on time) | Marked lightcurve |
|---|---|---|---|---|---|---|---|
| A | 23552 | 17073 | 0 | 0 | 0.00% | 0.00% | 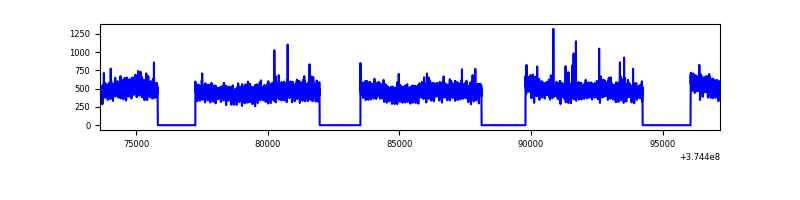 |
| B | 23552 | 17073 | 766 | 766 | 3.25% | 4.49% | 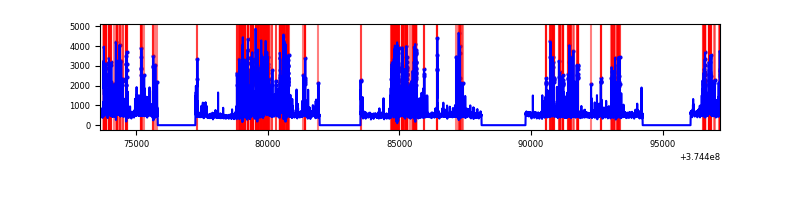 |
| C | 23552 | 17073 | 175 | 175 | 0.74% | 1.03% | 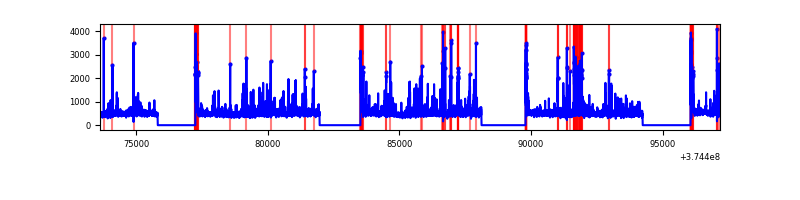 |
| D | 23552 | 17073 | 2076 | 2076 | 8.81% | 12.16% | 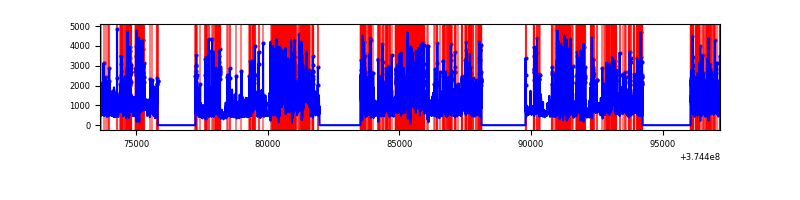 |
Top three noisy pixels from each quadrant. If the there are fewer than three noisy pixels in the level2.evt file, extra rows are filled as -1
| Pixel properties | Quadrant properties | ||||||
|---|---|---|---|---|---|---|---|
| Quadrant | DetID | PixID | Counts | Sigma | Mean | Median | Sigma |
| A | 13 | 6 | 36453 | 83.22 | 2081 | 2039 | 413.6 |
| A | 13 | 254 | 29710 | 66.91 | 2081 | 2039 | 413.6 |
| A | 3 | 137 | 18765 | 40.44 | 2081 | 2039 | 413.6 |
| B | 5 | 172 | 3180358 | 8431.95 | 2015 | 1963 | 376.9 |
| B | 0 | 221 | 466888 | 1233.4 | 2015 | 1963 | 376.9 |
| B | 0 | 219 | 160723 | 421.17 | 2015 | 1963 | 376.9 |
| C | 7 | 221 | 1059783 | 2310.24 | 2002 | 2023 | 457.9 |
| C | 0 | 10 | 448736 | 975.66 | 2002 | 2023 | 457.9 |
| C | 1 | 241 | 77845 | 165.6 | 2002 | 2023 | 457.9 |
| D | 8 | 195 | 2853731 | 6111.62 | 1876 | 1830 | 466.6 |
| D | 2 | 249 | 1822964 | 3902.69 | 1876 | 1830 | 466.6 |
| D | 12 | 218 | 1733764 | 3711.53 | 1876 | 1830 | 466.6 |
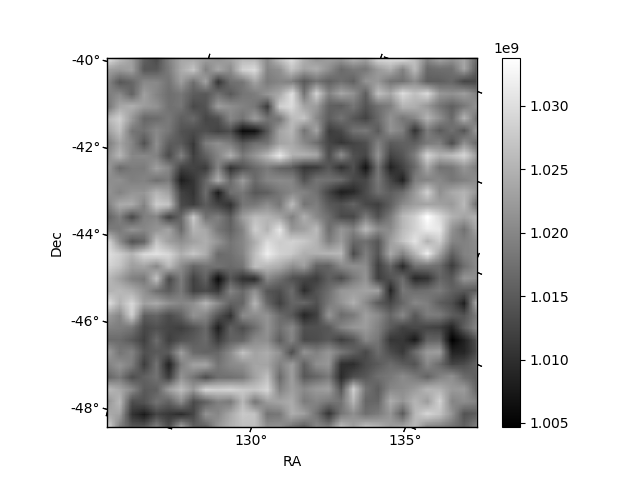
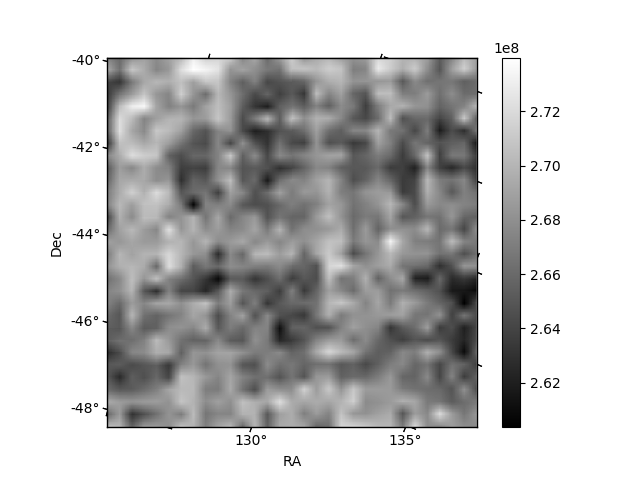
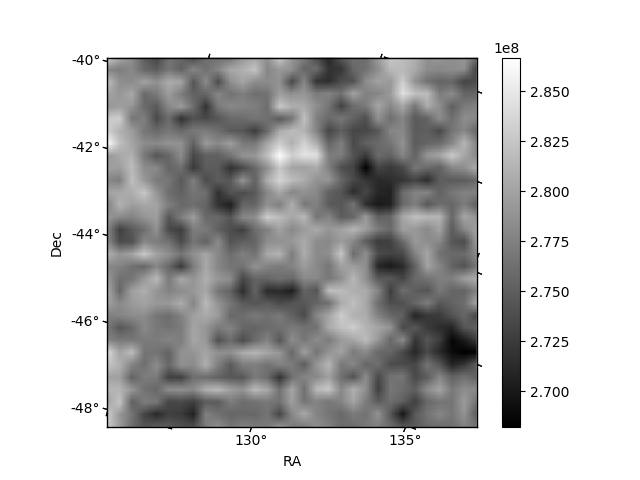
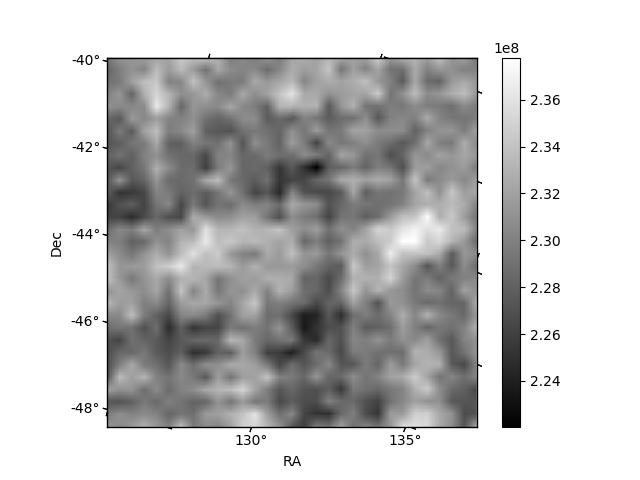
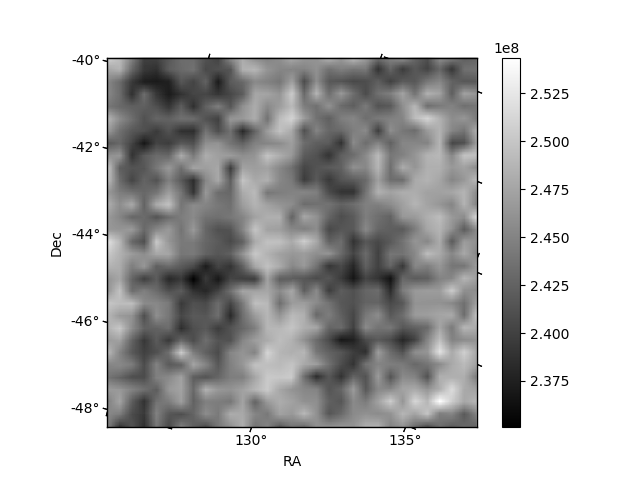
Histogram calculated using DETX and DETY for each event in the final _common_clean file
| Quadrant A | 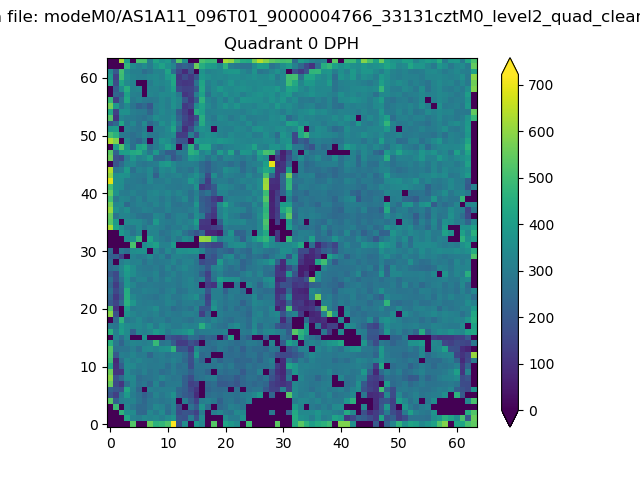 |
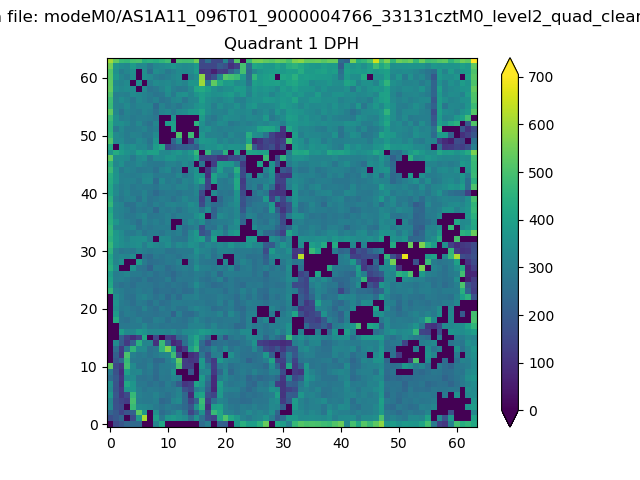 |
Quadrant B |
|---|---|---|---|
| Quadrant D | 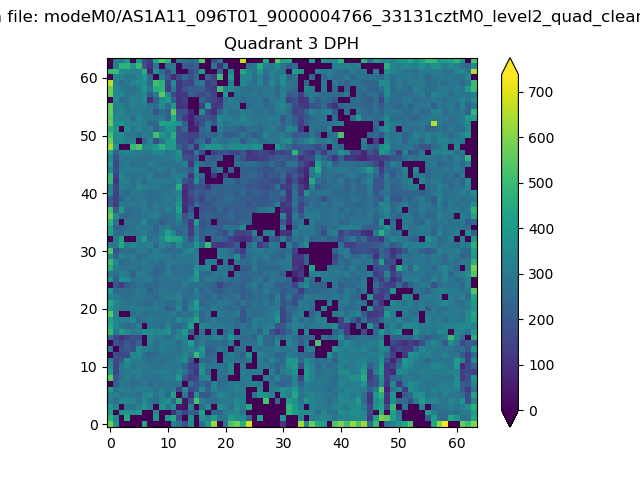 |
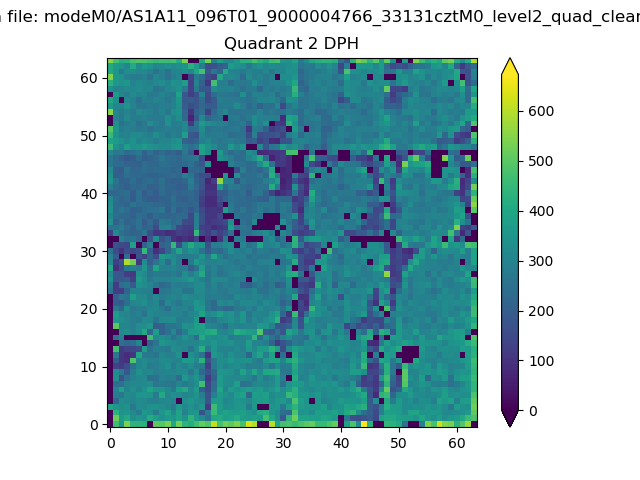 |
Quadrant C |
| Plot type | Count rate plots | Images |
|---|---|---|
| Comparison with Poisson distribution Blue bars denote a histogram of data divided into 1 sec bins. Red curve is a Poisson curve with rate = median count rate of data. |
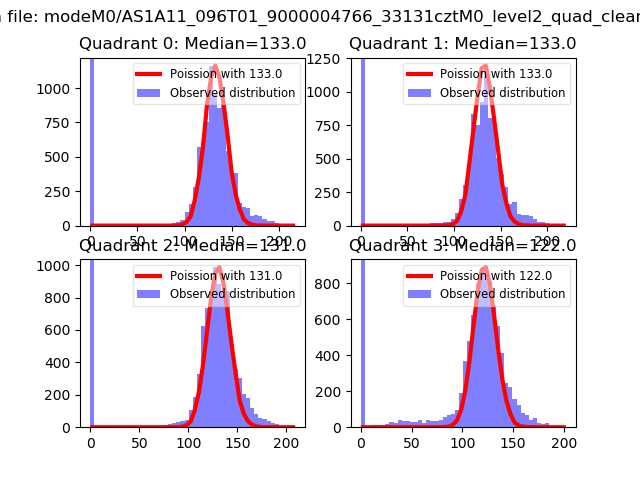 |
 |
| Quadrant-wise count rates Data is divided into 100 sec bins |
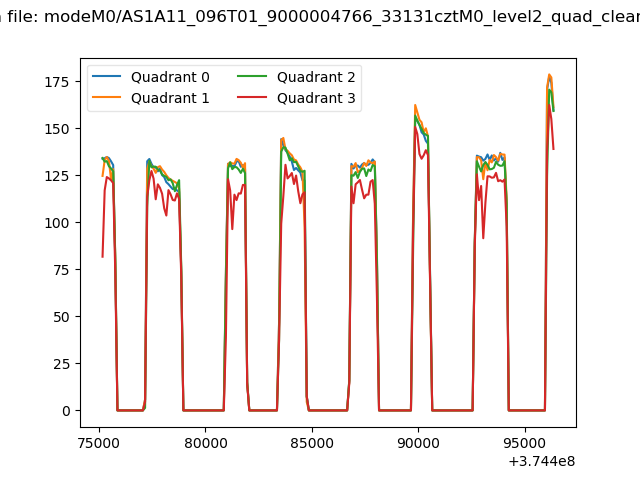 |
|
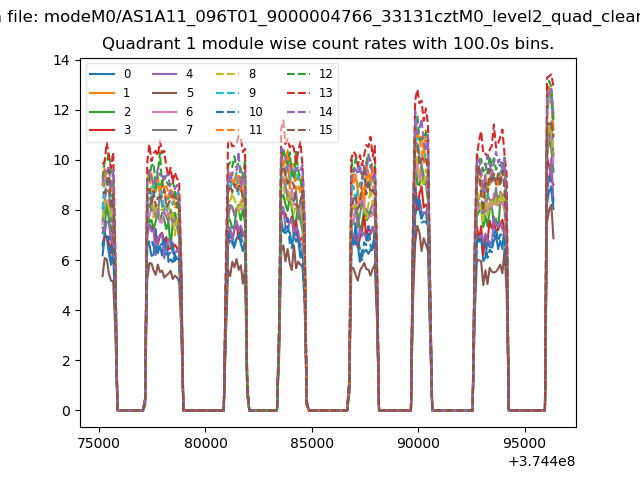
| Module-wise count rates for Quadrant A Data is divided into 100 sec bins |
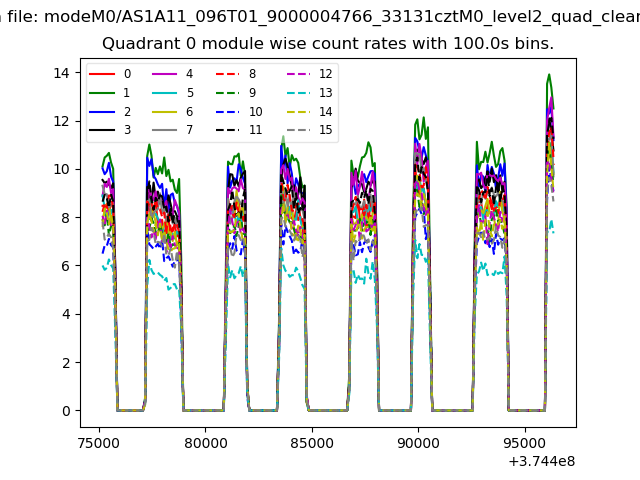 |
 |
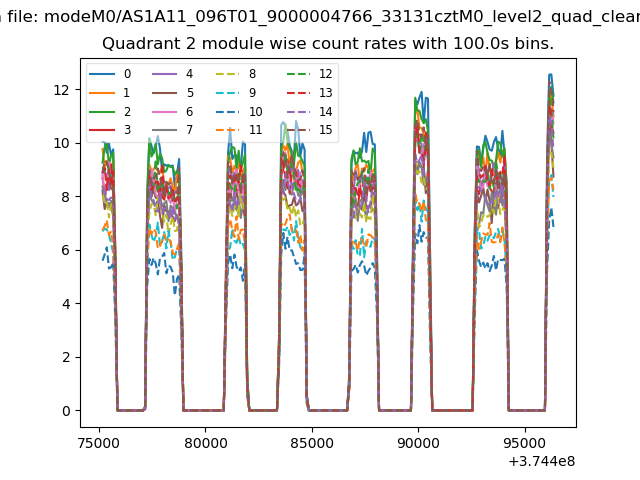
| Module-wise count rates for Quadrant B Data is divided into 100 sec bins |
 |
 |
| Module-wise count rates for Quadrant C Data is divided into 100 sec bins |
 |
 |
| Module-wise count rates for Quadrant D Data is divided into 100 sec bins |
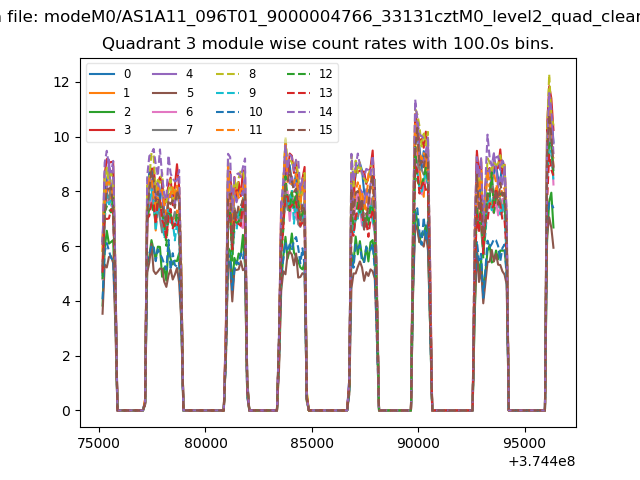 |
 |
| Parameter | Plot |
|---|---|
| CZT HV Monitor | 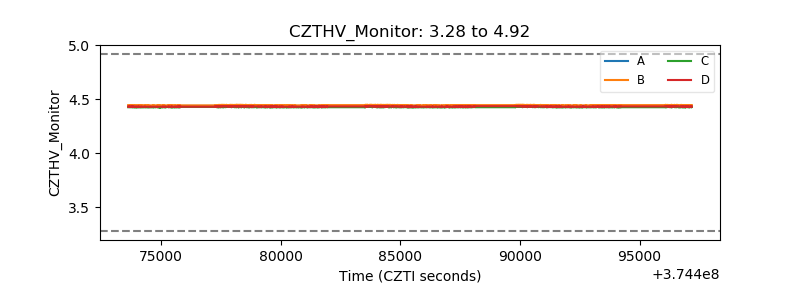 |
| D_VDD | 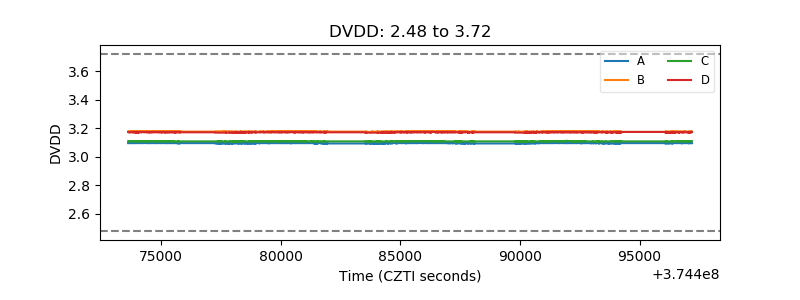 |
| Temperature 1 | 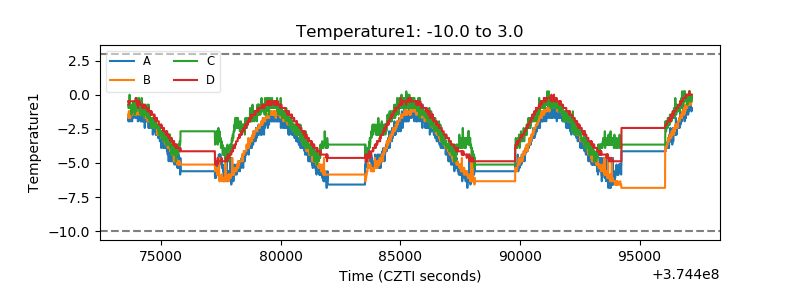 |
| Veto HV Monitor | 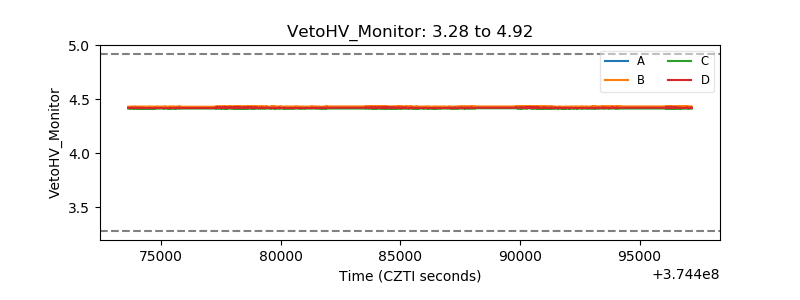 |
| Veto LLD | 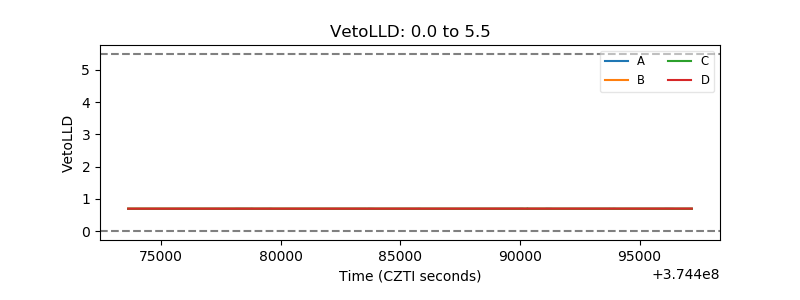 |
| Alpha Counter | 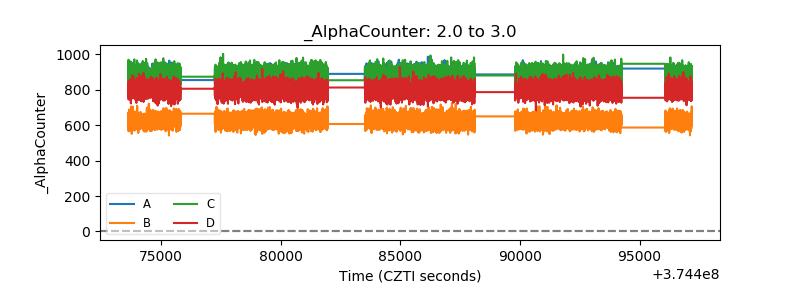 |
| _CPM_Rate | 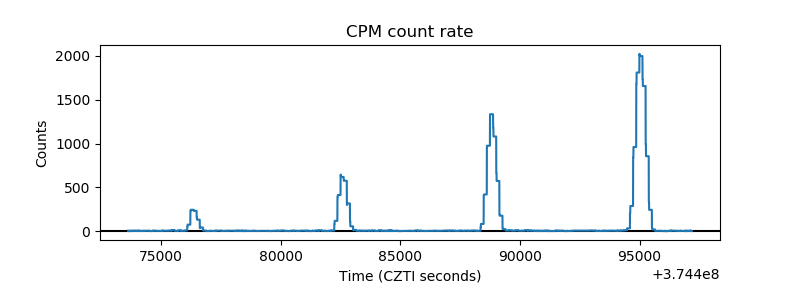 |
| CZT Counter | 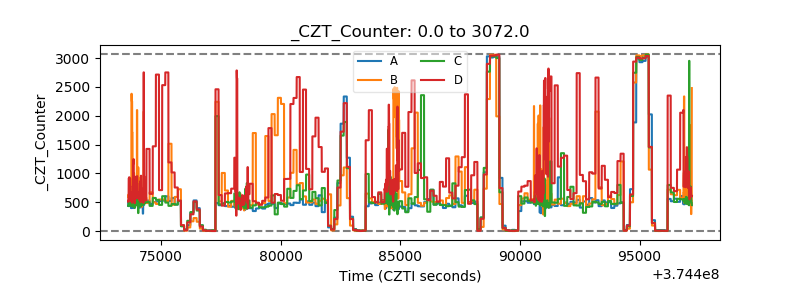 |
| +2.5 Volts monitor | 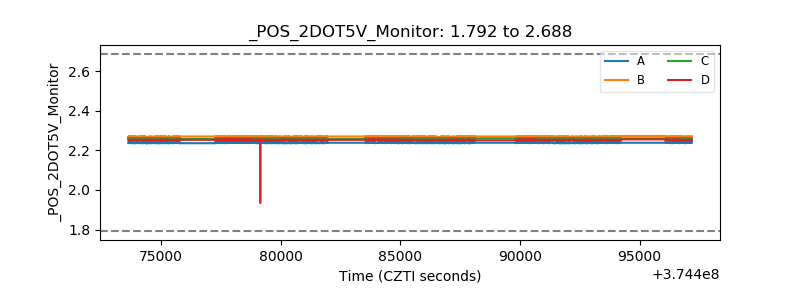 |
| +5 Volts monitor | 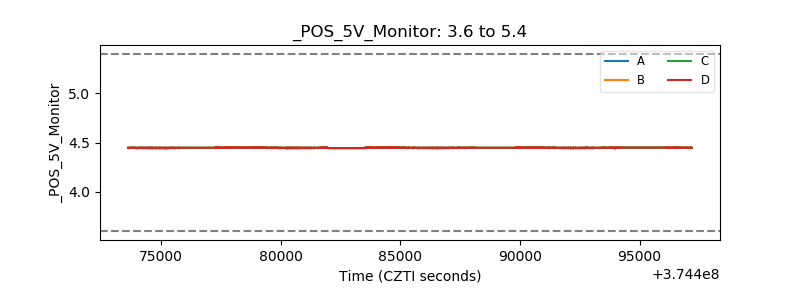 |
| _ROLL_ROT | 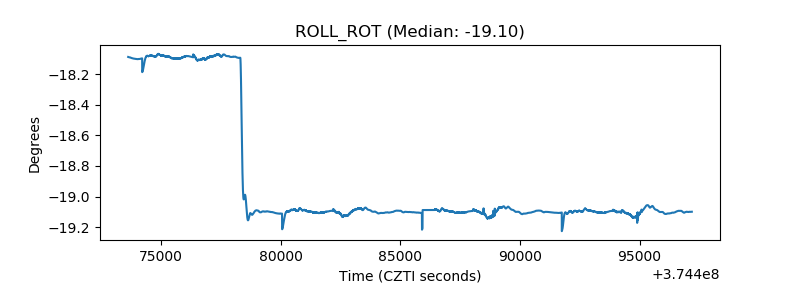 |
| _Roll_DEC | 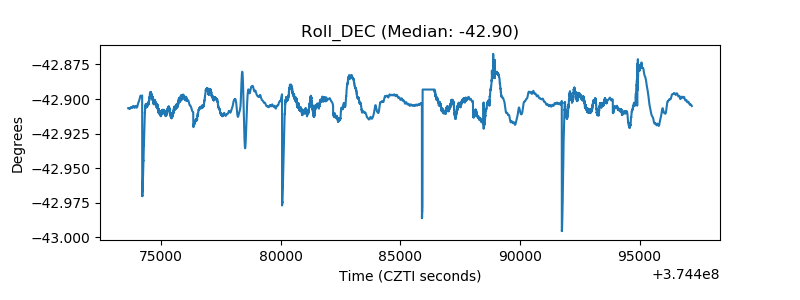 |
| _Roll_RA | 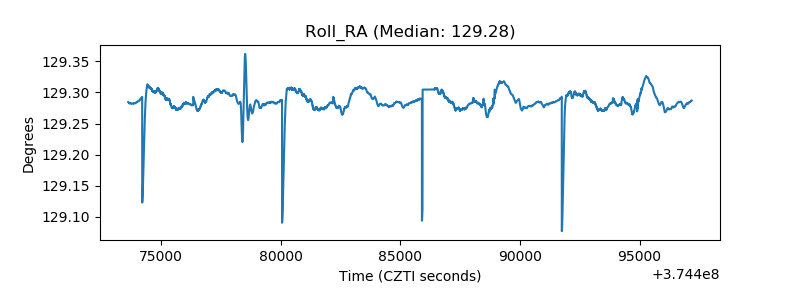 |
| Veto Counter | 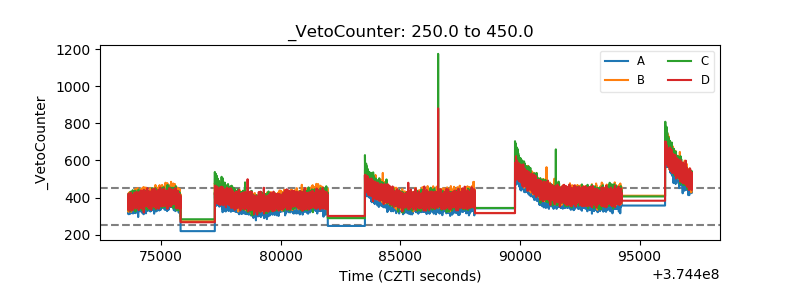 |