| Param | Original file | Final file |
|---|---|---|
| Filename | modeM0/AS1A11_096T01_9000004766_33132cztM0_level2.evt | modeM0/AS1A11_096T01_9000004766_33132cztM0_level2_quad_clean.evt |
| Size (bytes) | 548,524,800 | 54,826,560 |
| Size | 523.1 MB | 52.3 MB |
| Events in quadrant A | 2,824,757 | 332,264 |
| Events in quadrant B | 4,239,223 | 329,739 |
| Events in quadrant C | 3,334,651 | 315,762 |
| Events in quadrant D | 5,844,445 | 300,080 |
| Mode SS | |||
|---|---|---|---|
| Quadrant | BADHDUFLAG | Total packets | Discarded packets |
| A | 0 | 110 | 0 |
| B | 0 | 110 | 0 |
| C | 0 | 110 | 0 |
| D | 0 | 110 | 0 |
| Mode M0 | |||
|---|---|---|---|
| Quadrant | BADHDUFLAG | Total packets | Discarded packets |
| A | 0 | 11591 | 3 |
| B | 0 | 16202 | 2 |
| C | 0 | 13230 | 2 |
| D | 0 | 21342 | 2 |
| Mode M9 | |||
|---|---|---|---|
| Quadrant | BADHDUFLAG | Total packets | Discarded packets |
| A | 0 | 26 | 0 |
| B | 0 | 26 | 0 |
| C | 0 | 26 | 0 |
| D | 0 | 27 | 0 |
| Quadrant | Total seconds | Saturated seconds | Saturation percentage |
|---|---|---|---|
| A | 5457 | 4 | 0.073300% |
| B | 5457 | 378 | 6.926883% |
| C | 5457 | 124 | 2.272311% |
| D | 5457 | 583 | 10.683526% |
Noise dominated data is calculated using 1-second bins in cleaned event files. If a bin has >2000 counts, and if more than 50% of those come from <1% of pixels, then it is considered to be noise-dominated and hence unusable.
| Quadrant | # 1 sec bins | Bins with >0 counts | Bins with >2000 counts | High rate bins dominated by noise | Noise dominated (total time) | Noise dominated (detector-on time) | Marked lightcurve |
|---|---|---|---|---|---|---|---|
| A | 7401 | 5458 | 0 | 0 | 0.00% | 0.00% | 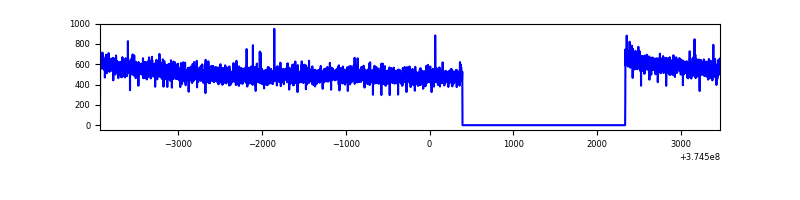 |
| B | 7401 | 5458 | 236 | 236 | 3.19% | 4.32% | 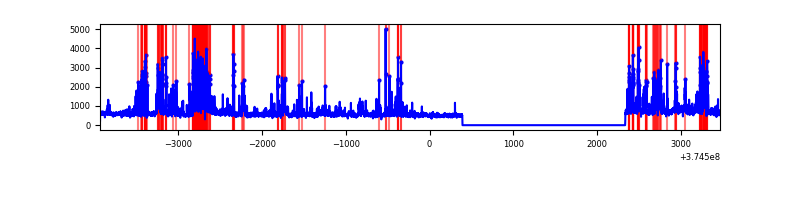 |
| C | 7401 | 5458 | 74 | 74 | 1.00% | 1.36% | 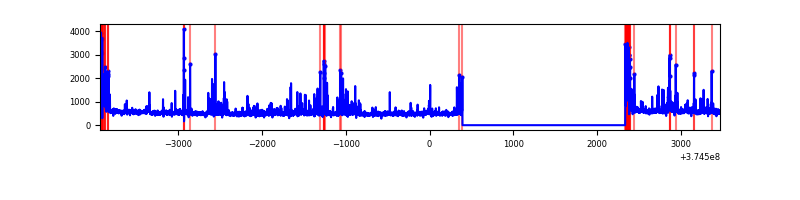 |
| D | 7401 | 5458 | 455 | 455 | 6.15% | 8.34% | 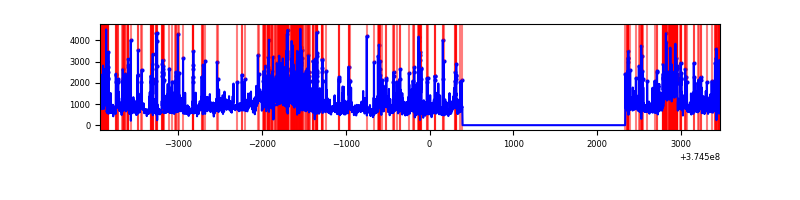 |
Top three noisy pixels from each quadrant. If the there are fewer than three noisy pixels in the level2.evt file, extra rows are filled as -1
| Pixel properties | Quadrant properties | ||||||
|---|---|---|---|---|---|---|---|
| Quadrant | DetID | PixID | Counts | Sigma | Mean | Median | Sigma |
| A | 13 | 6 | 10799 | 70.24 | 728 | 714 | 143.6 |
| A | 13 | 254 | 10361 | 67.19 | 728 | 714 | 143.6 |
| A | 0 | 226 | 6458 | 40.01 | 728 | 714 | 143.6 |
| B | 5 | 172 | 938913 | 7231.47 | 700 | 685 | 129.7 |
| B | 0 | 219 | 127661 | 978.68 | 700 | 685 | 129.7 |
| B | 5 | 200 | 89059 | 681.15 | 700 | 685 | 129.7 |
| C | 0 | 10 | 296901 | 1912.08 | 685 | 693 | 154.9 |
| C | 7 | 221 | 148423 | 953.63 | 685 | 693 | 154.9 |
| C | 9 | 187 | 88668 | 567.9 | 685 | 693 | 154.9 |
| D | 8 | 195 | 916002 | 5451.26 | 675 | 661 | 167.9 |
| D | 7 | 38 | 492287 | 2927.85 | 675 | 661 | 167.9 |
| D | 2 | 250 | 277699 | 1649.88 | 675 | 661 | 167.9 |
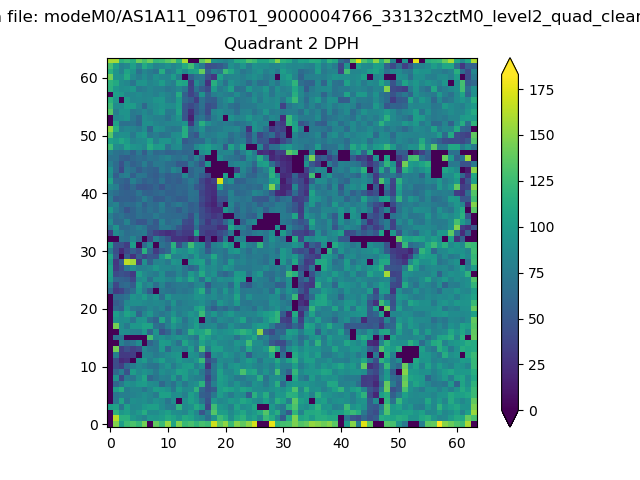
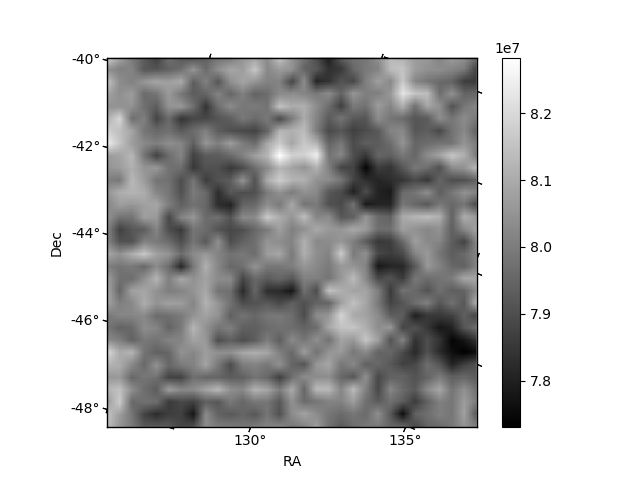
Histogram calculated using DETX and DETY for each event in the final _common_clean file
| Quadrant A | 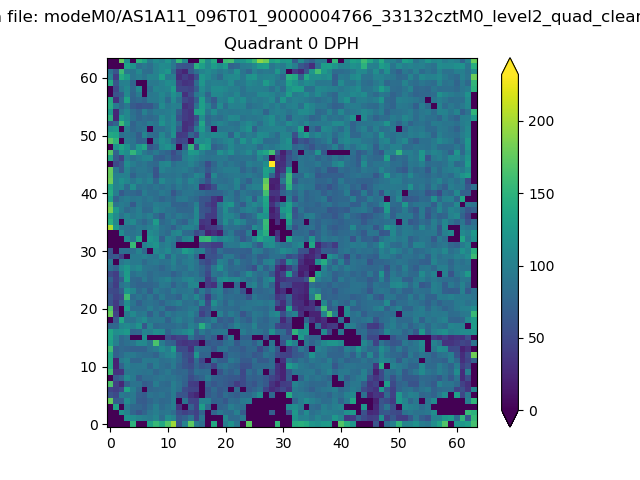 |
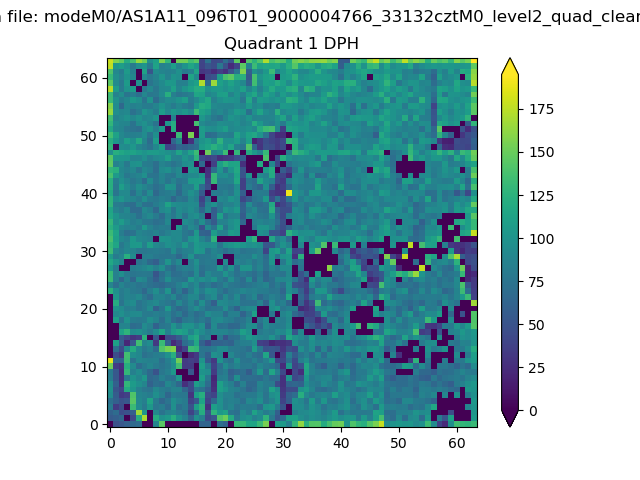 |
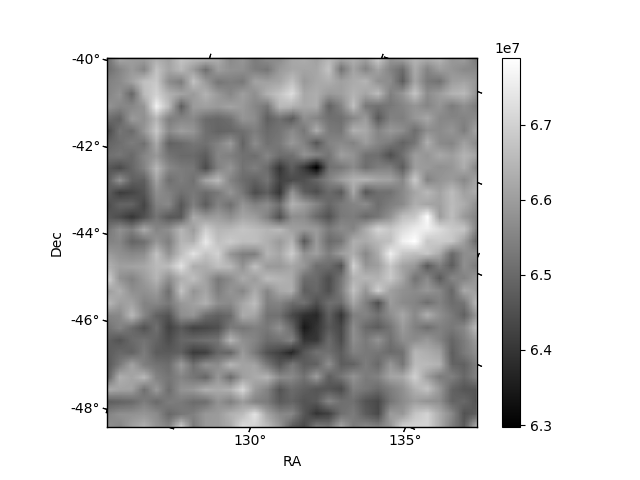
Quadrant B |
|---|---|---|---|
| Quadrant D | 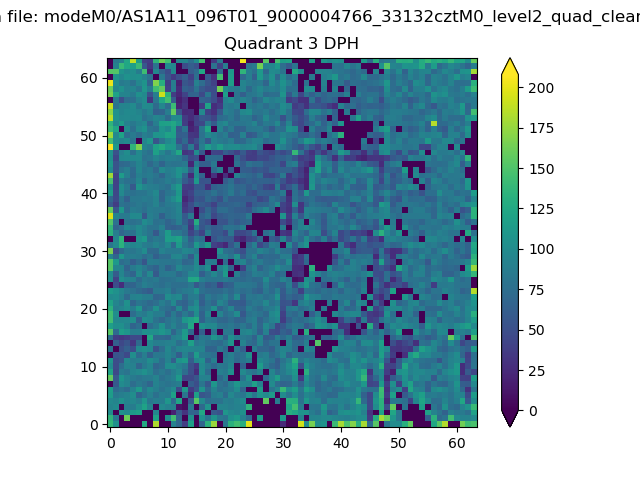 |
 |
Quadrant C |
| Plot type | Count rate plots | Images |
|---|---|---|
| Comparison with Poisson distribution Blue bars denote a histogram of data divided into 1 sec bins. Red curve is a Poisson curve with rate = median count rate of data. |
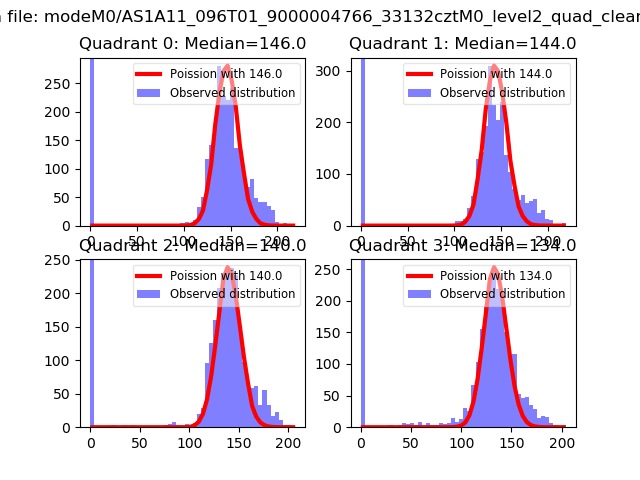 |
 |
| Quadrant-wise count rates Data is divided into 100 sec bins |
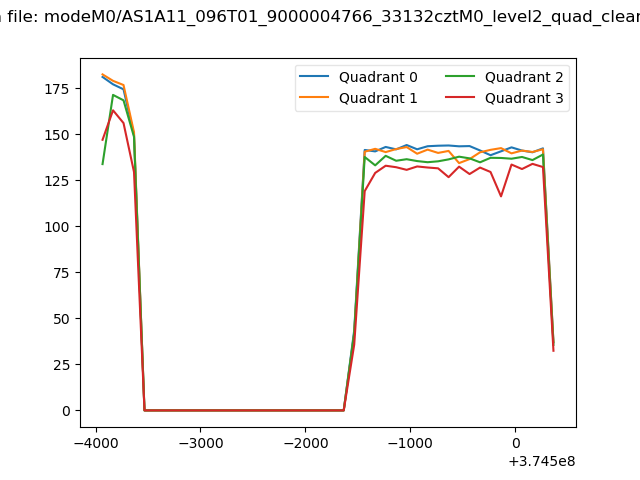 |
|
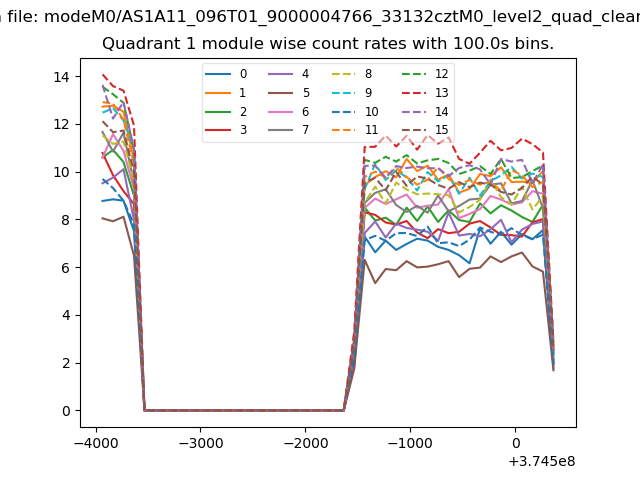
| Module-wise count rates for Quadrant A Data is divided into 100 sec bins |
 |
 |
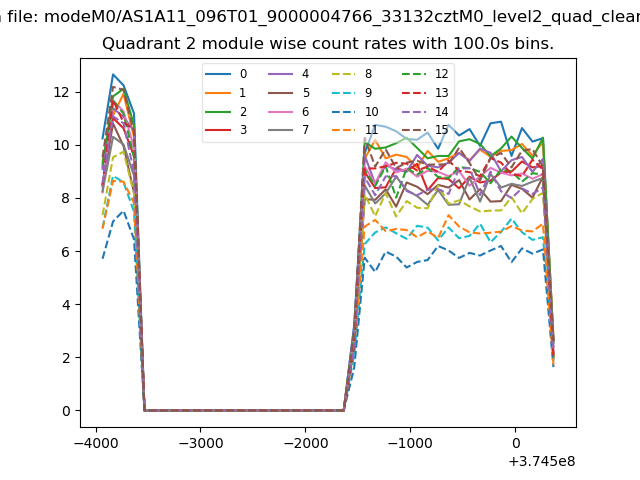
| Module-wise count rates for Quadrant B Data is divided into 100 sec bins |
 |
 |
| Module-wise count rates for Quadrant C Data is divided into 100 sec bins |
 |
 |
| Module-wise count rates for Quadrant D Data is divided into 100 sec bins |
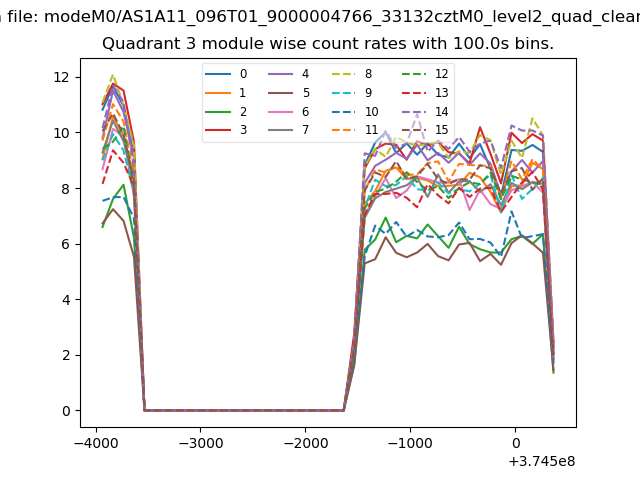 |
 |
| Parameter | Plot |
|---|---|
| CZT HV Monitor |  |
| D_VDD | 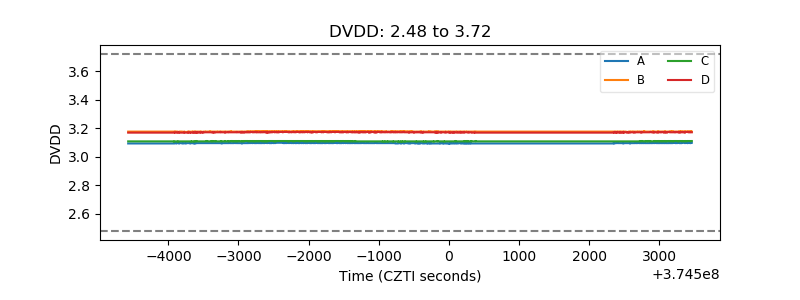 |
| Temperature 1 | 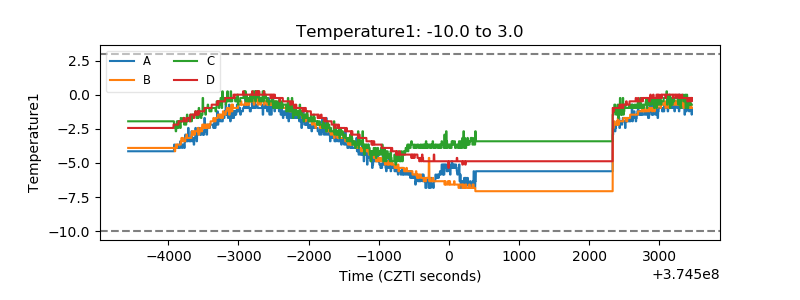 |
| Veto HV Monitor | 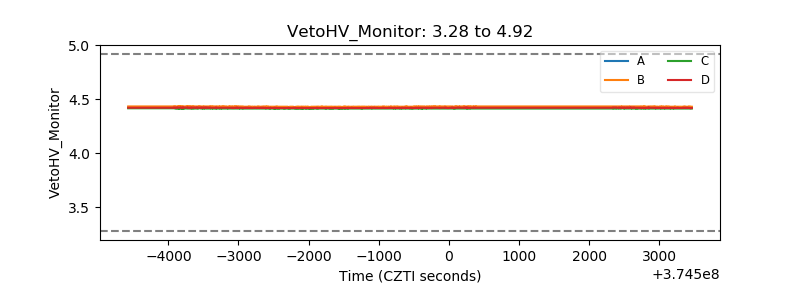 |
| Veto LLD | 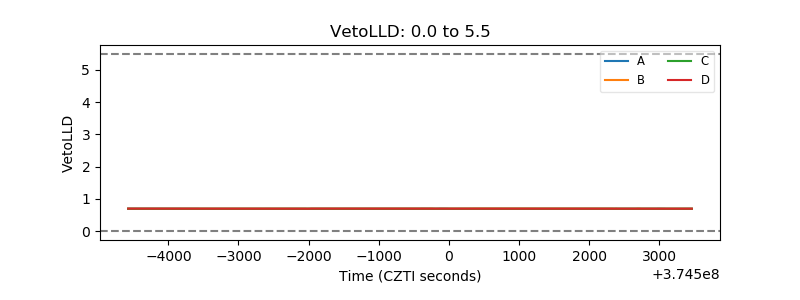 |
| Alpha Counter | 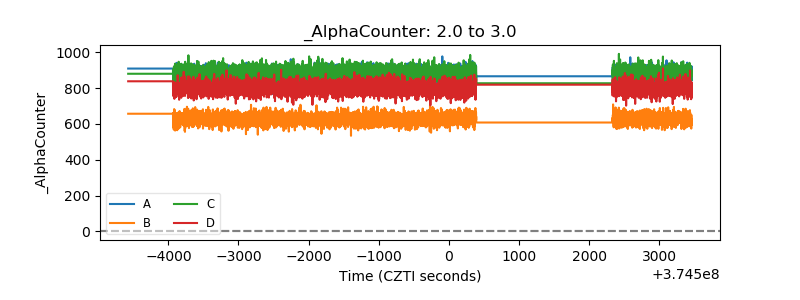 |
| _CPM_Rate | 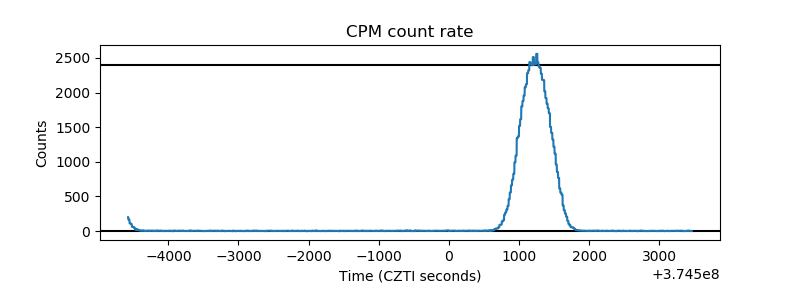 |
| CZT Counter | 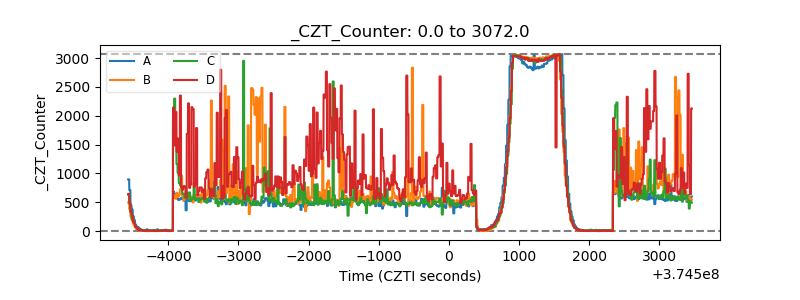 |
| +2.5 Volts monitor | 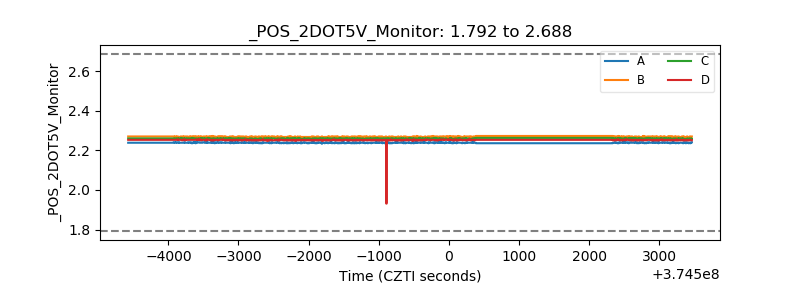 |
| +5 Volts monitor | 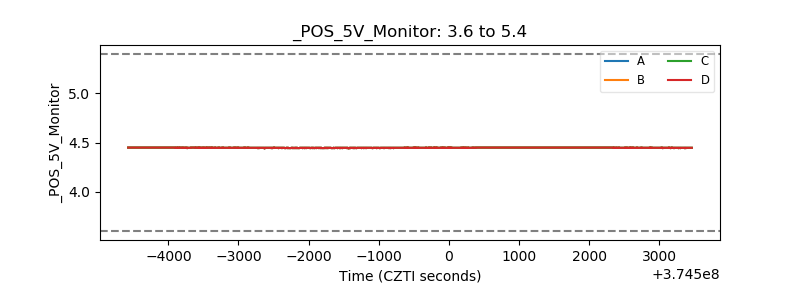 |
| _ROLL_ROT | 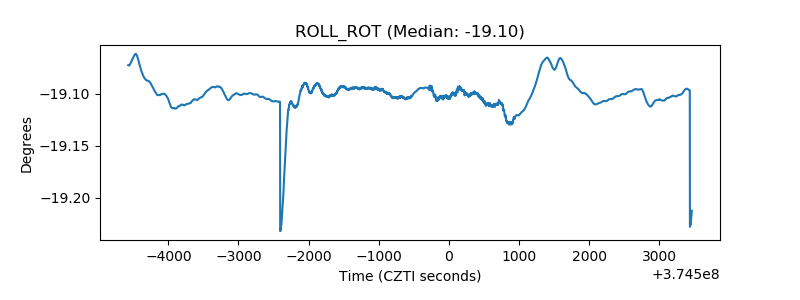 |
| _Roll_DEC |  |
| _Roll_RA | 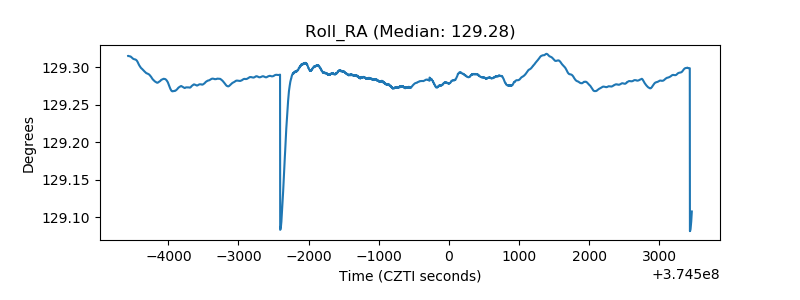 |
| Veto Counter | 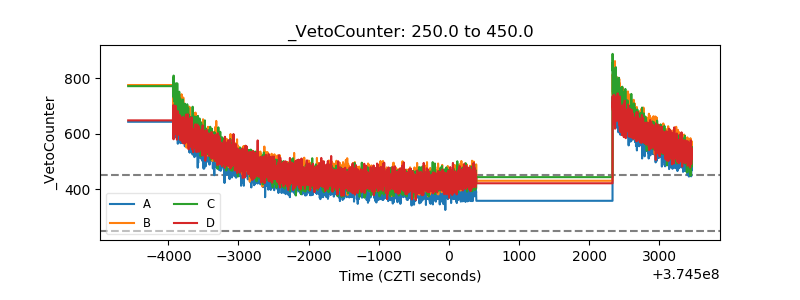 |