| Param | Original file | Final file |
|---|---|---|
| Filename | modeM0/AS1A11_096T01_9000004766_33133cztM0_level2.evt | modeM0/AS1A11_096T01_9000004766_33133cztM0_level2_quad_clean.evt |
| Size (bytes) | 566,225,280 | 53,521,920 |
| Size | 540.0 MB | 51.0 MB |
| Events in quadrant A | 2,799,280 | 326,207 |
| Events in quadrant B | 3,835,460 | 325,103 |
| Events in quadrant C | 3,380,697 | 311,816 |
| Events in quadrant D | 6,777,543 | 289,474 |
| Mode SS | |||
|---|---|---|---|
| Quadrant | BADHDUFLAG | Total packets | Discarded packets |
| A | 0 | 106 | 0 |
| B | 0 | 106 | 0 |
| C | 0 | 106 | 0 |
| D | 0 | 106 | 0 |
| Mode M0 | |||
|---|---|---|---|
| Quadrant | BADHDUFLAG | Total packets | Discarded packets |
| A | 0 | 11450 | 3 |
| B | 0 | 14824 | 2 |
| C | 0 | 13315 | 2 |
| D | 0 | 23924 | 2 |
| Mode M9 | |||
|---|---|---|---|
| Quadrant | BADHDUFLAG | Total packets | Discarded packets |
| A | 0 | 24 | 0 |
| B | 0 | 24 | 0 |
| C | 0 | 24 | 0 |
| D | 0 | 25 | 0 |
| Quadrant | Total seconds | Saturated seconds | Saturation percentage |
|---|---|---|---|
| A | 5252 | 7 | 0.133283% |
| B | 5252 | 229 | 4.360244% |
| C | 5252 | 148 | 2.817974% |
| D | 5252 | 1244 | 23.686215% |
Noise dominated data is calculated using 1-second bins in cleaned event files. If a bin has >2000 counts, and if more than 50% of those come from <1% of pixels, then it is considered to be noise-dominated and hence unusable.
| Quadrant | # 1 sec bins | Bins with >0 counts | Bins with >2000 counts | High rate bins dominated by noise | Noise dominated (total time) | Noise dominated (detector-on time) | Marked lightcurve |
|---|---|---|---|---|---|---|---|
| A | 7285 | 5253 | 0 | 0 | 0.00% | 0.00% | 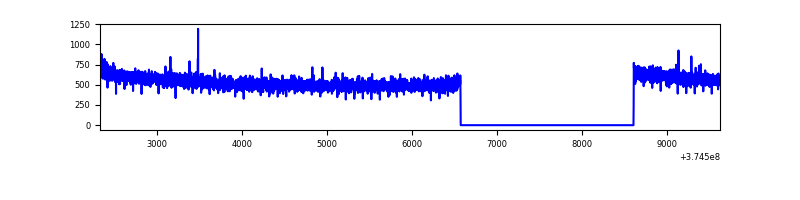 |
| B | 7285 | 5253 | 141 | 141 | 1.94% | 2.68% | 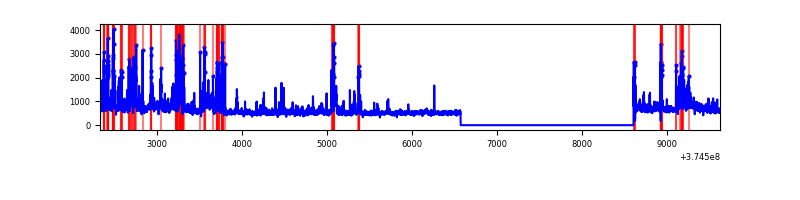 |
| C | 7285 | 5253 | 98 | 98 | 1.35% | 1.87% | 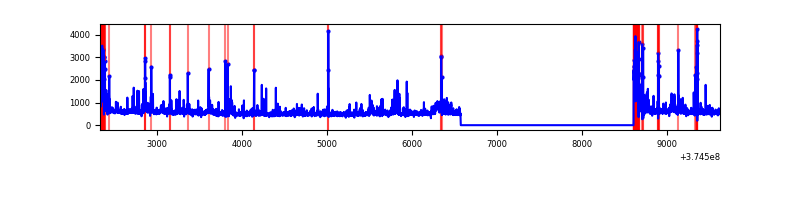 |
| D | 7285 | 5253 | 1000 | 1000 | 13.73% | 19.04% | 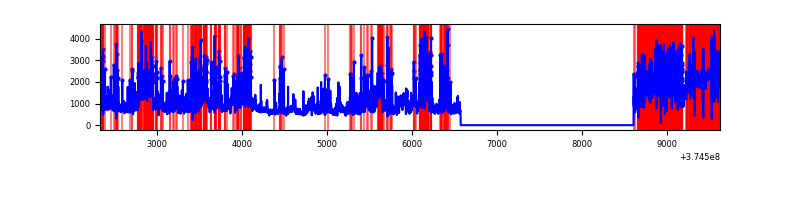 |
Top three noisy pixels from each quadrant. If the there are fewer than three noisy pixels in the level2.evt file, extra rows are filled as -1
| Pixel properties | Quadrant properties | ||||||
|---|---|---|---|---|---|---|---|
| Quadrant | DetID | PixID | Counts | Sigma | Mean | Median | Sigma |
| A | 13 | 6 | 12080 | 80.27 | 721 | 708 | 141.7 |
| A | 13 | 254 | 10188 | 66.92 | 721 | 708 | 141.7 |
| A | 0 | 226 | 6516 | 41.0 | 721 | 708 | 141.7 |
| B | 5 | 172 | 689519 | 5325.1 | 702 | 688 | 129.4 |
| B | 0 | 189 | 137916 | 1060.86 | 702 | 688 | 129.4 |
| B | 0 | 219 | 87876 | 674.02 | 702 | 688 | 129.4 |
| C | 0 | 10 | 374665 | 2469.28 | 671 | 677 | 151.5 |
| C | 9 | 187 | 174252 | 1146.04 | 671 | 677 | 151.5 |
| C | 7 | 221 | 70625 | 461.84 | 671 | 677 | 151.5 |
| D | 8 | 195 | 1303606 | 8894.47 | 604 | 592 | 146.5 |
| D | 14 | 52 | 764176 | 5212.28 | 604 | 592 | 146.5 |
| D | 2 | 249 | 613495 | 4183.72 | 604 | 592 | 146.5 |
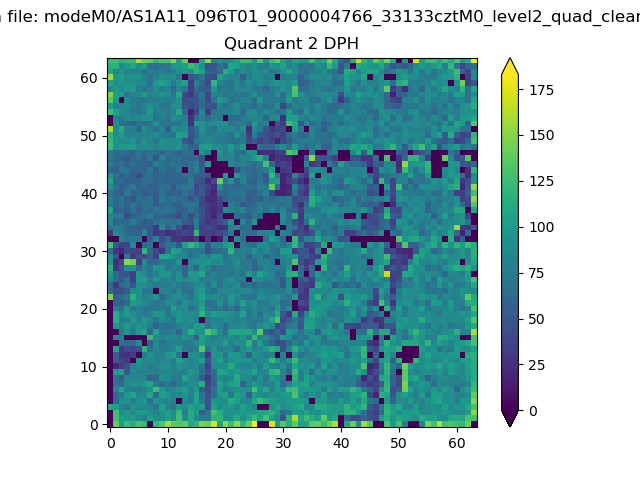
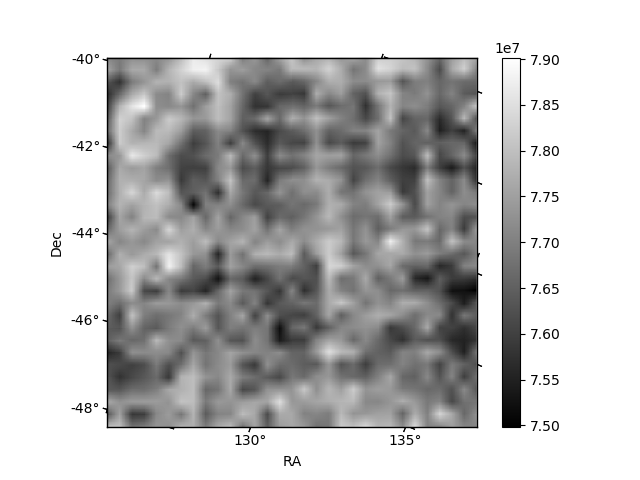
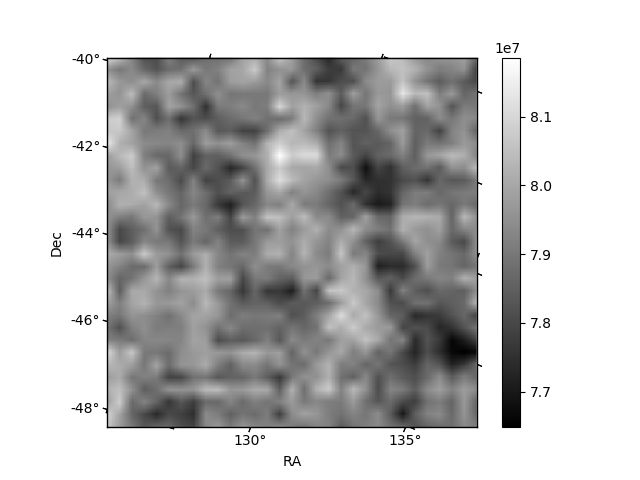
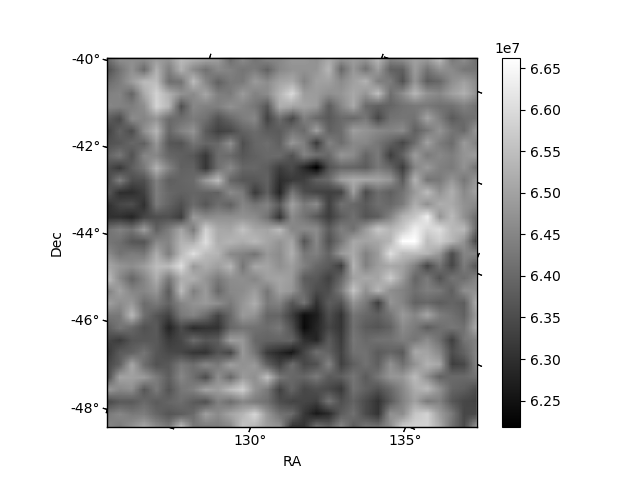
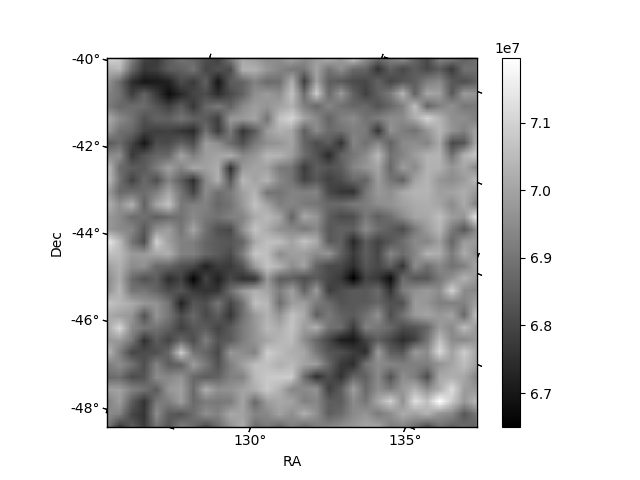
Histogram calculated using DETX and DETY for each event in the final _common_clean file
| Quadrant A | 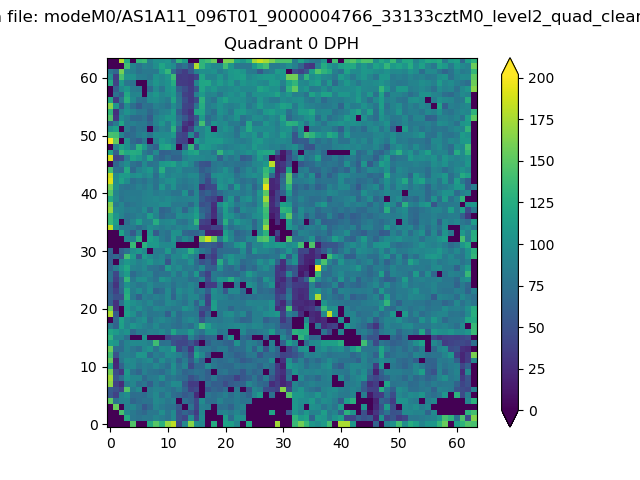 |
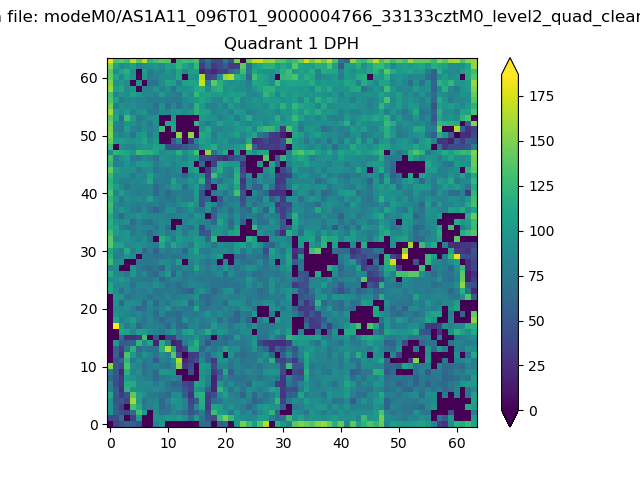 |
Quadrant B |
|---|---|---|---|
| Quadrant D | 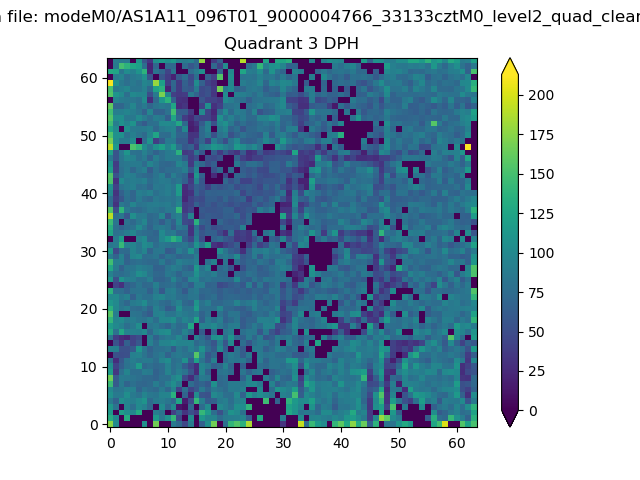 |
 |
Quadrant C |
| Plot type | Count rate plots | Images |
|---|---|---|
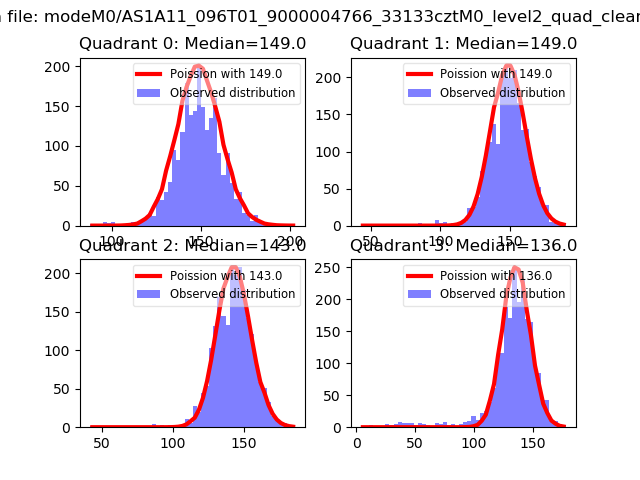
| Comparison with Poisson distribution Blue bars denote a histogram of data divided into 1 sec bins. Red curve is a Poisson curve with rate = median count rate of data. |
 |
 |
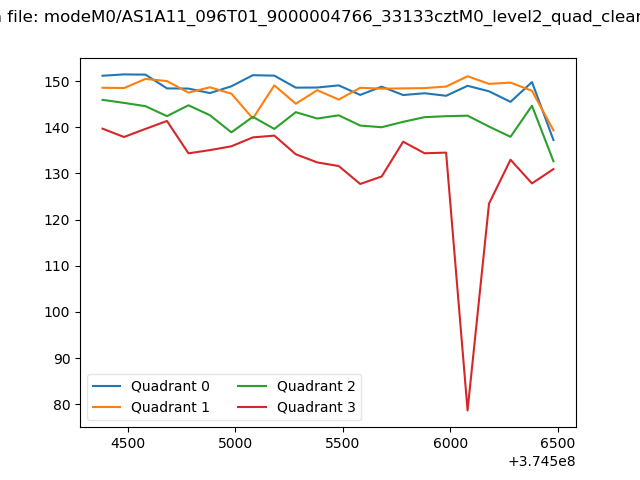
| Quadrant-wise count rates Data is divided into 100 sec bins |
 |
|
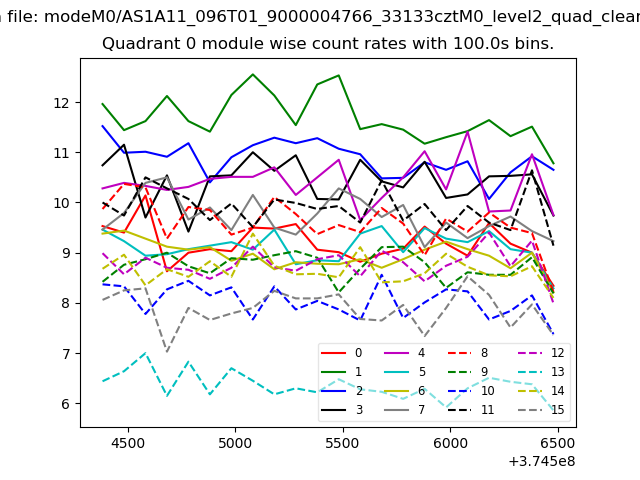
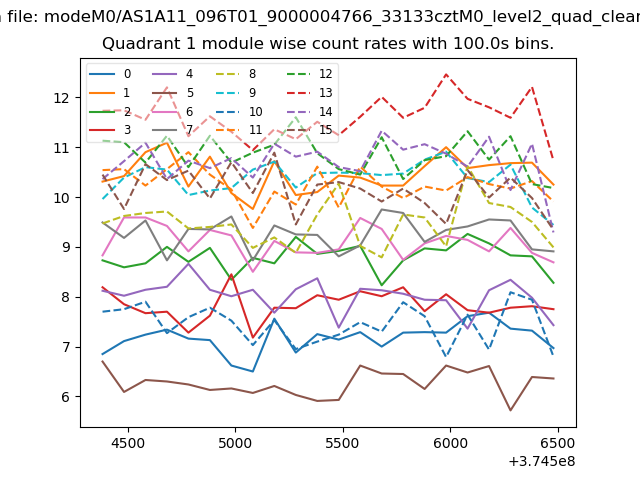
| Module-wise count rates for Quadrant A Data is divided into 100 sec bins |
 |
 |
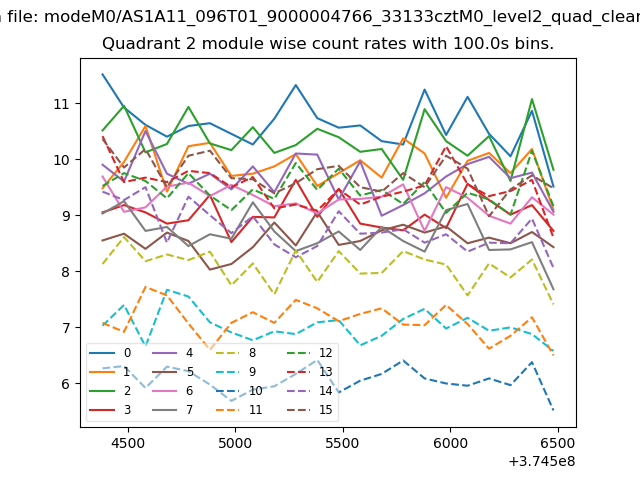
| Module-wise count rates for Quadrant B Data is divided into 100 sec bins |
 |
 |
| Module-wise count rates for Quadrant C Data is divided into 100 sec bins |
 |
 |
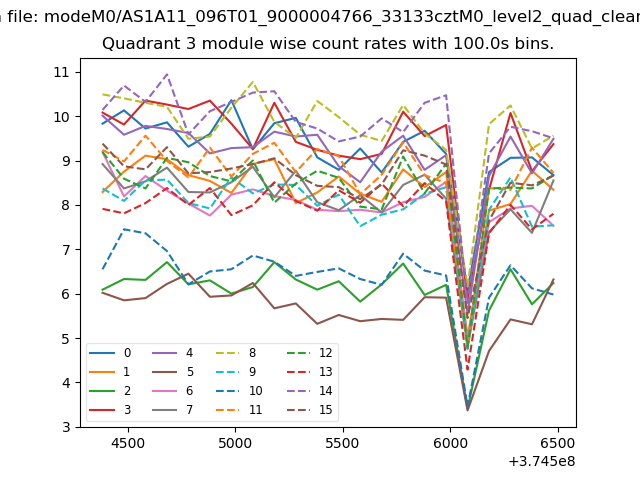
| Module-wise count rates for Quadrant D Data is divided into 100 sec bins |
 |
 |
| Parameter | Plot |
|---|---|
| CZT HV Monitor | 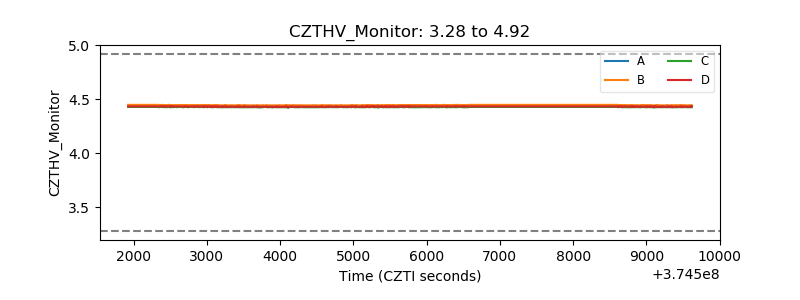 |
| D_VDD | 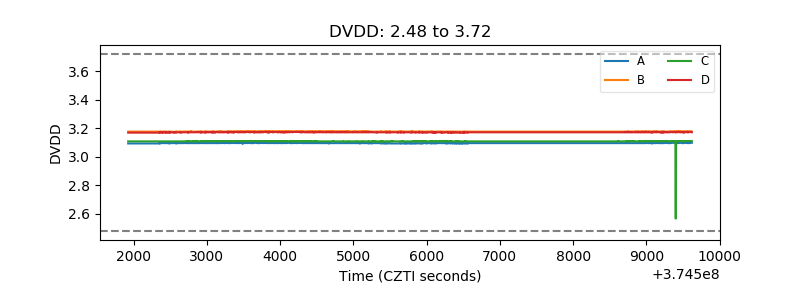 |
| Temperature 1 | 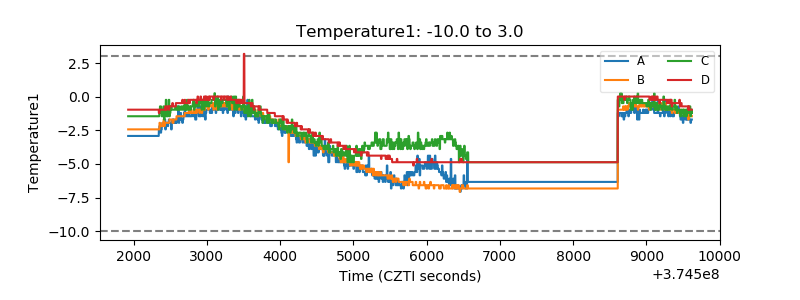 |
| Veto HV Monitor | 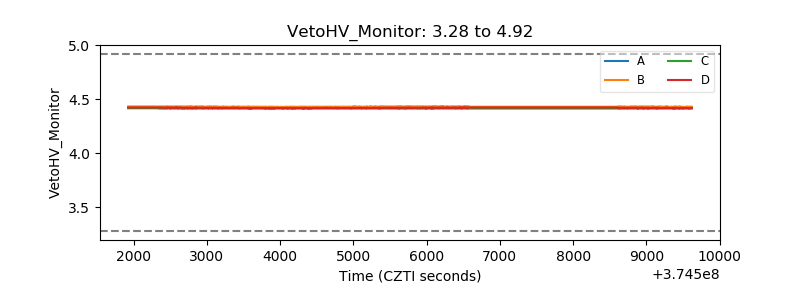 |
| Veto LLD | 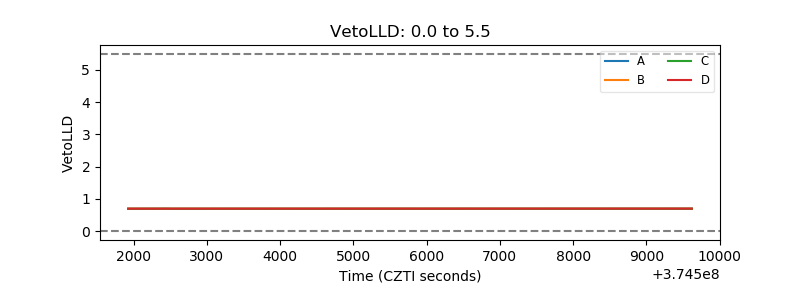 |
| Alpha Counter | 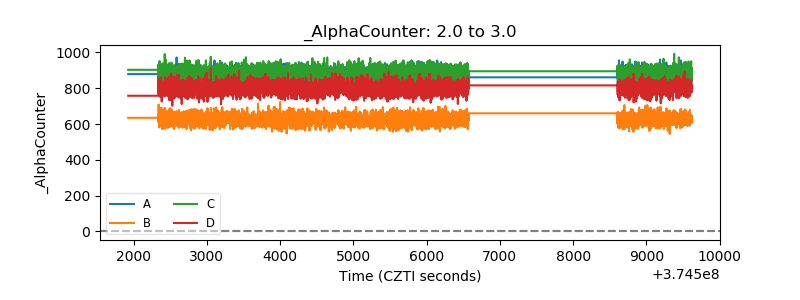 |
| _CPM_Rate | 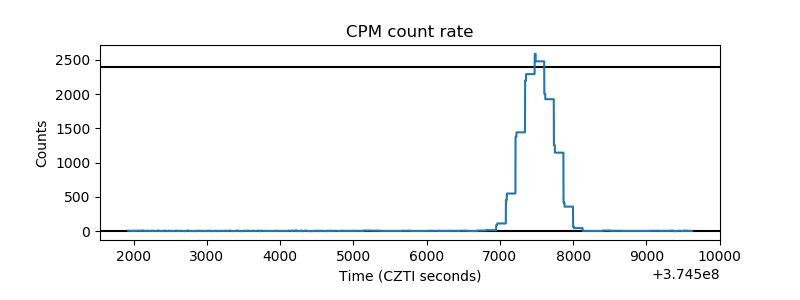 |
| CZT Counter | 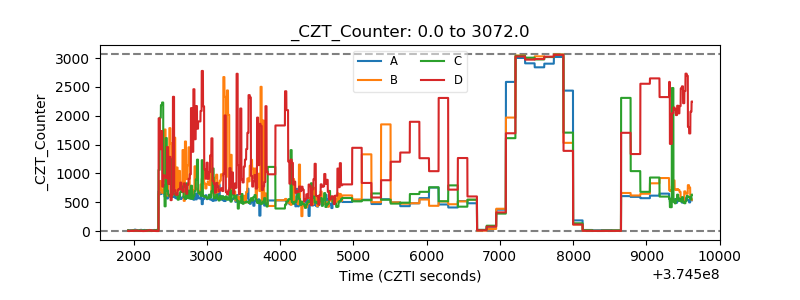 |
| +2.5 Volts monitor |  |
| +5 Volts monitor | 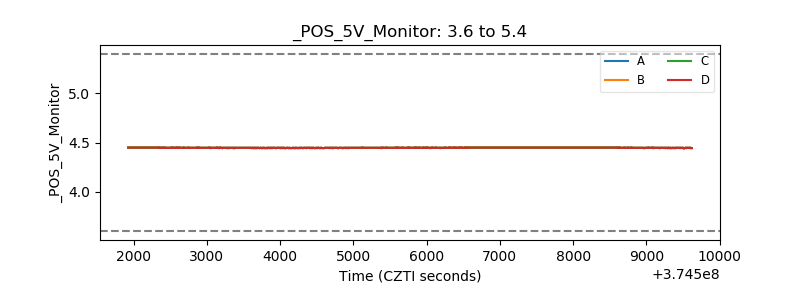 |
| _ROLL_ROT | 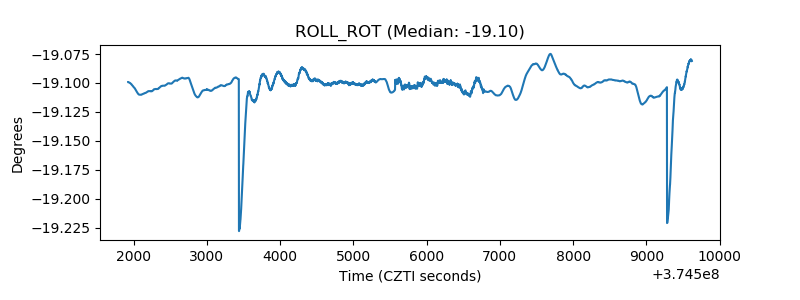 |
| _Roll_DEC |  |
| _Roll_RA | 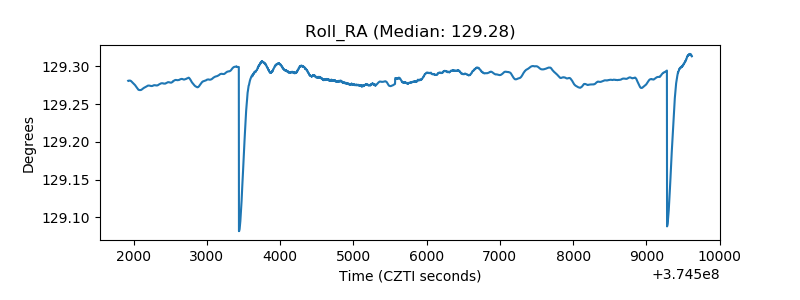 |
| Veto Counter | 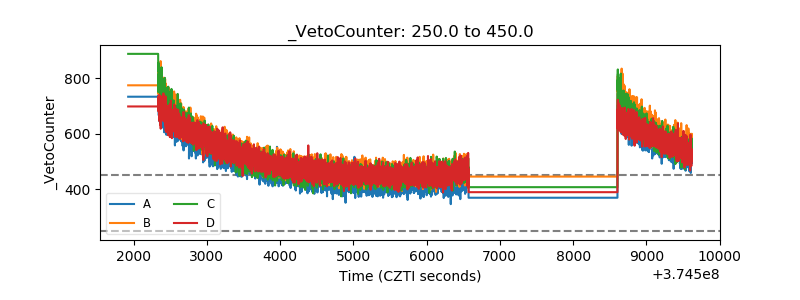 |