| Param | Original file | Final file |
|---|---|---|
| Filename | modeM0/AS1A11_096T01_9000004766_33135cztM0_level2.evt | modeM0/AS1A11_096T01_9000004766_33135cztM0_level2_quad_clean.evt |
| Size (bytes) | 496,416,960 | 65,358,720 |
| Size | 473.4 MB | 62.3 MB |
| Events in quadrant A | 2,425,499 | 433,211 |
| Events in quadrant B | 3,531,569 | 432,872 |
| Events in quadrant C | 2,714,257 | 415,455 |
| Events in quadrant D | 6,041,974 | 364,632 |
| Mode SS | |||
|---|---|---|---|
| Quadrant | BADHDUFLAG | Total packets | Discarded packets |
| A | 0 | 94 | 0 |
| B | 0 | 94 | 0 |
| C | 0 | 94 | 0 |
| D | 0 | 94 | 0 |
| Mode M0 | |||
|---|---|---|---|
| Quadrant | BADHDUFLAG | Total packets | Discarded packets |
| A | 0 | 9926 | 2 |
| B | 0 | 13519 | 1 |
| C | 0 | 10975 | 1 |
| D | 0 | 21281 | 1 |
| Mode M9 | |||
|---|---|---|---|
| Quadrant | BADHDUFLAG | Total packets | Discarded packets |
| A | 0 | 22 | 0 |
| B | 0 | 22 | 0 |
| C | 0 | 22 | 0 |
| D | 0 | 22 | 0 |
| Quadrant | Total seconds | Saturated seconds | Saturation percentage |
|---|---|---|---|
| A | 4747 | 11 | 0.231725% |
| B | 4747 | 259 | 5.456078% |
| C | 4747 | 77 | 1.622077% |
| D | 4747 | 694 | 14.619760% |
Noise dominated data is calculated using 1-second bins in cleaned event files. If a bin has >2000 counts, and if more than 50% of those come from <1% of pixels, then it is considered to be noise-dominated and hence unusable.
| Quadrant | # 1 sec bins | Bins with >0 counts | Bins with >2000 counts | High rate bins dominated by noise | Noise dominated (total time) | Noise dominated (detector-on time) | Marked lightcurve |
|---|---|---|---|---|---|---|---|
| A | 6869 | 4748 | 3 | 3 | 0.04% | 0.06% | 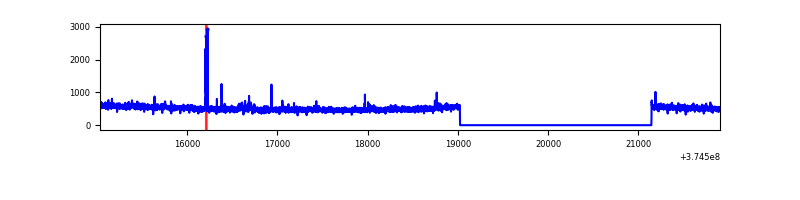 |
| B | 6869 | 4748 | 136 | 136 | 1.98% | 2.86% | 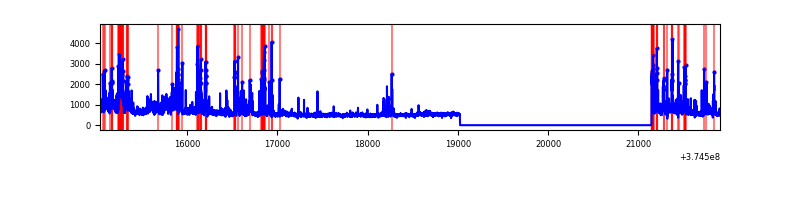 |
| C | 6869 | 4748 | 63 | 63 | 0.92% | 1.33% | 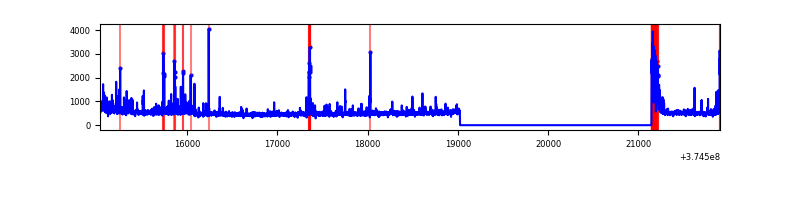 |
| D | 6869 | 4748 | 628 | 628 | 9.14% | 13.23% | 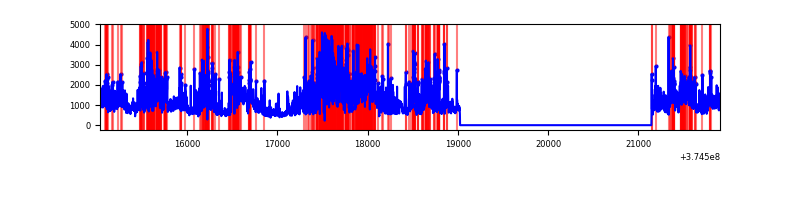 |
Top three noisy pixels from each quadrant. If the there are fewer than three noisy pixels in the level2.evt file, extra rows are filled as -1
| Pixel properties | Quadrant properties | ||||||
|---|---|---|---|---|---|---|---|
| Quadrant | DetID | PixID | Counts | Sigma | Mean | Median | Sigma |
| A | 14 | 235 | 31034 | 249.27 | 610 | 600 | 122.1 |
| A | 13 | 6 | 18155 | 143.79 | 610 | 600 | 122.1 |
| A | 0 | 79 | 17404 | 137.63 | 610 | 600 | 122.1 |
| B | 5 | 172 | 567919 | 5097.33 | 598 | 586 | 111.3 |
| B | 0 | 219 | 258959 | 2321.41 | 598 | 586 | 111.3 |
| B | 0 | 189 | 138563 | 1239.69 | 598 | 586 | 111.3 |
| C | 7 | 221 | 169052 | 1283.11 | 575 | 580 | 131.3 |
| C | 0 | 10 | 156161 | 1184.93 | 575 | 580 | 131.3 |
| C | 1 | 241 | 97571 | 738.7 | 575 | 580 | 131.3 |
| D | 8 | 195 | 1378371 | 9996.94 | 548 | 538 | 137.8 |
| D | 2 | 250 | 751746 | 5450.43 | 548 | 538 | 137.8 |
| D | 1 | 47 | 386374 | 2799.45 | 548 | 538 | 137.8 |
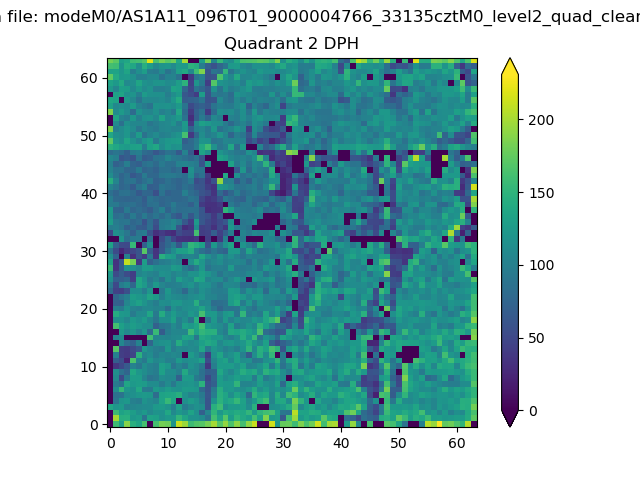
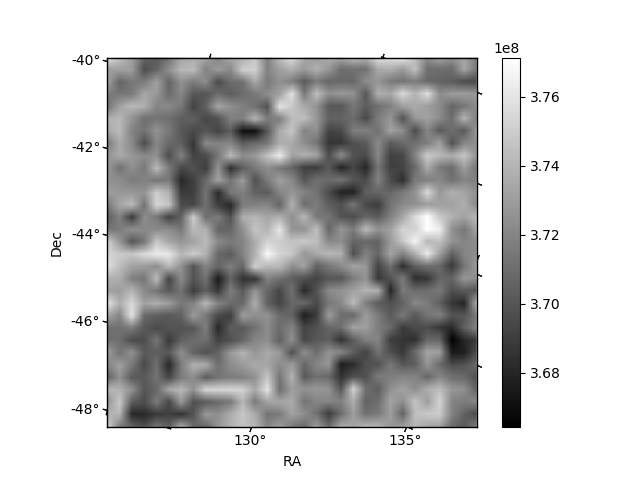
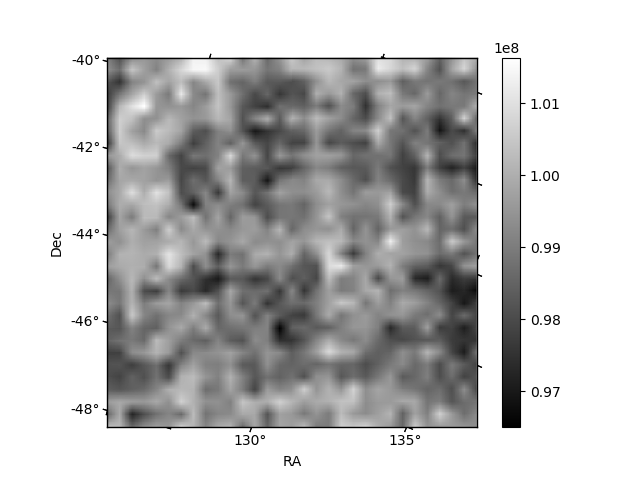
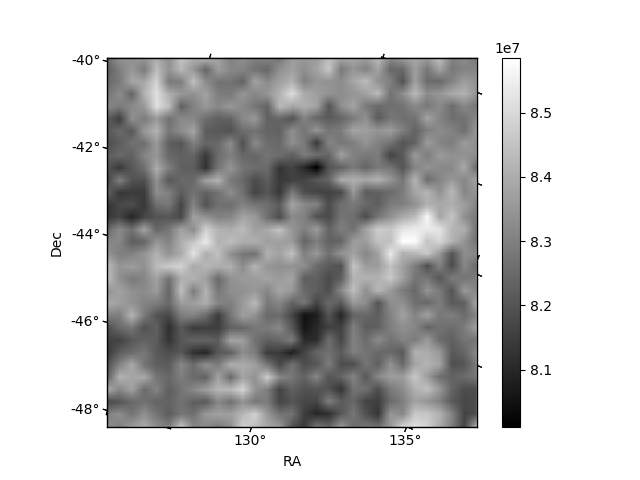
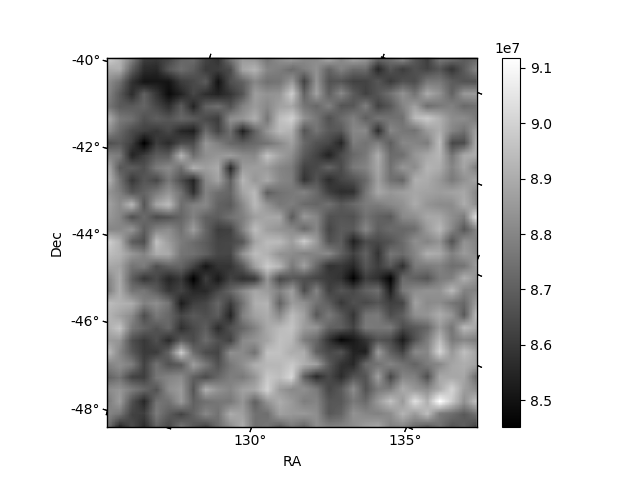
Histogram calculated using DETX and DETY for each event in the final _common_clean file
| Quadrant A | 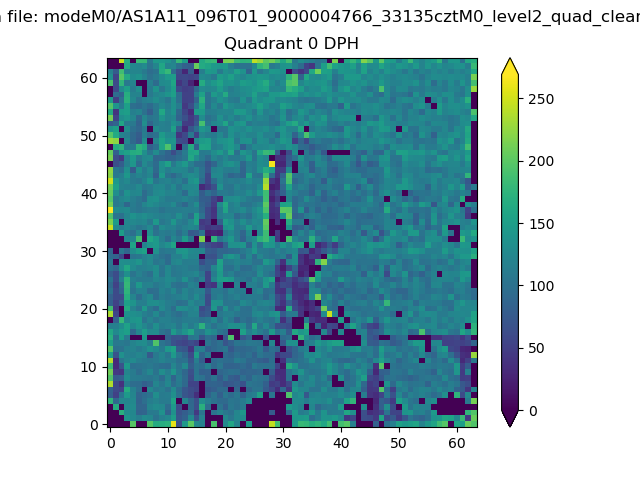 |
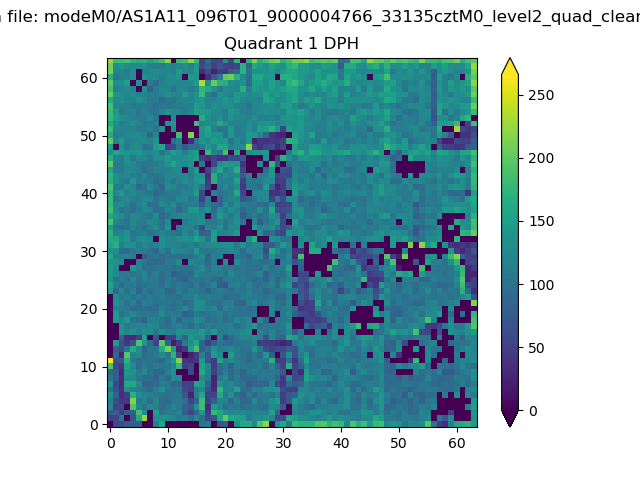 |
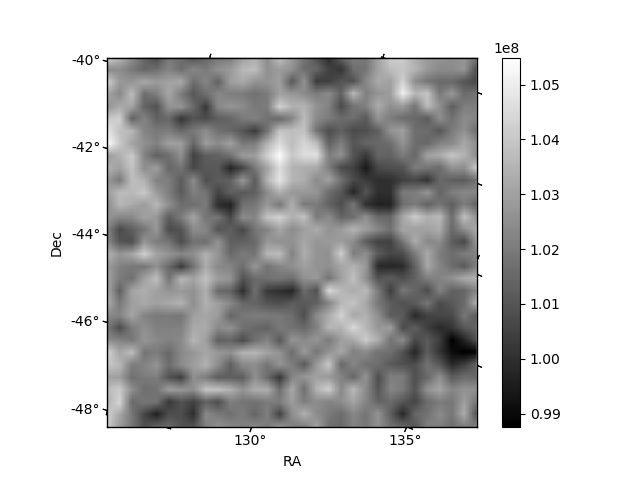
Quadrant B |
|---|---|---|---|
| Quadrant D | 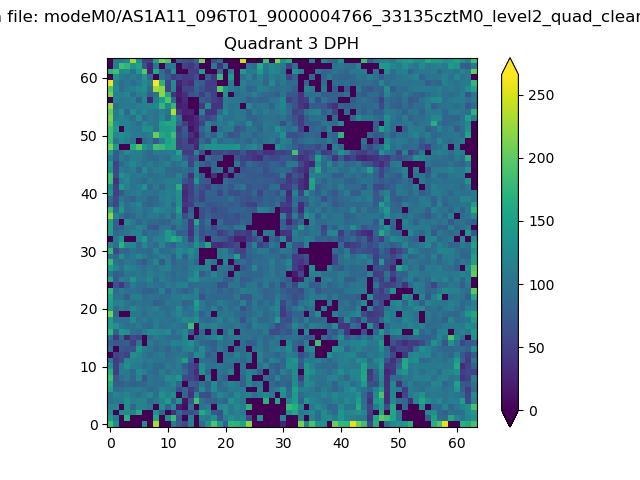 |
 |
Quadrant C |
| Plot type | Count rate plots | Images |
|---|---|---|
| Comparison with Poisson distribution Blue bars denote a histogram of data divided into 1 sec bins. Red curve is a Poisson curve with rate = median count rate of data. |
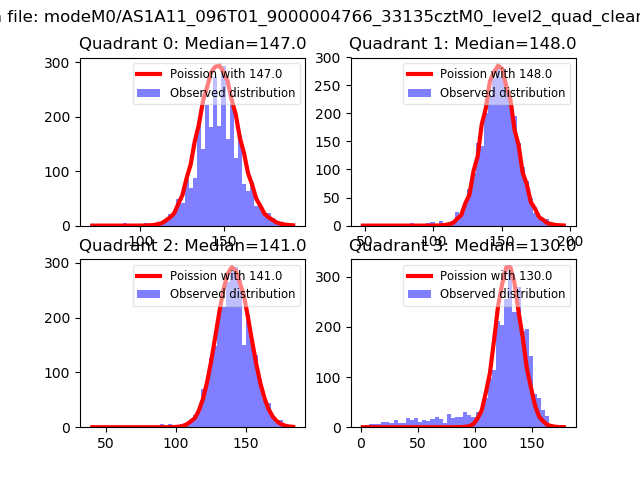 |
 |
| Quadrant-wise count rates Data is divided into 100 sec bins |
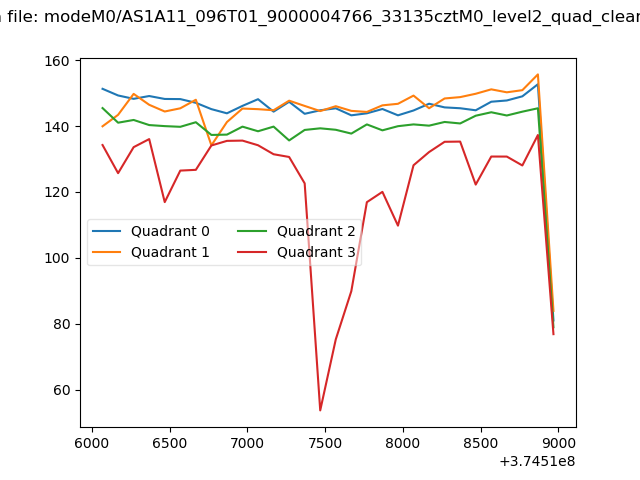 |
|
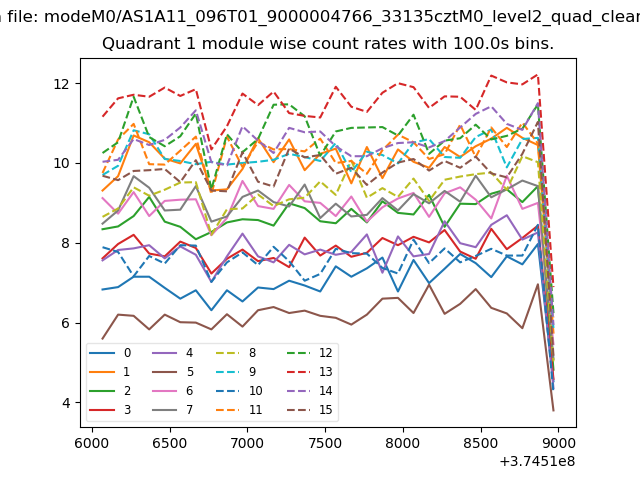
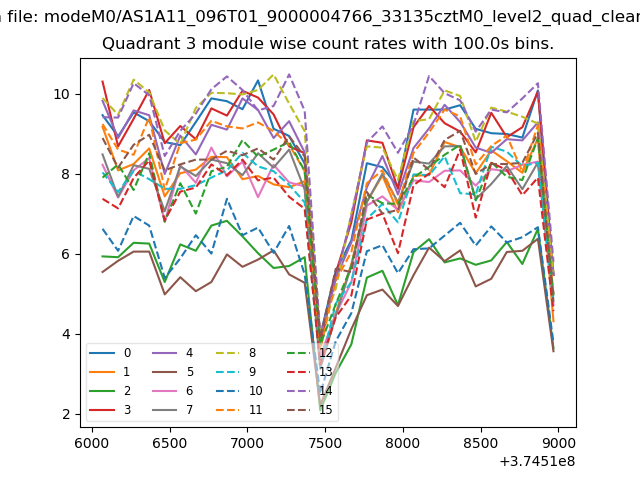
| Module-wise count rates for Quadrant A Data is divided into 100 sec bins |
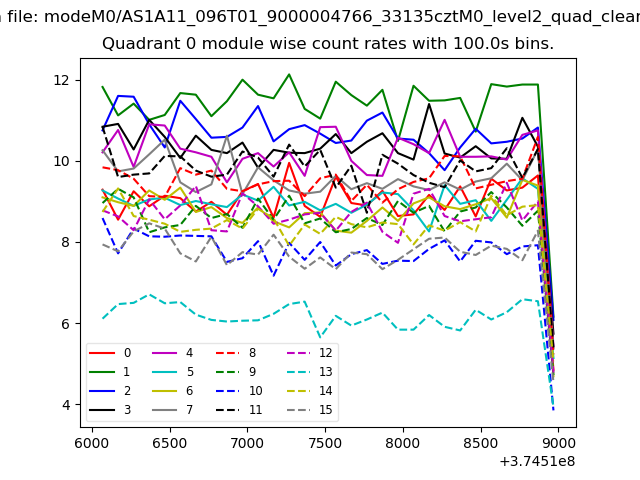 |
 |
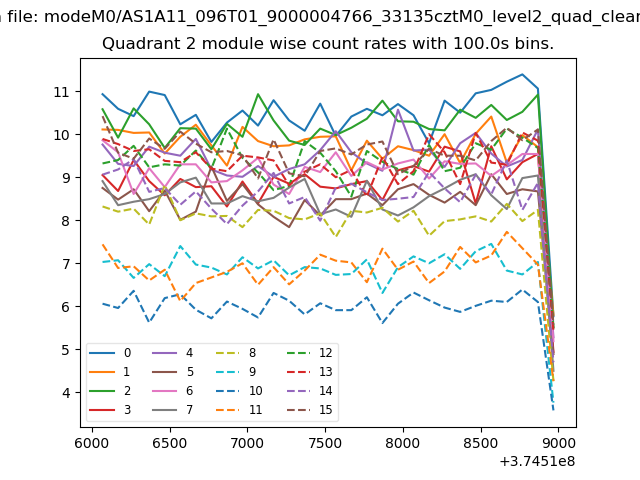
| Module-wise count rates for Quadrant B Data is divided into 100 sec bins |
 |
 |
| Module-wise count rates for Quadrant C Data is divided into 100 sec bins |
 |
 |
| Module-wise count rates for Quadrant D Data is divided into 100 sec bins |
 |
 |
| Parameter | Plot |
|---|---|
| CZT HV Monitor | 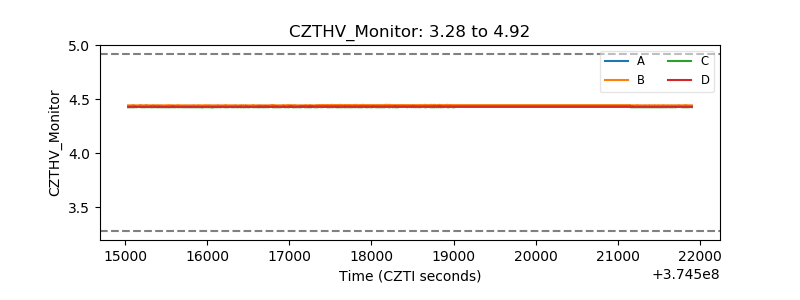 |
| D_VDD | 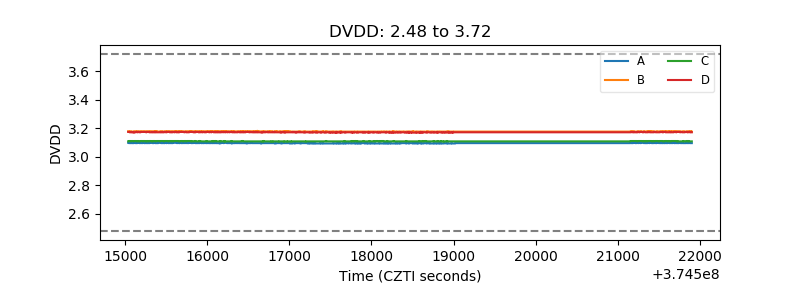 |
| Temperature 1 | 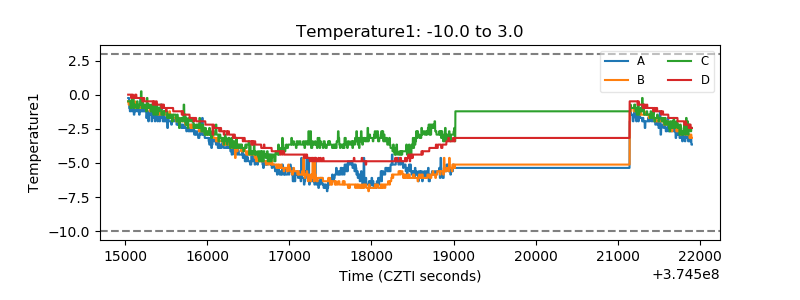 |
| Veto HV Monitor |  |
| Veto LLD | 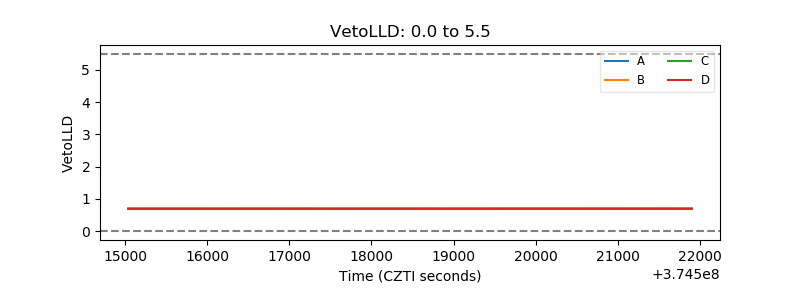 |
| Alpha Counter | 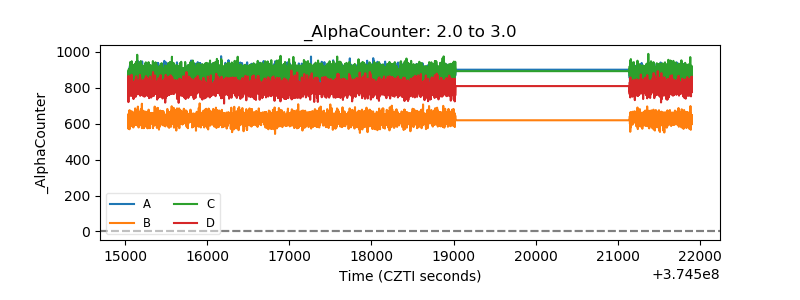 |
| _CPM_Rate | 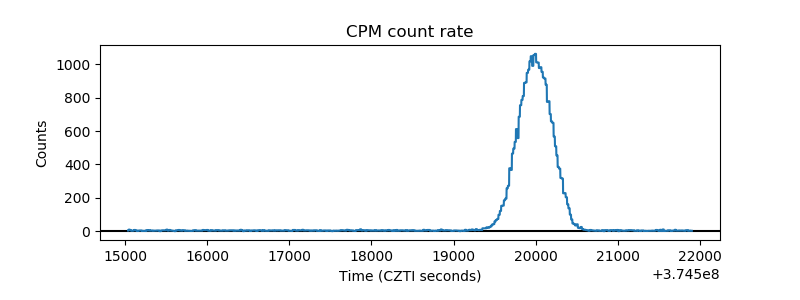 |
| CZT Counter | 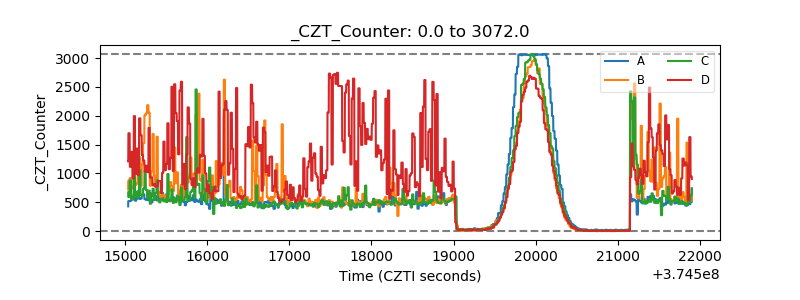 |
| +2.5 Volts monitor | 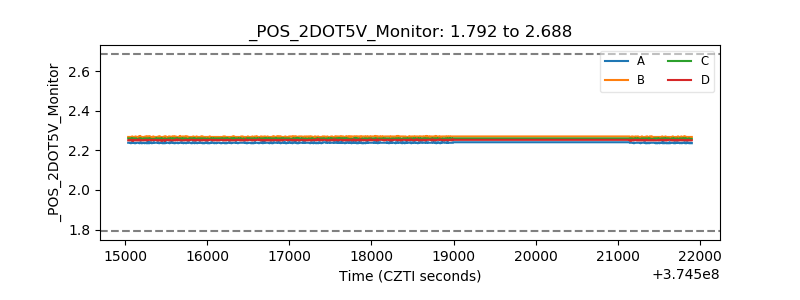 |
| +5 Volts monitor |  |
| _ROLL_ROT | 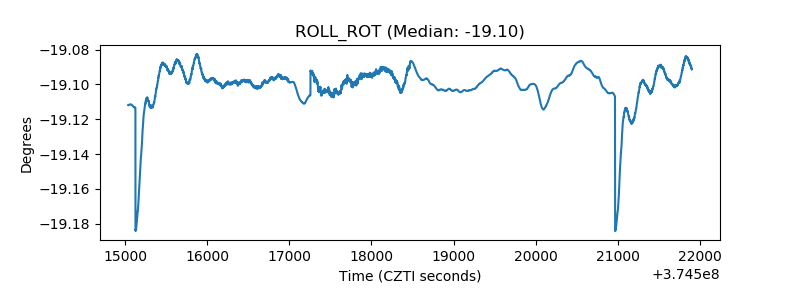 |
| _Roll_DEC | 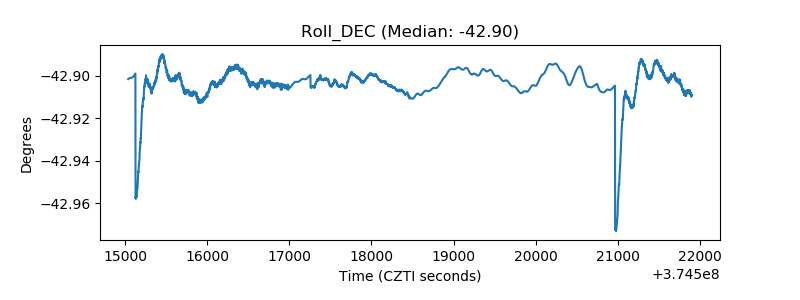 |
| _Roll_RA | 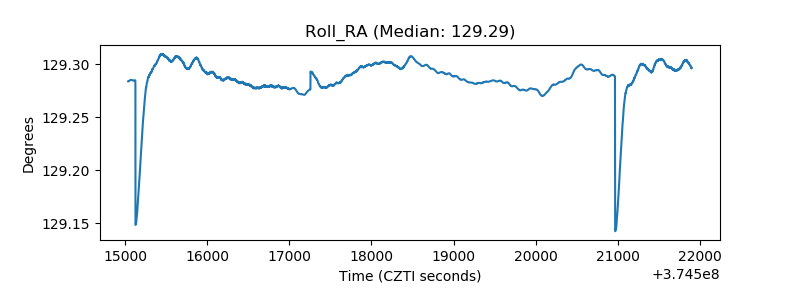 |
| Veto Counter | 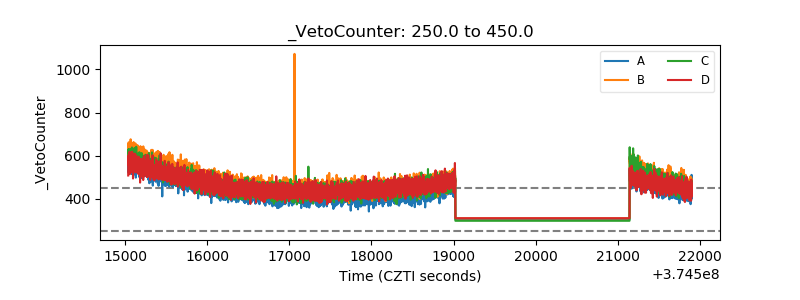 |