| Param | Original file | Final file |
|---|---|---|
| Filename | modeM0/AS1A11_096T01_9000004766_33136cztM0_level2.evt | modeM0/AS1A11_096T01_9000004766_33136cztM0_level2_quad_clean.evt |
| Size (bytes) | 501,016,320 | 80,196,480 |
| Size | 477.8 MB | 76.5 MB |
| Events in quadrant A | 2,400,057 | 543,287 |
| Events in quadrant B | 3,179,523 | 545,459 |
| Events in quadrant C | 2,943,671 | 526,553 |
| Events in quadrant D | 6,308,180 | 459,251 |
| Mode SS | |||
|---|---|---|---|
| Quadrant | BADHDUFLAG | Total packets | Discarded packets |
| A | 0 | 102 | 0 |
| B | 0 | 102 | 0 |
| C | 0 | 102 | 0 |
| D | 0 | 102 | 0 |
| Mode M0 | |||
|---|---|---|---|
| Quadrant | BADHDUFLAG | Total packets | Discarded packets |
| A | 0 | 10222 | 3 |
| B | 0 | 12652 | 2 |
| C | 0 | 11917 | 2 |
| D | 0 | 22327 | 2 |
| Mode M9 | |||
|---|---|---|---|
| Quadrant | BADHDUFLAG | Total packets | Discarded packets |
| A | 0 | 33 | 0 |
| B | 0 | 33 | 0 |
| C | 0 | 33 | 0 |
| D | 0 | 34 | 0 |
| Quadrant | Total seconds | Saturated seconds | Saturation percentage |
|---|---|---|---|
| A | 5047 | 6 | 0.118883% |
| B | 5047 | 158 | 3.130573% |
| C | 5047 | 139 | 2.754111% |
| D | 5047 | 786 | 15.573608% |
Noise dominated data is calculated using 1-second bins in cleaned event files. If a bin has >2000 counts, and if more than 50% of those come from <1% of pixels, then it is considered to be noise-dominated and hence unusable.
| Quadrant | # 1 sec bins | Bins with >0 counts | Bins with >2000 counts | High rate bins dominated by noise | Noise dominated (total time) | Noise dominated (detector-on time) | Marked lightcurve |
|---|---|---|---|---|---|---|---|
| A | 7050 | 5048 | 0 | 0 | 0.00% | 0.00% | 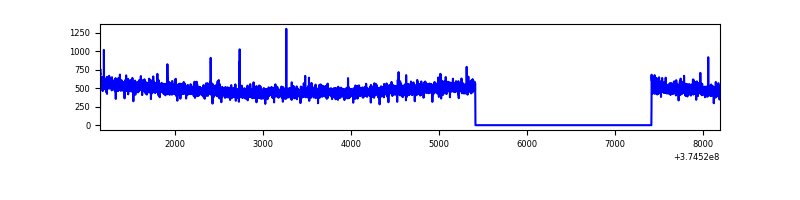 |
| B | 7050 | 5048 | 72 | 72 | 1.02% | 1.43% | 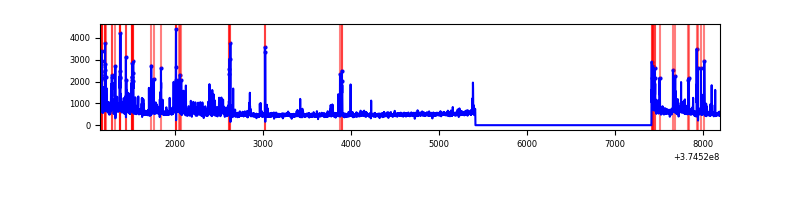 |
| C | 7050 | 5048 | 107 | 107 | 1.52% | 2.12% | 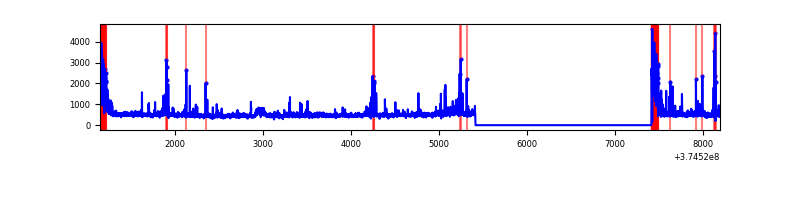 |
| D | 7050 | 5048 | 687 | 687 | 9.74% | 13.61% | 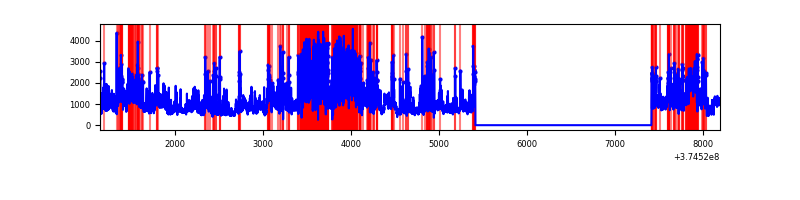 |
Top three noisy pixels from each quadrant. If the there are fewer than three noisy pixels in the level2.evt file, extra rows are filled as -1
| Pixel properties | Quadrant properties | ||||||
|---|---|---|---|---|---|---|---|
| Quadrant | DetID | PixID | Counts | Sigma | Mean | Median | Sigma |
| A | 13 | 6 | 9841 | 74.96 | 615 | 604 | 123.2 |
| A | 13 | 254 | 9759 | 74.29 | 615 | 604 | 123.2 |
| A | 14 | 235 | 9404 | 71.41 | 615 | 604 | 123.2 |
| B | 5 | 172 | 314664 | 2706.0 | 610 | 596 | 116.1 |
| B | 15 | 33 | 129594 | 1111.44 | 610 | 596 | 116.1 |
| B | 5 | 200 | 65450 | 558.78 | 610 | 596 | 116.1 |
| C | 0 | 10 | 312326 | 2326.55 | 582 | 588 | 134.0 |
| C | 7 | 221 | 202311 | 1505.49 | 582 | 588 | 134.0 |
| C | 1 | 241 | 101610 | 753.94 | 582 | 588 | 134.0 |
| D | 8 | 195 | 1474858 | 10338.0 | 551 | 540 | 142.6 |
| D | 2 | 250 | 1268391 | 8890.25 | 551 | 540 | 142.6 |
| D | 2 | 249 | 307763 | 2154.27 | 551 | 540 | 142.6 |
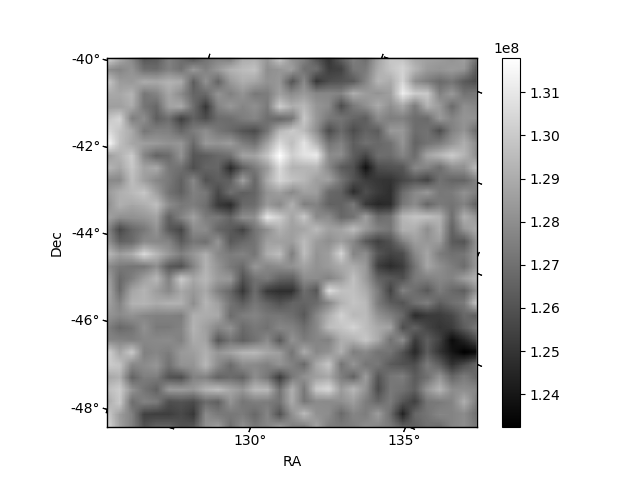
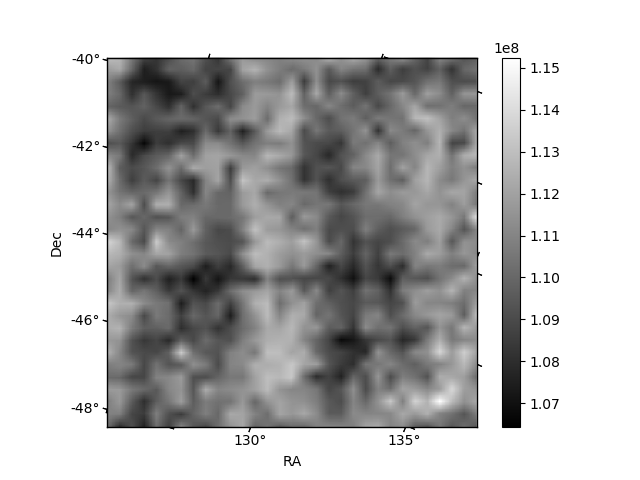
Histogram calculated using DETX and DETY for each event in the final _common_clean file
| Quadrant A | 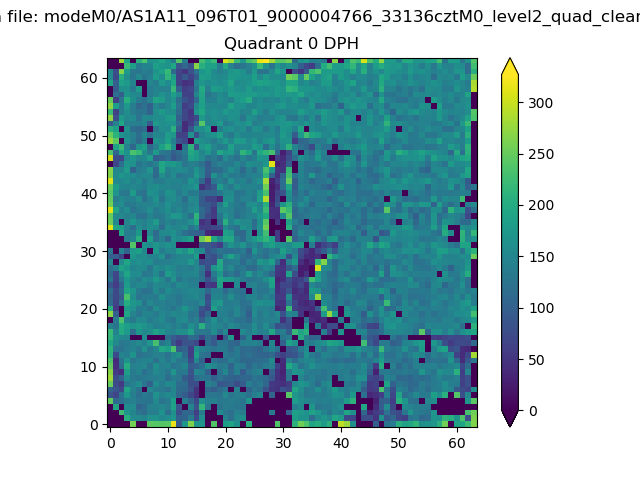 |
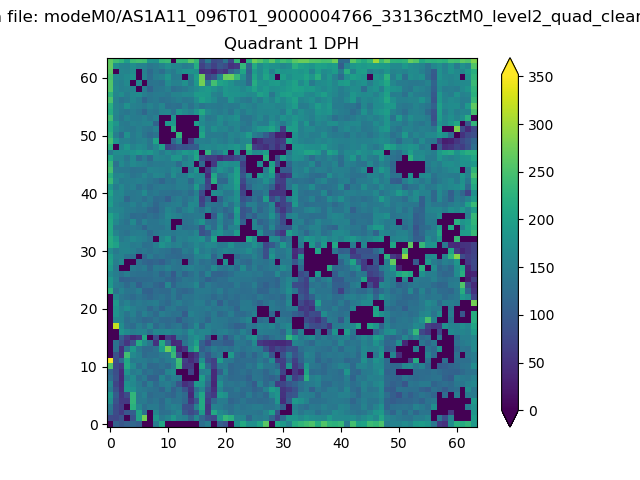 |
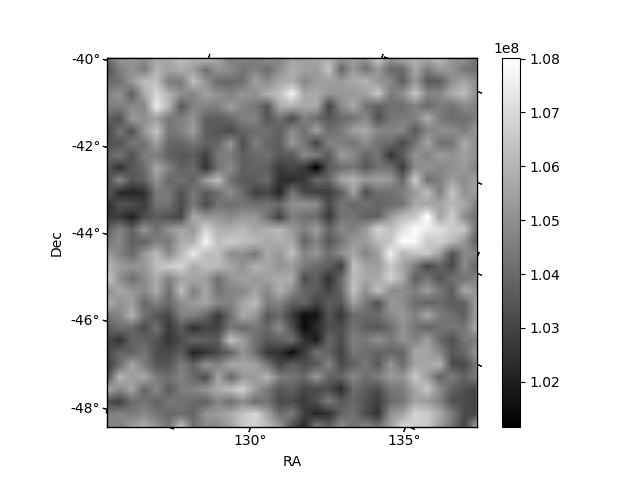
Quadrant B |
|---|---|---|---|
| Quadrant D | 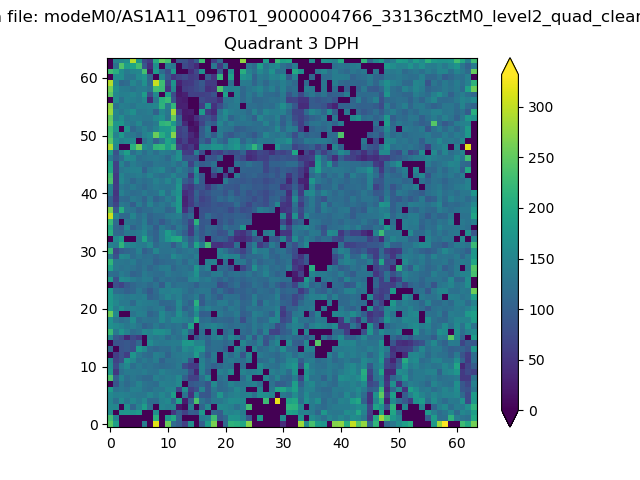 |
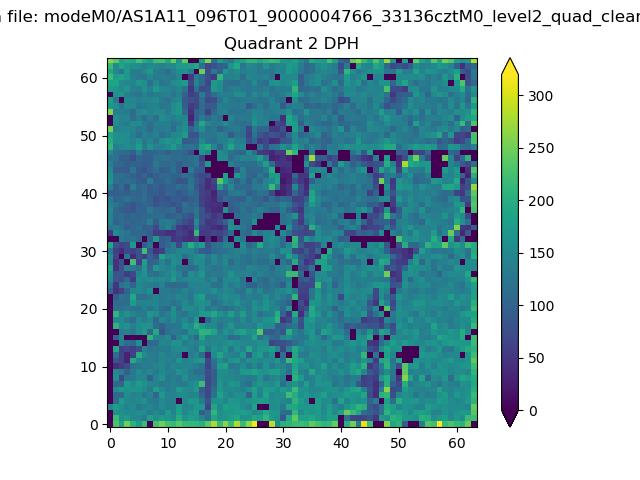 |
Quadrant C |
| Plot type | Count rate plots | Images |
|---|---|---|
| Comparison with Poisson distribution Blue bars denote a histogram of data divided into 1 sec bins. Red curve is a Poisson curve with rate = median count rate of data. |
 |
 |
| Quadrant-wise count rates Data is divided into 100 sec bins |
 |
|
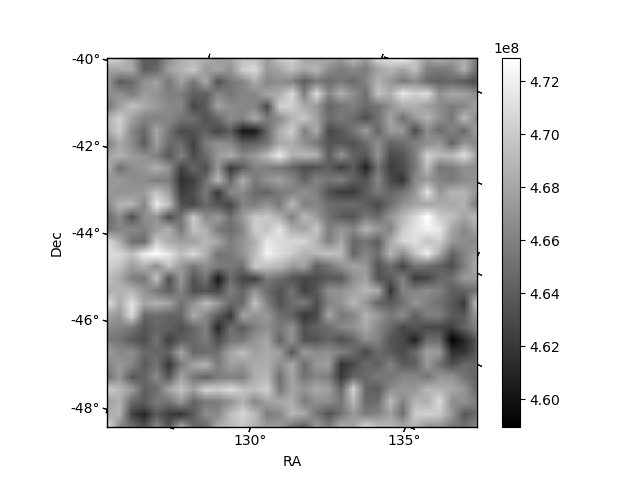
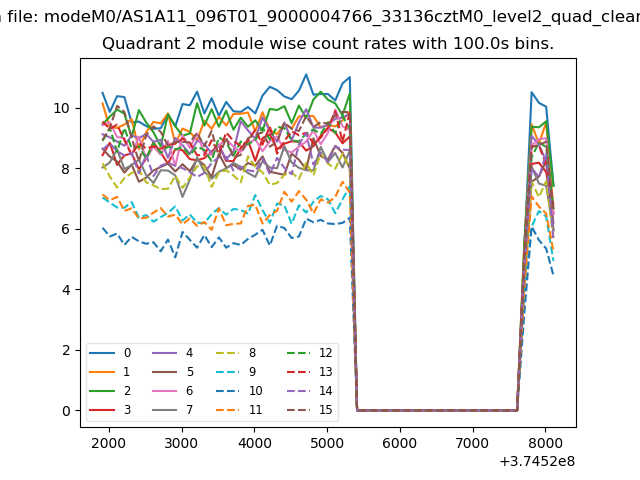
| Module-wise count rates for Quadrant A Data is divided into 100 sec bins |
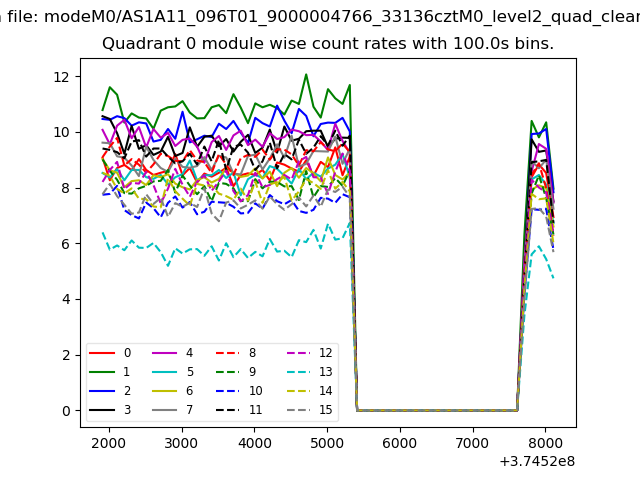 |
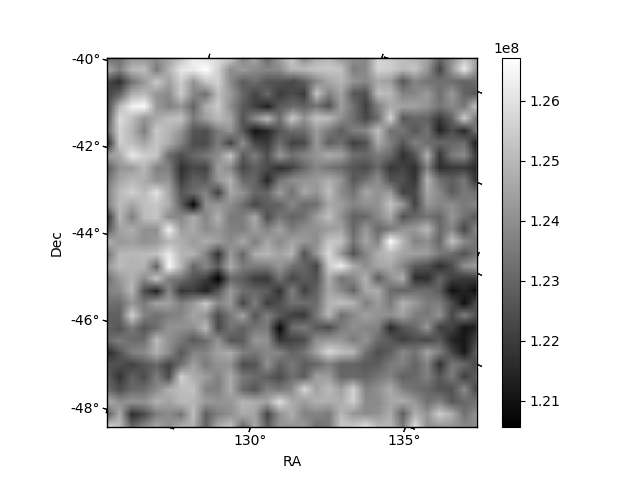 |
| Module-wise count rates for Quadrant B Data is divided into 100 sec bins |
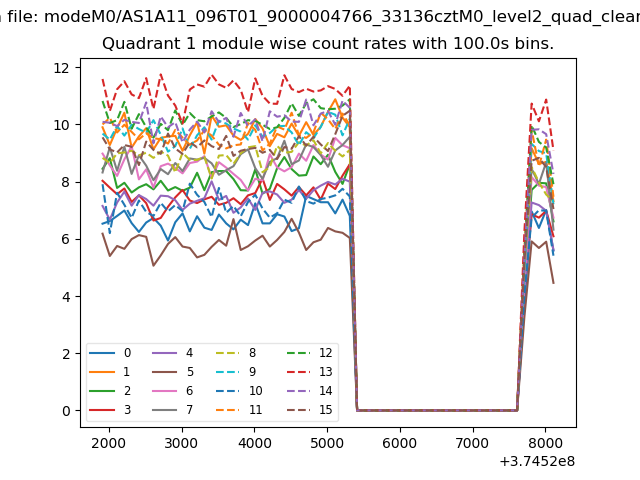 |
 |
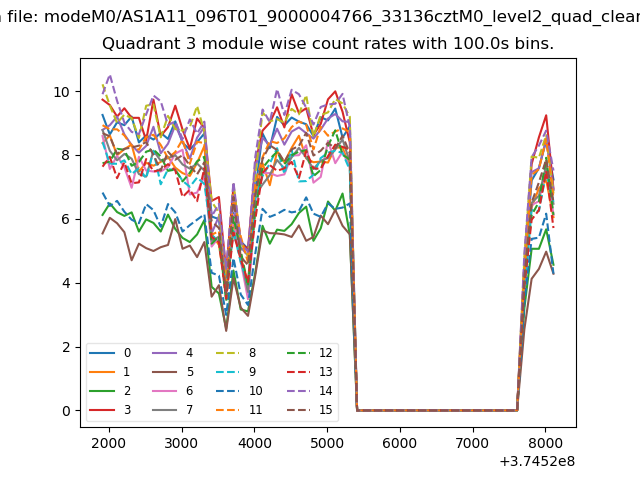
| Module-wise count rates for Quadrant C Data is divided into 100 sec bins |
 |
 |
| Module-wise count rates for Quadrant D Data is divided into 100 sec bins |
 |
 |
| Parameter | Plot |
|---|---|
| CZT HV Monitor | 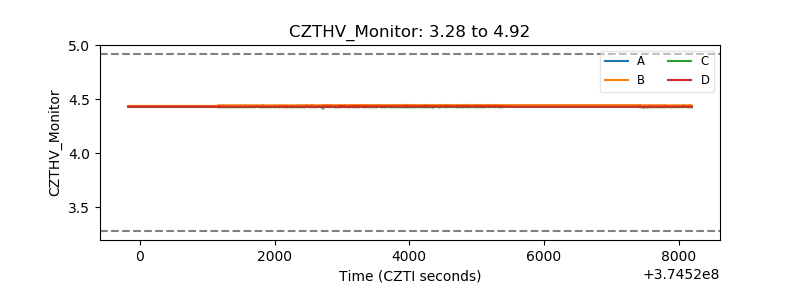 |
| D_VDD | 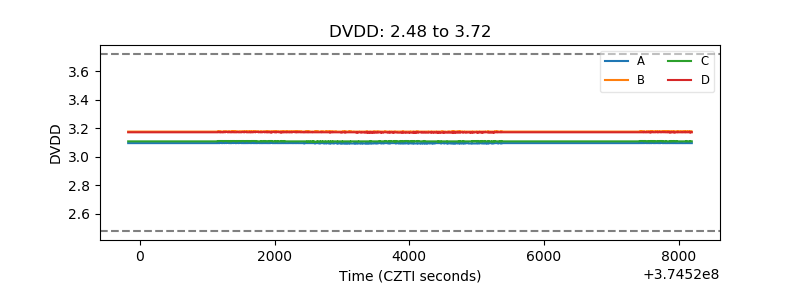 |
| Temperature 1 | 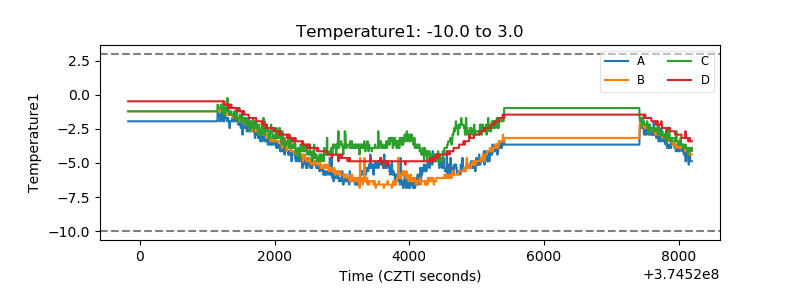 |
| Veto HV Monitor | 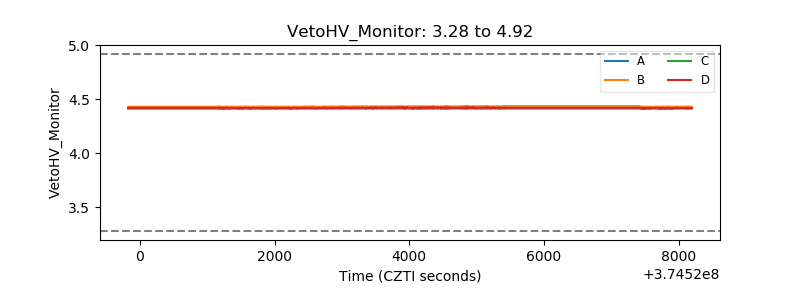 |
| Veto LLD | 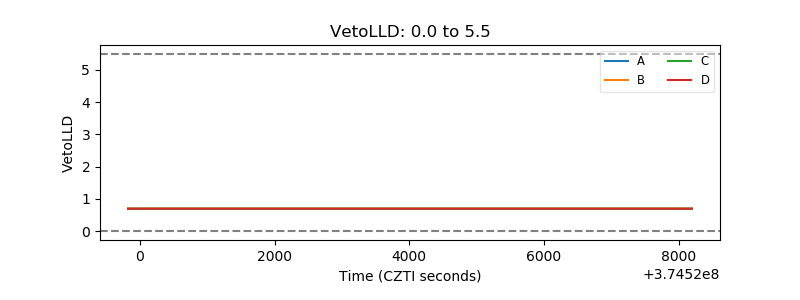 |
| Alpha Counter |  |
| _CPM_Rate |  |
| CZT Counter | 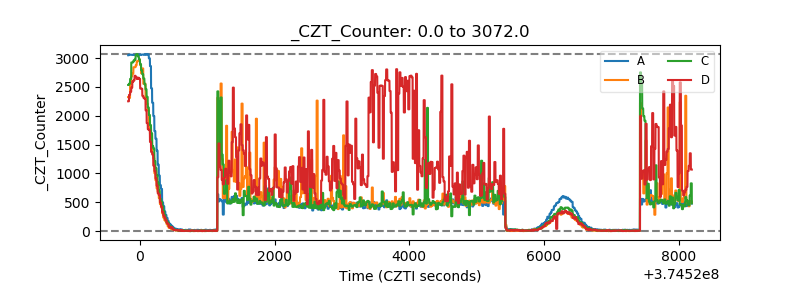 |
| +2.5 Volts monitor |  |
| +5 Volts monitor |  |
| _ROLL_ROT | 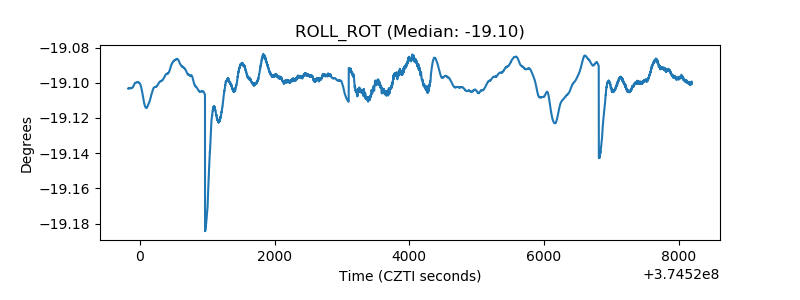 |
| _Roll_DEC | 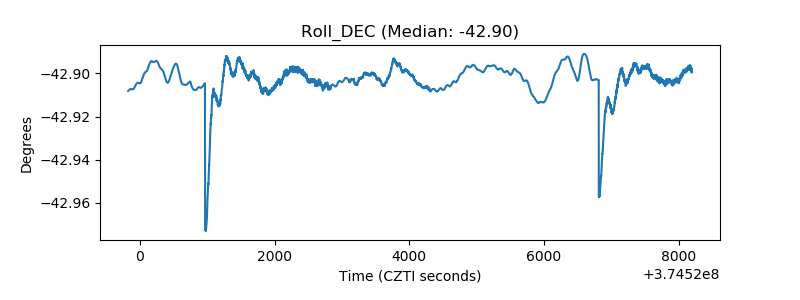 |
| _Roll_RA | 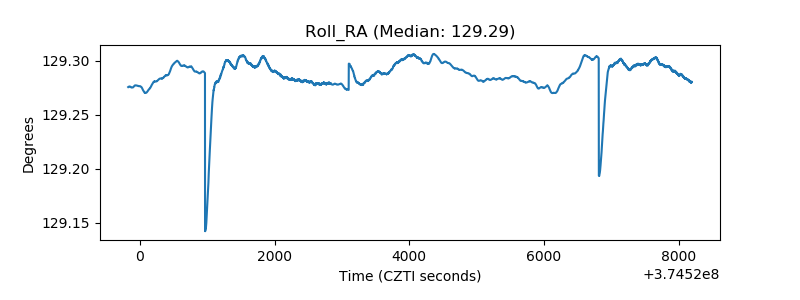 |
| Veto Counter | 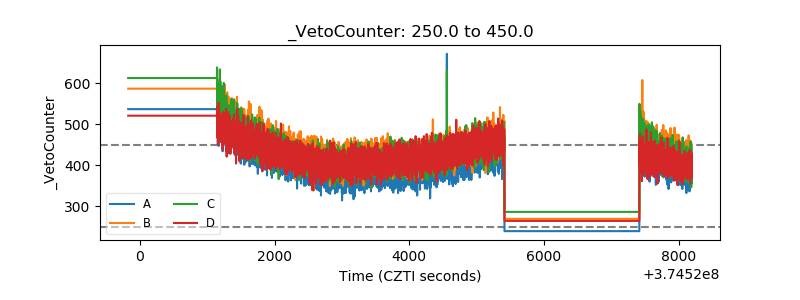 |