| Param | Original file | Final file |
|---|---|---|
| Filename | modeM0/AS1A11_096T01_9000004766_33139cztM0_level2.evt | modeM0/AS1A11_096T01_9000004766_33139cztM0_level2_quad_clean.evt |
| Size (bytes) | 560,059,200 | 81,354,240 |
| Size | 534.1 MB | 77.6 MB |
| Events in quadrant A | 2,806,884 | 523,905 |
| Events in quadrant B | 4,600,017 | 521,876 |
| Events in quadrant C | 3,384,394 | 511,430 |
| Events in quadrant D | 5,756,620 | 480,073 |
| Mode SS | |||
|---|---|---|---|
| Quadrant | BADHDUFLAG | Total packets | Discarded packets |
| A | 0 | 126 | 0 |
| B | 0 | 126 | 0 |
| C | 0 | 126 | 0 |
| D | 0 | 126 | 0 |
| Mode M0 | |||
|---|---|---|---|
| Quadrant | BADHDUFLAG | Total packets | Discarded packets |
| A | 0 | 12449 | 3 |
| B | 0 | 17702 | 2 |
| C | 0 | 14029 | 2 |
| D | 0 | 21374 | 2 |
| Mode M9 | |||
|---|---|---|---|
| Quadrant | BADHDUFLAG | Total packets | Discarded packets |
| A | 0 | 27 | 0 |
| B | 0 | 27 | 0 |
| C | 0 | 27 | 0 |
| D | 0 | 27 | 0 |
| Quadrant | Total seconds | Saturated seconds | Saturation percentage |
|---|---|---|---|
| A | 6104 | 9 | 0.147444% |
| B | 6104 | 595 | 9.747706% |
| C | 6104 | 118 | 1.933159% |
| D | 6104 | 492 | 8.060288% |
Noise dominated data is calculated using 1-second bins in cleaned event files. If a bin has >2000 counts, and if more than 50% of those come from <1% of pixels, then it is considered to be noise-dominated and hence unusable.
| Quadrant | # 1 sec bins | Bins with >0 counts | Bins with >2000 counts | High rate bins dominated by noise | Noise dominated (total time) | Noise dominated (detector-on time) | Marked lightcurve |
|---|---|---|---|---|---|---|---|
| A | 8817 | 6106 | 0 | 0 | 0.00% | 0.00% | 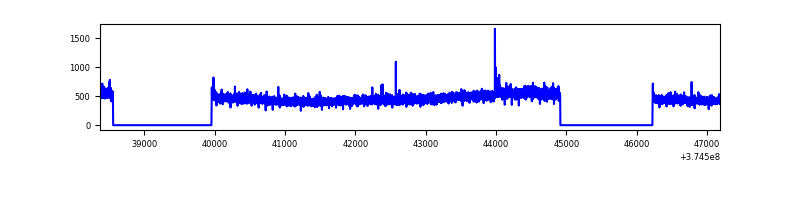 |
| B | 8817 | 6106 | 255 | 255 | 2.89% | 4.18% | 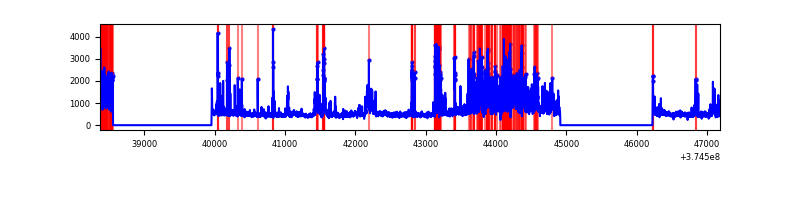 |
| C | 8817 | 6106 | 82 | 82 | 0.93% | 1.34% | 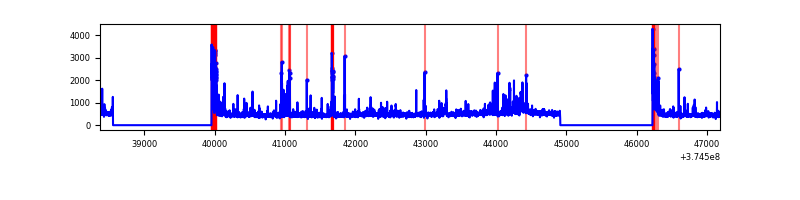 |
| D | 8817 | 6106 | 347 | 347 | 3.94% | 5.68% | 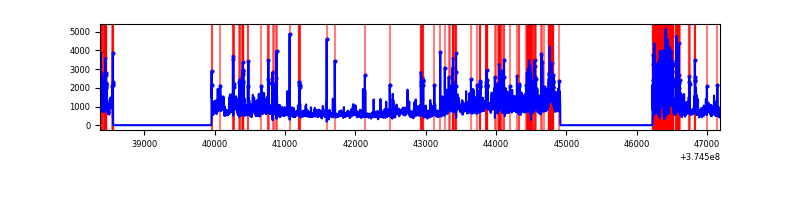 |
Top three noisy pixels from each quadrant. If the there are fewer than three noisy pixels in the level2.evt file, extra rows are filled as -1
| Pixel properties | Quadrant properties | ||||||
|---|---|---|---|---|---|---|---|
| Quadrant | DetID | PixID | Counts | Sigma | Mean | Median | Sigma |
| A | 14 | 235 | 19673 | 130.6 | 717 | 698 | 145.3 |
| A | 13 | 6 | 11251 | 72.63 | 717 | 698 | 145.3 |
| A | 13 | 254 | 10701 | 68.85 | 717 | 698 | 145.3 |
| B | 5 | 172 | 1015230 | 7665.69 | 693 | 677 | 132.3 |
| B | 0 | 219 | 490394 | 3700.17 | 693 | 677 | 132.3 |
| B | 0 | 189 | 203477 | 1532.3 | 693 | 677 | 132.3 |
| C | 7 | 221 | 315198 | 1957.78 | 694 | 701 | 160.6 |
| C | 0 | 10 | 186054 | 1153.84 | 694 | 701 | 160.6 |
| C | 9 | 187 | 106568 | 659.03 | 694 | 701 | 160.6 |
| D | 8 | 195 | 1164850 | 6878.32 | 673 | 656 | 169.3 |
| D | 2 | 250 | 820620 | 4844.53 | 673 | 656 | 169.3 |
| D | 1 | 47 | 266856 | 1572.77 | 673 | 656 | 169.3 |
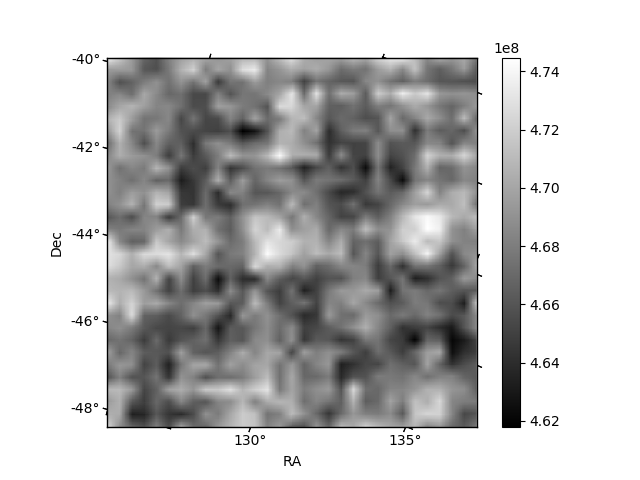
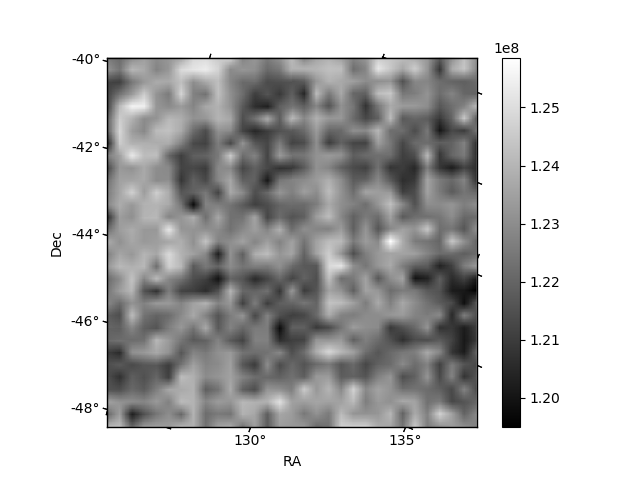
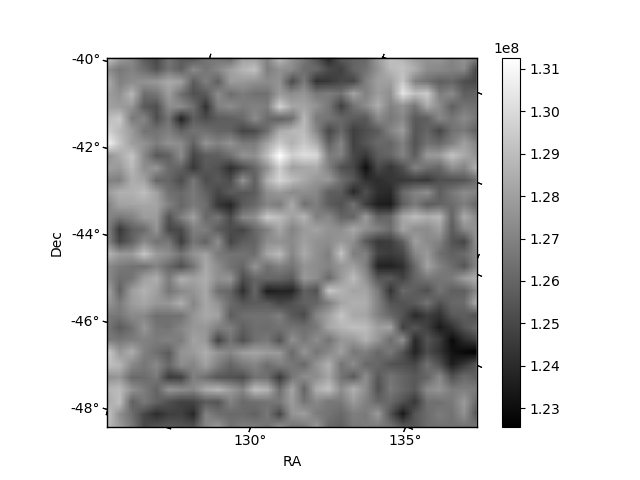
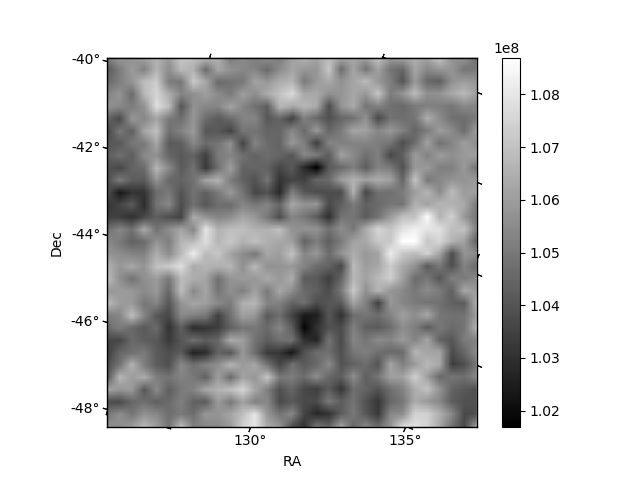
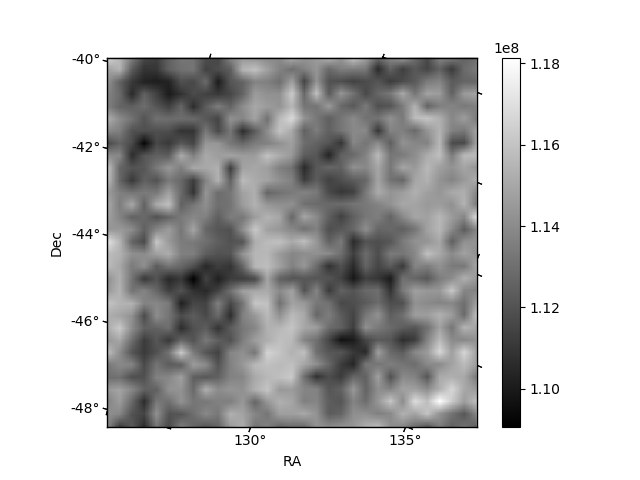
Histogram calculated using DETX and DETY for each event in the final _common_clean file
| Quadrant A | 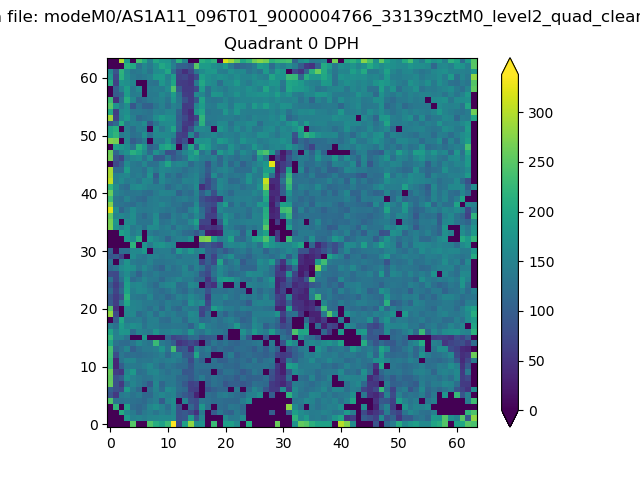 |
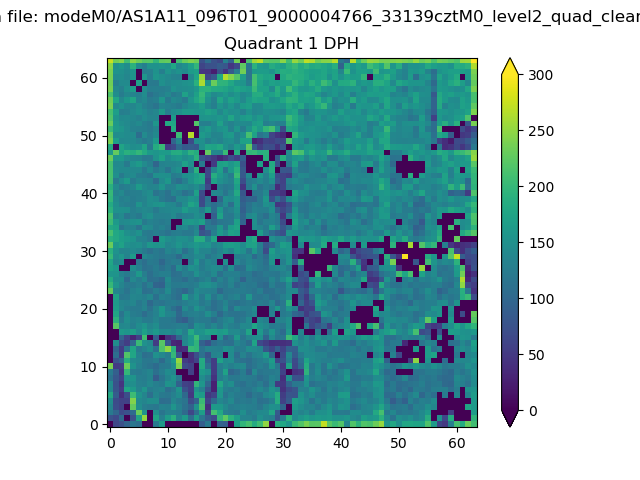 |
Quadrant B |
|---|---|---|---|
| Quadrant D | 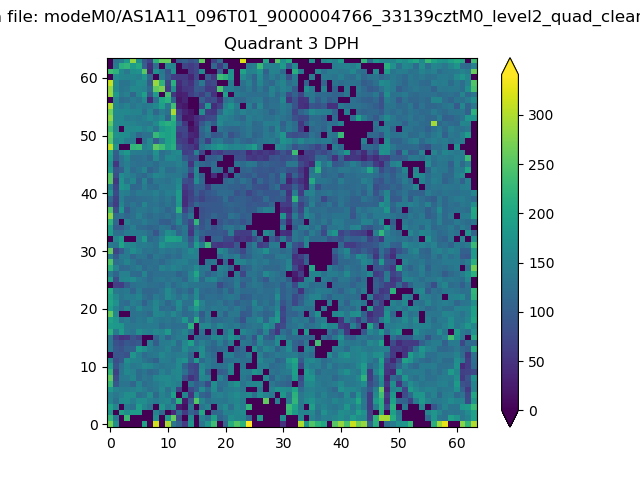 |
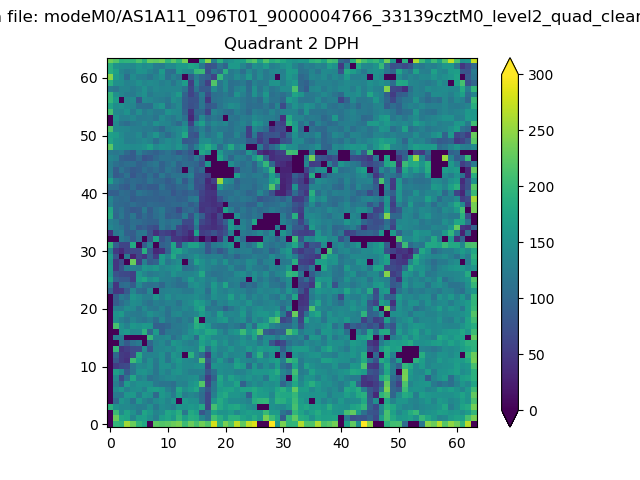 |
Quadrant C |
| Plot type | Count rate plots | Images |
|---|---|---|
| Comparison with Poisson distribution Blue bars denote a histogram of data divided into 1 sec bins. Red curve is a Poisson curve with rate = median count rate of data. |
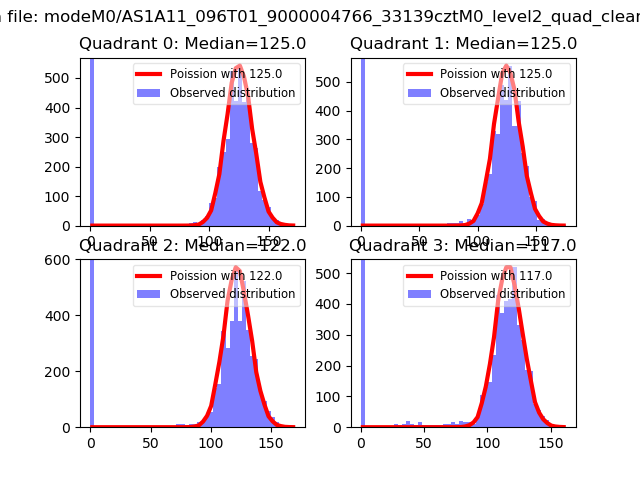 |
 |
| Quadrant-wise count rates Data is divided into 100 sec bins |
 |
|
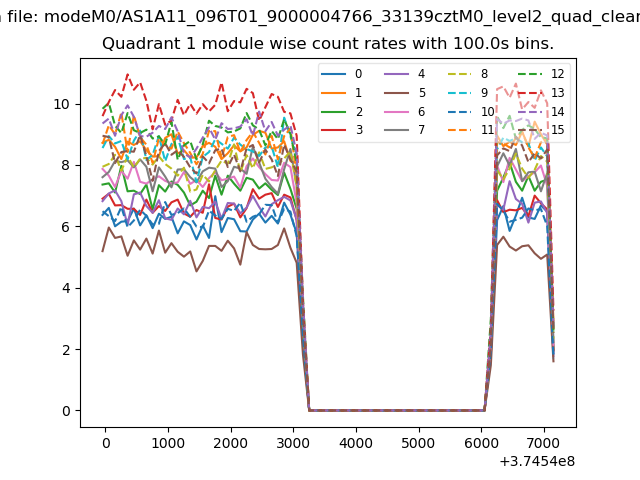
| Module-wise count rates for Quadrant A Data is divided into 100 sec bins |
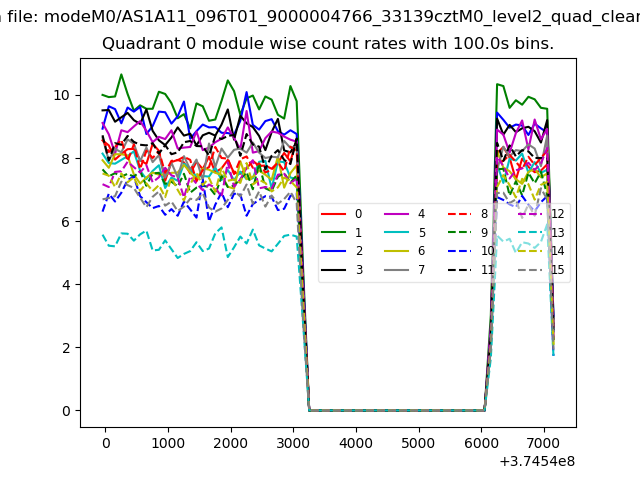 |
 |
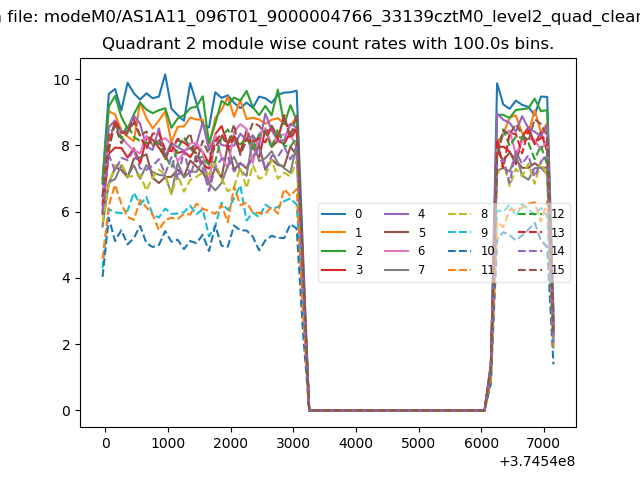
| Module-wise count rates for Quadrant B Data is divided into 100 sec bins |
 |
 |
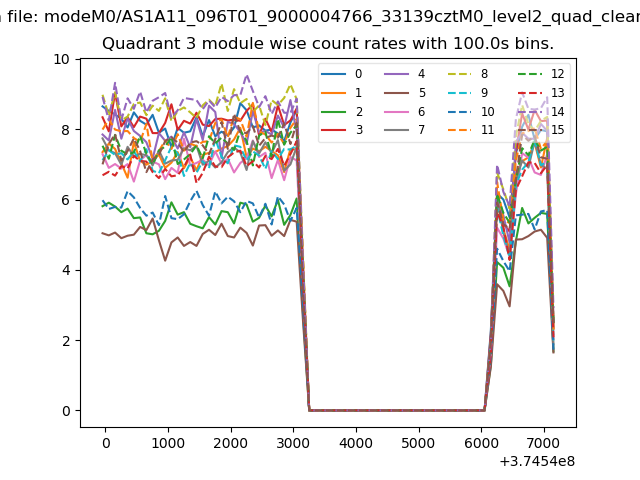
| Module-wise count rates for Quadrant C Data is divided into 100 sec bins |
 |
 |
| Module-wise count rates for Quadrant D Data is divided into 100 sec bins |
 |
 |
| Parameter | Plot |
|---|---|
| CZT HV Monitor |  |
| D_VDD | 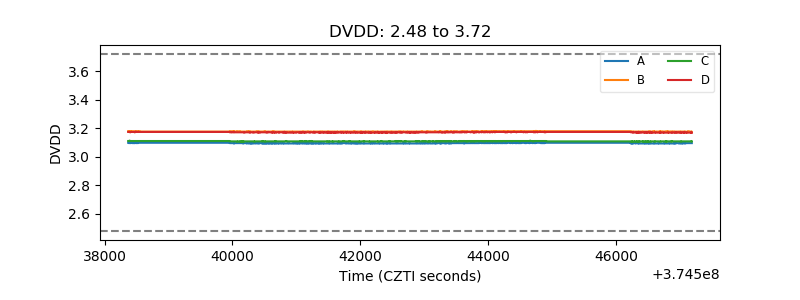 |
| Temperature 1 | 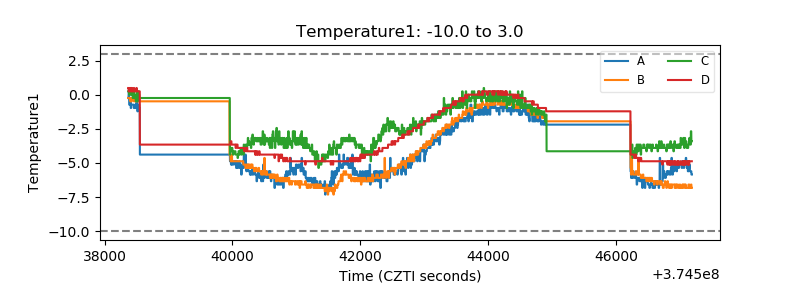 |
| Veto HV Monitor | 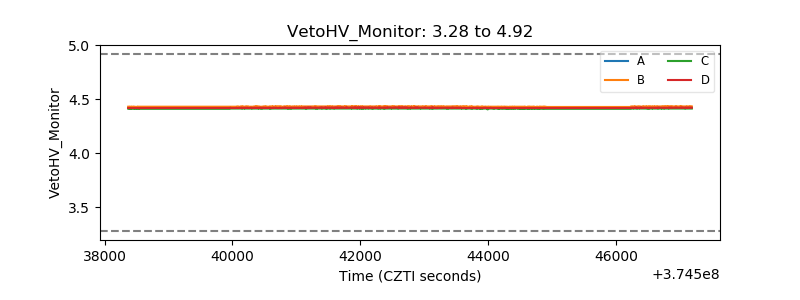 |
| Veto LLD | 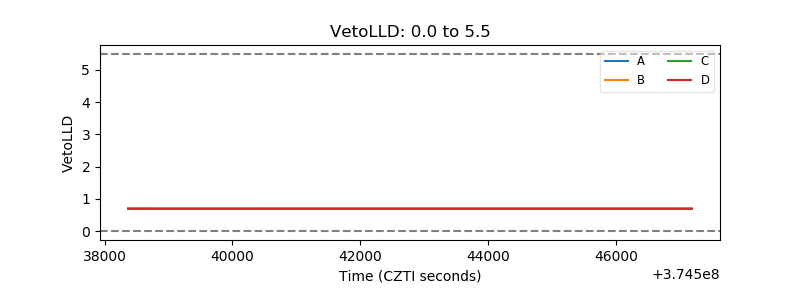 |
| Alpha Counter |  |
| _CPM_Rate | 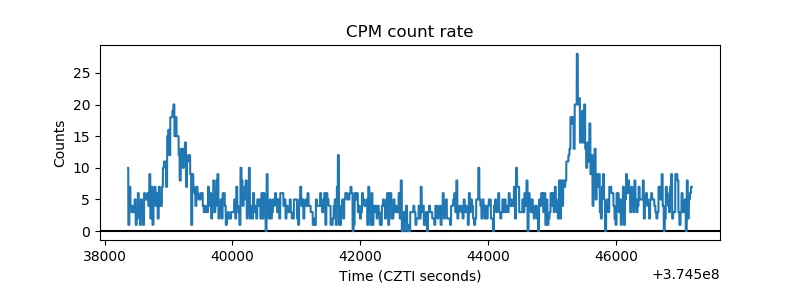 |
| CZT Counter | 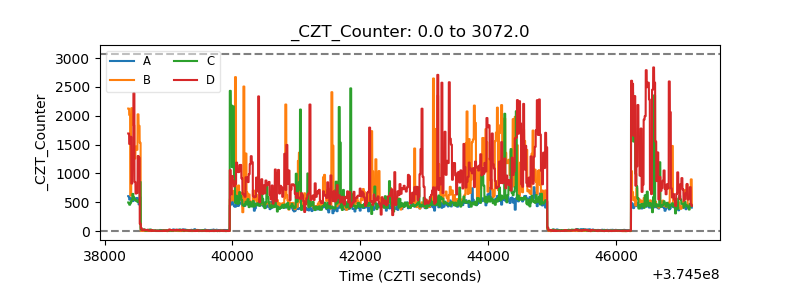 |
| +2.5 Volts monitor | 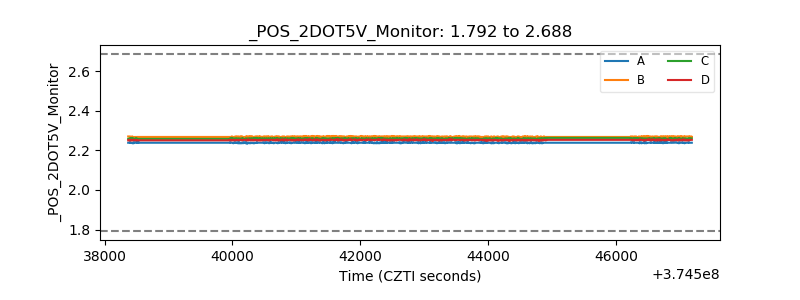 |
| +5 Volts monitor |  |
| _ROLL_ROT |  |
| _Roll_DEC | 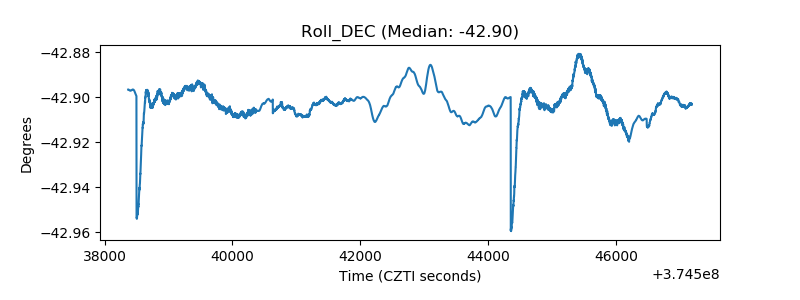 |
| _Roll_RA | 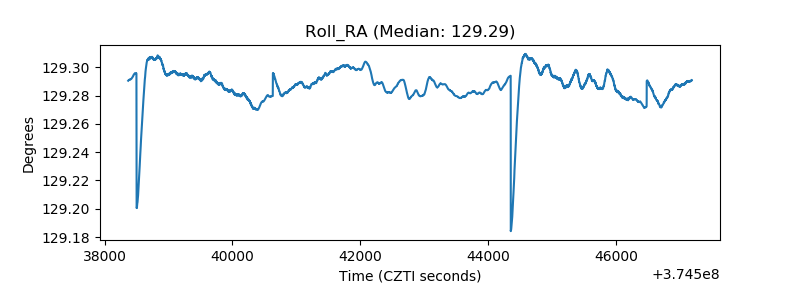 |
| Veto Counter | 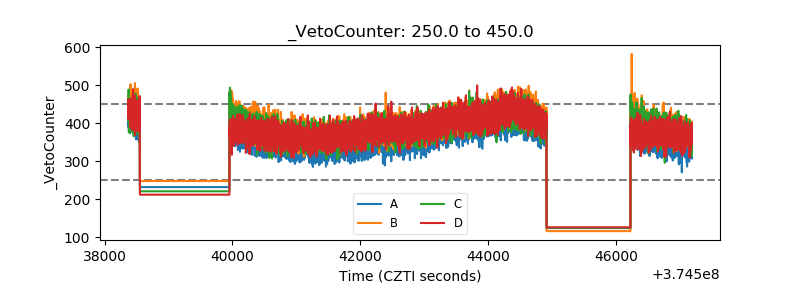 |