| Param | Original file | Final file |
|---|---|---|
| Filename | modeM0/AS1A11_096T01_9000004766_33145cztM0_level2.evt | modeM0/AS1A11_096T01_9000004766_33145cztM0_level2_quad_clean.evt |
| Size (bytes) | 2,157,480,000 | 272,770,560 |
| Size | 2.0 GB | 260.1 MB |
| Events in quadrant A | 11,102,762 | 1,701,186 |
| Events in quadrant B | 16,235,679 | 1,703,446 |
| Events in quadrant C | 14,022,728 | 1,660,695 |
| Events in quadrant D | 22,368,517 | 1,549,567 |
| Mode SS | |||
|---|---|---|---|
| Quadrant | BADHDUFLAG | Total packets | Discarded packets |
| A | 0 | 492 | 0 |
| B | 0 | 492 | 2 |
| C | 0 | 492 | 2 |
| D | 0 | 492 | 4 |
| Mode M0 | |||
|---|---|---|---|
| Quadrant | BADHDUFLAG | Total packets | Discarded packets |
| A | 0 | 48515 | 174 |
| B | 0 | 63955 | 316 |
| C | 0 | 57028 | 183 |
| D | 0 | 83557 | 402 |
| Mode M9 | |||
|---|---|---|---|
| Quadrant | BADHDUFLAG | Total packets | Discarded packets |
| A | 0 | 80 | 0 |
| B | 0 | 79 | 0 |
| C | 0 | 79 | 0 |
| D | 0 | 79 | 0 |
| Quadrant | Total seconds | Saturated seconds | Saturation percentage |
|---|---|---|---|
| A | 23929 | 27 | 0.112834% |
| B | 23922 | 1403 | 5.864894% |
| C | 23928 | 575 | 2.403042% |
| D | 23923 | 1661 | 6.943109% |
Noise dominated data is calculated using 1-second bins in cleaned event files. If a bin has >2000 counts, and if more than 50% of those come from <1% of pixels, then it is considered to be noise-dominated and hence unusable.
| Quadrant | # 1 sec bins | Bins with >0 counts | Bins with >2000 counts | High rate bins dominated by noise | Noise dominated (total time) | Noise dominated (detector-on time) | Marked lightcurve |
|---|---|---|---|---|---|---|---|
| A | 31115 | 23955 | 1 | 1 | 0.00% | 0.00% | 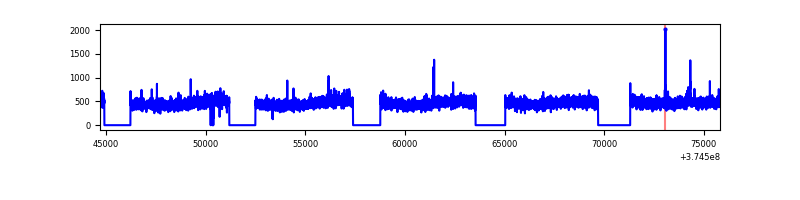 |
| B | 31115 | 23938 | 652 | 652 | 2.10% | 2.72% | 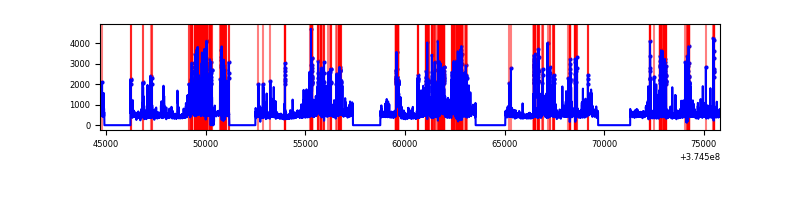 |
| C | 31115 | 23945 | 450 | 450 | 1.45% | 1.88% | 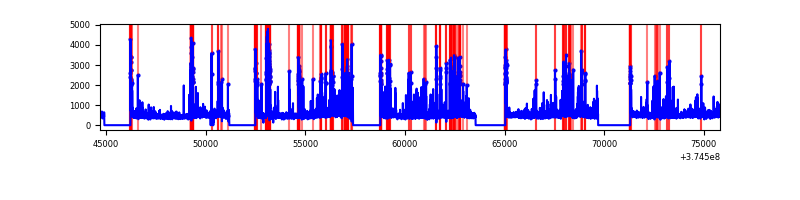 |
| D | 31115 | 23941 | 1206 | 1206 | 3.88% | 5.04% | 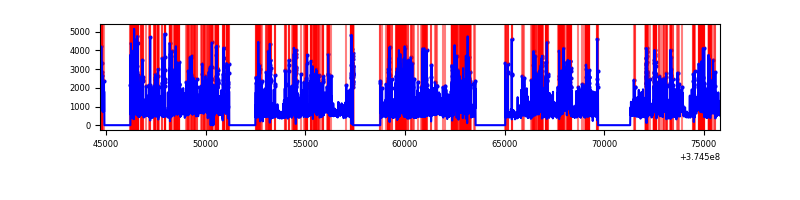 |
Top three noisy pixels from each quadrant. If the there are fewer than three noisy pixels in the level2.evt file, extra rows are filled as -1
| Pixel properties | Quadrant properties | ||||||
|---|---|---|---|---|---|---|---|
| Quadrant | DetID | PixID | Counts | Sigma | Mean | Median | Sigma |
| A | 13 | 254 | 44633 | 74.07 | 2844 | 2791 | 564.9 |
| A | 15 | 169 | 41621 | 68.74 | 2844 | 2791 | 564.9 |
| A | 13 | 6 | 36321 | 59.36 | 2844 | 2791 | 564.9 |
| B | 5 | 172 | 2465455 | 4689.2 | 2776 | 2705 | 525.2 |
| B | 0 | 219 | 2028654 | 3857.51 | 2776 | 2705 | 525.2 |
| B | 0 | 189 | 232712 | 437.94 | 2776 | 2705 | 525.2 |
| C | 7 | 221 | 1507326 | 2400.52 | 2736 | 2756 | 626.8 |
| C | 1 | 241 | 1023360 | 1628.36 | 2736 | 2756 | 626.8 |
| C | 0 | 10 | 513095 | 814.24 | 2736 | 2756 | 626.8 |
| D | 8 | 195 | 4773368 | 7052.1 | 2689 | 2625 | 676.5 |
| D | 2 | 250 | 3601698 | 5320.14 | 2689 | 2625 | 676.5 |
| D | 2 | 120 | 613326 | 902.74 | 2689 | 2625 | 676.5 |
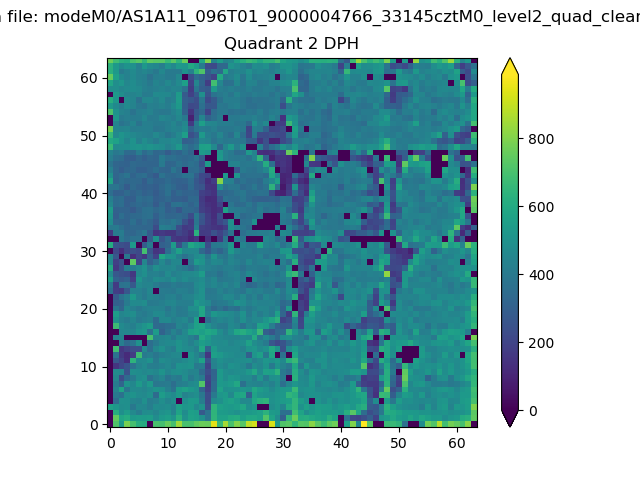
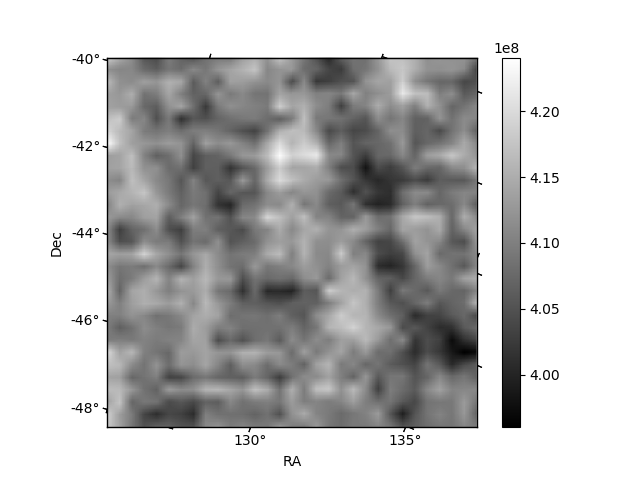
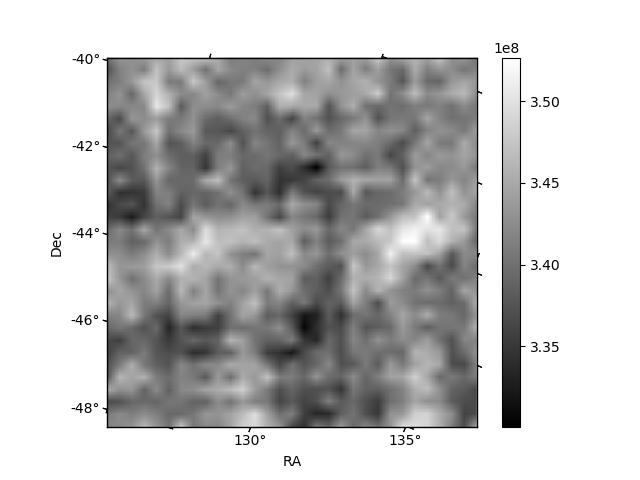
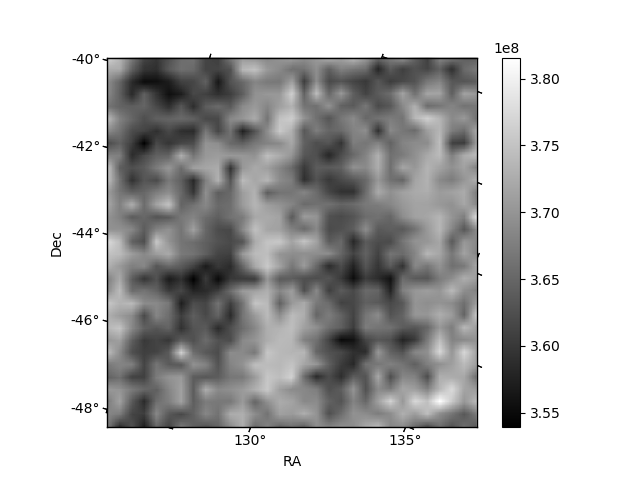
Histogram calculated using DETX and DETY for each event in the final _common_clean file
| Quadrant A | 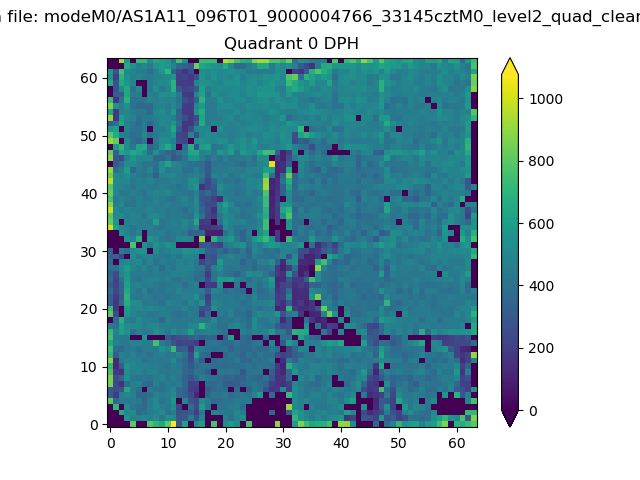 |
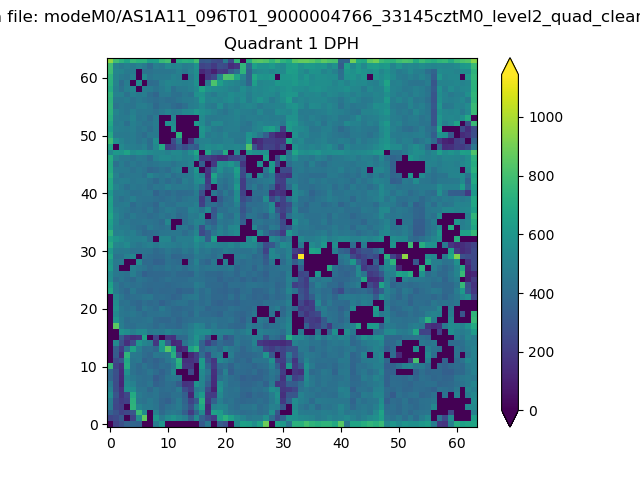 |
Quadrant B |
|---|---|---|---|
| Quadrant D | 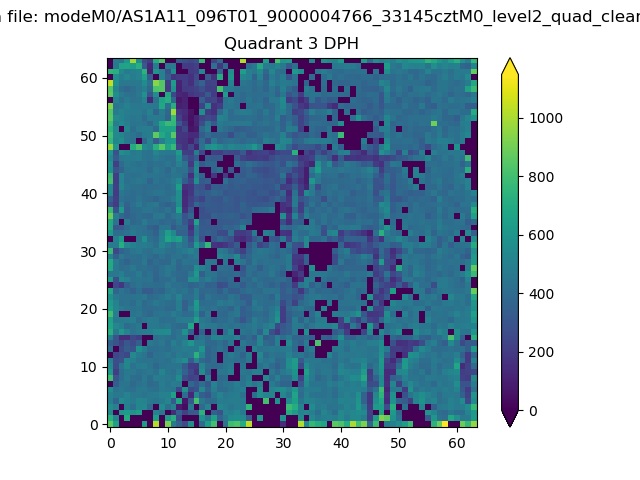 |
 |
Quadrant C |
| Plot type | Count rate plots | Images |
|---|---|---|
| Comparison with Poisson distribution Blue bars denote a histogram of data divided into 1 sec bins. Red curve is a Poisson curve with rate = median count rate of data. |
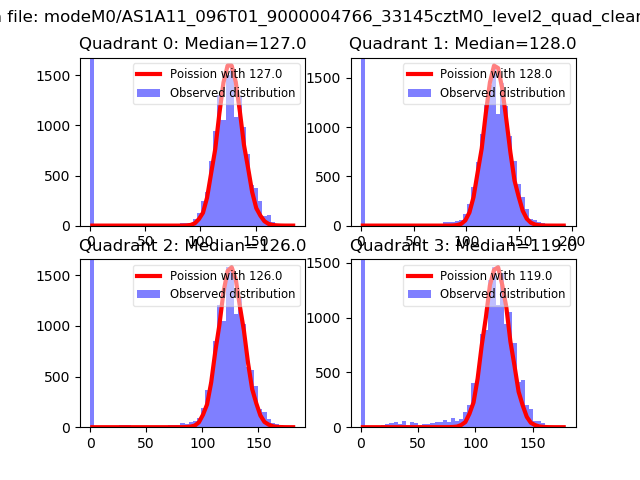 |
 |
| Quadrant-wise count rates Data is divided into 100 sec bins |
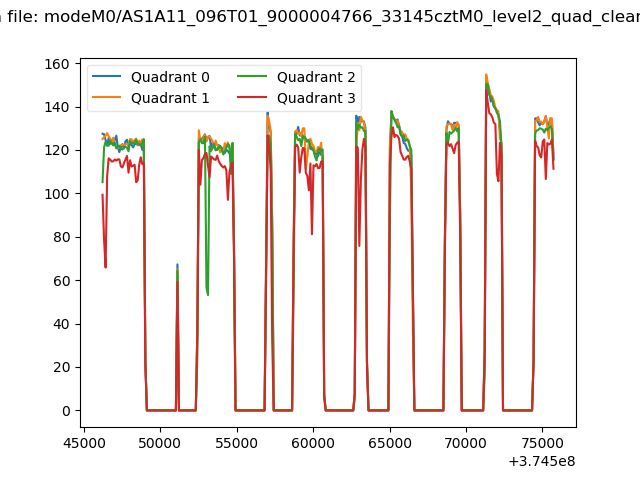 |
|
| Module-wise count rates for Quadrant A Data is divided into 100 sec bins |
 |
 |
| Module-wise count rates for Quadrant B Data is divided into 100 sec bins |
 |
 |
| Module-wise count rates for Quadrant C Data is divided into 100 sec bins |
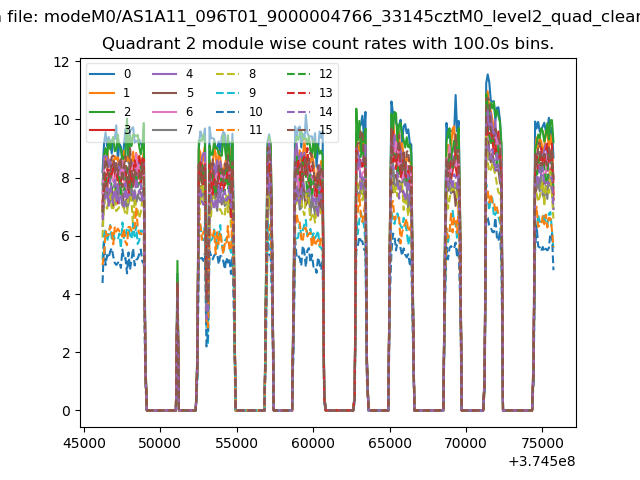 |
 |
| Module-wise count rates for Quadrant D Data is divided into 100 sec bins |
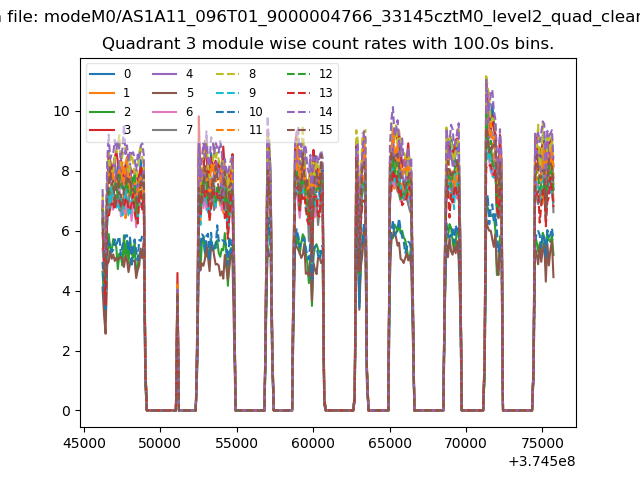 |
 |
| Parameter | Plot |
|---|---|
| CZT HV Monitor |  |
| D_VDD | 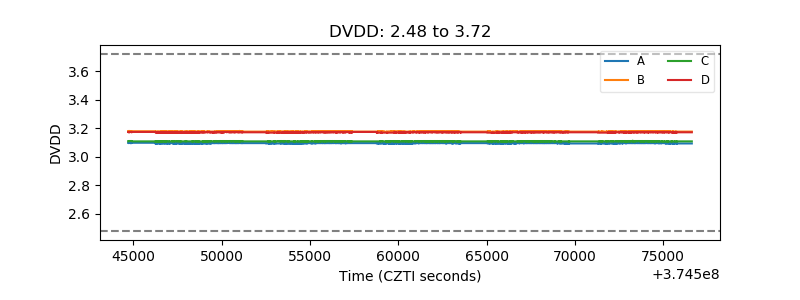 |
| Temperature 1 | 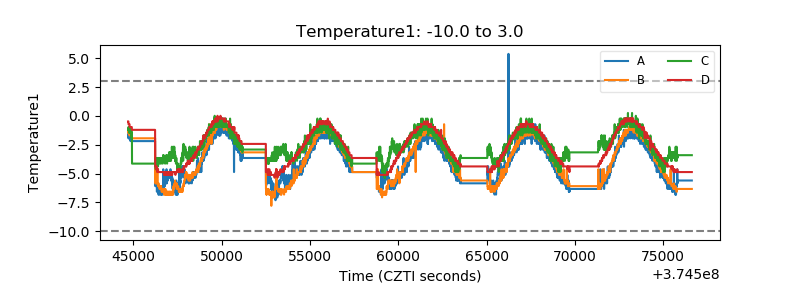 |
| Veto HV Monitor |  |
| Veto LLD |  |
| Alpha Counter | 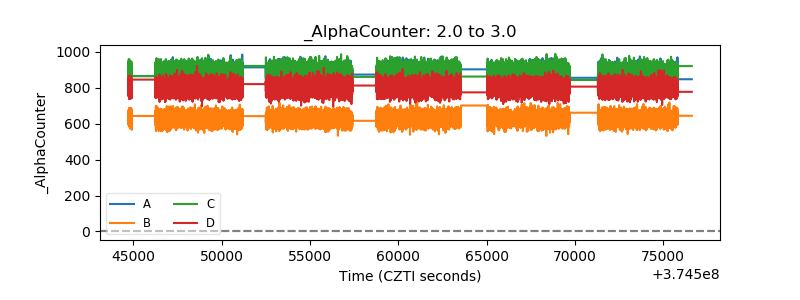 |
| _CPM_Rate | 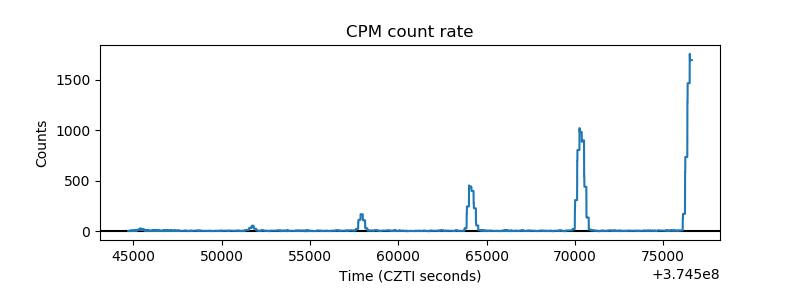 |
| CZT Counter | 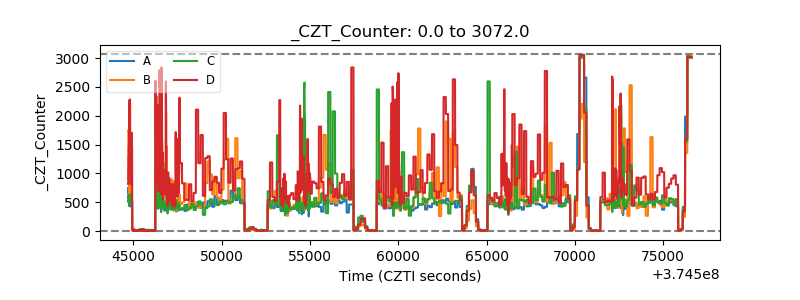 |
| +2.5 Volts monitor | 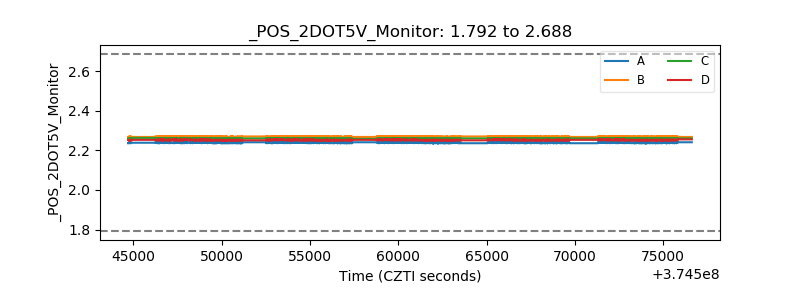 |
| +5 Volts monitor |  |
| _ROLL_ROT | 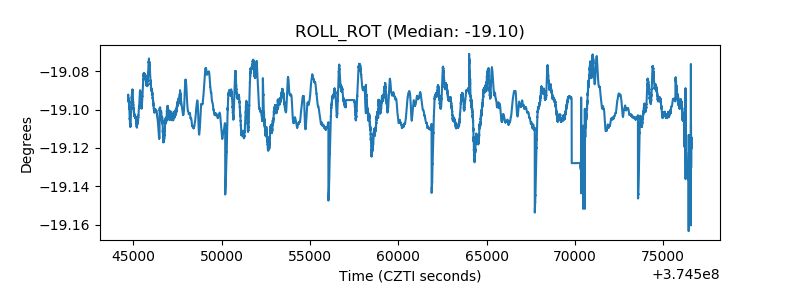 |
| _Roll_DEC | 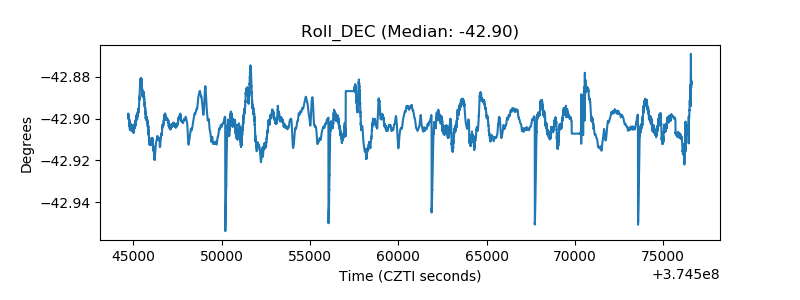 |
| _Roll_RA | 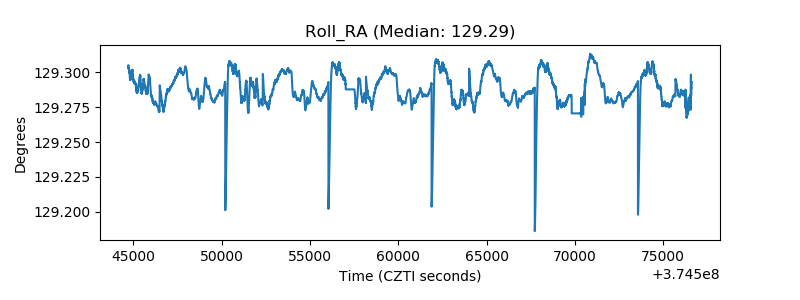 |
| Veto Counter |  |