| Param | Original file | Final file |
|---|---|---|
| Filename | modeM0/AS1A11_096T01_9000004766_33146cztM0_level2.evt | modeM0/AS1A11_096T01_9000004766_33146cztM0_level2_quad_clean.evt |
| Size (bytes) | 592,346,880 | 64,503,360 |
| Size | 564.9 MB | 61.5 MB |
| Events in quadrant A | 2,952,254 | 404,421 |
| Events in quadrant B | 4,173,330 | 403,999 |
| Events in quadrant C | 3,715,123 | 387,444 |
| Events in quadrant D | 6,714,021 | 359,510 |
| Mode SS | |||
|---|---|---|---|
| Quadrant | BADHDUFLAG | Total packets | Discarded packets |
| A | 0 | 116 | 0 |
| B | 0 | 116 | 0 |
| C | 0 | 116 | 0 |
| D | 0 | 116 | 0 |
| Mode M0 | |||
|---|---|---|---|
| Quadrant | BADHDUFLAG | Total packets | Discarded packets |
| A | 0 | 12056 | 3 |
| B | 0 | 15945 | 2 |
| C | 0 | 14465 | 2 |
| D | 0 | 24082 | 2 |
| Mode M9 | |||
|---|---|---|---|
| Quadrant | BADHDUFLAG | Total packets | Discarded packets |
| A | 0 | 37 | 0 |
| B | 0 | 37 | 0 |
| C | 0 | 37 | 0 |
| D | 0 | 37 | 0 |
| Quadrant | Total seconds | Saturated seconds | Saturation percentage |
|---|---|---|---|
| A | 5690 | 13 | 0.228471% |
| B | 5690 | 354 | 6.221441% |
| C | 5690 | 160 | 2.811951% |
| D | 5690 | 987 | 17.346221% |
Noise dominated data is calculated using 1-second bins in cleaned event files. If a bin has >2000 counts, and if more than 50% of those come from <1% of pixels, then it is considered to be noise-dominated and hence unusable.
| Quadrant | # 1 sec bins | Bins with >0 counts | Bins with >2000 counts | High rate bins dominated by noise | Noise dominated (total time) | Noise dominated (detector-on time) | Marked lightcurve |
|---|---|---|---|---|---|---|---|
| A | 9337 | 5692 | 1 | 1 | 0.01% | 0.02% | 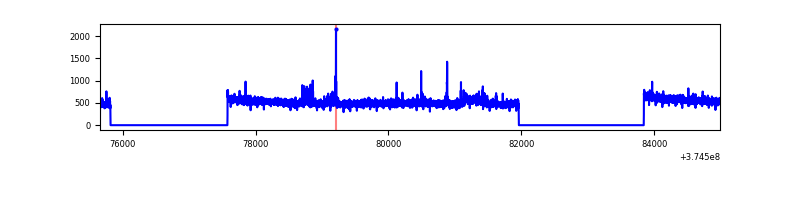 |
| B | 9337 | 5692 | 193 | 193 | 2.07% | 3.39% | 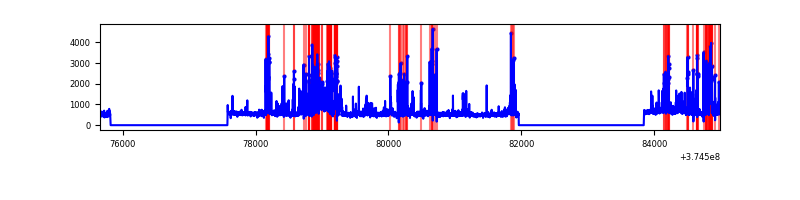 |
| C | 9337 | 5692 | 137 | 137 | 1.47% | 2.41% | 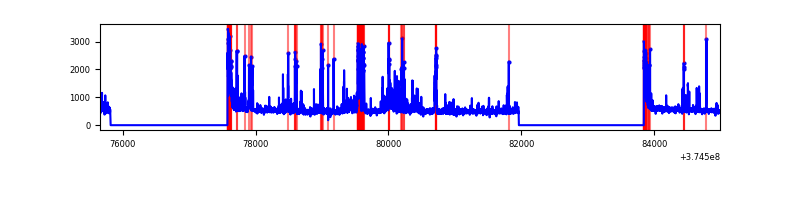 |
| D | 9337 | 5692 | 767 | 767 | 8.21% | 13.48% | 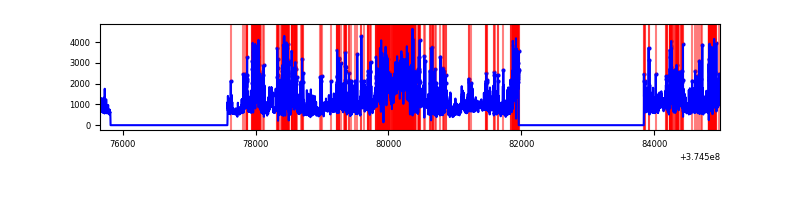 |
Top three noisy pixels from each quadrant. If the there are fewer than three noisy pixels in the level2.evt file, extra rows are filled as -1
| Pixel properties | Quadrant properties | ||||||
|---|---|---|---|---|---|---|---|
| Quadrant | DetID | PixID | Counts | Sigma | Mean | Median | Sigma |
| A | 0 | 47 | 44711 | 302.94 | 741 | 730 | 145.2 |
| A | 0 | 31 | 21331 | 141.9 | 741 | 730 | 145.2 |
| A | 13 | 254 | 10427 | 66.79 | 741 | 730 | 145.2 |
| B | 5 | 172 | 779001 | 5790.07 | 719 | 702 | 134.4 |
| B | 0 | 219 | 448911 | 3334.4 | 719 | 702 | 134.4 |
| B | 15 | 85 | 27288 | 197.78 | 719 | 702 | 134.4 |
| C | 7 | 221 | 536743 | 3327.32 | 705 | 714 | 161.1 |
| C | 0 | 10 | 222839 | 1378.81 | 705 | 714 | 161.1 |
| C | 1 | 241 | 98314 | 605.84 | 705 | 714 | 161.1 |
| D | 8 | 195 | 1002628 | 5937.43 | 671 | 658 | 168.8 |
| D | 2 | 250 | 915849 | 5423.19 | 671 | 658 | 168.8 |
| D | 7 | 38 | 572881 | 3390.85 | 671 | 658 | 168.8 |
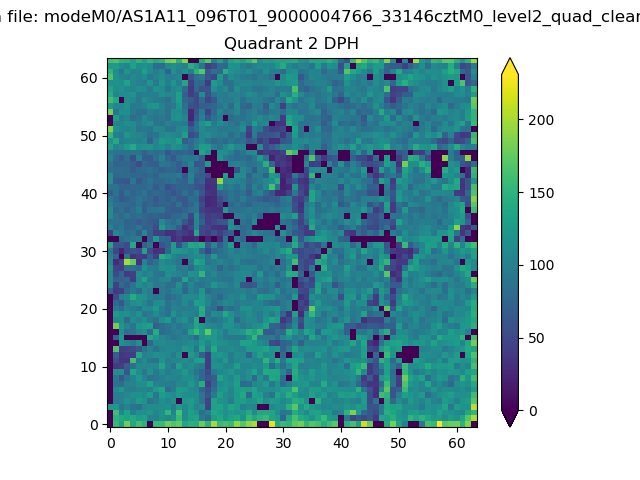
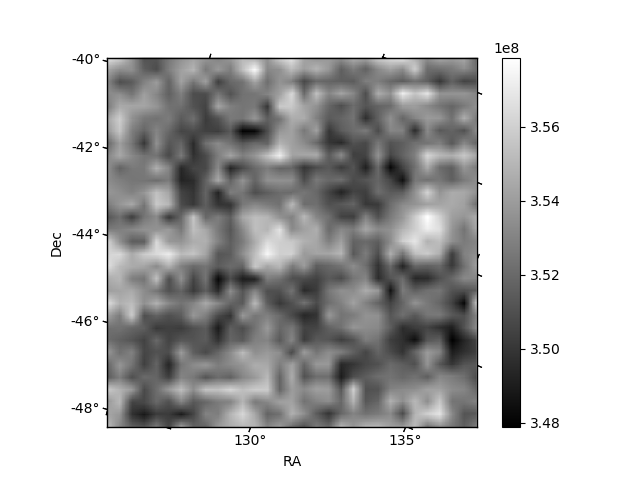
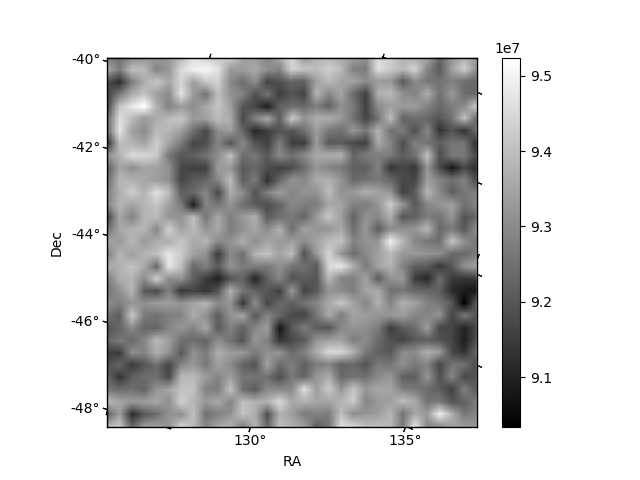
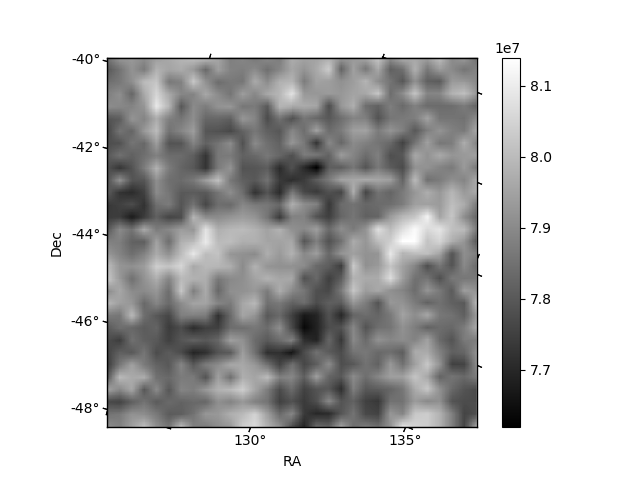
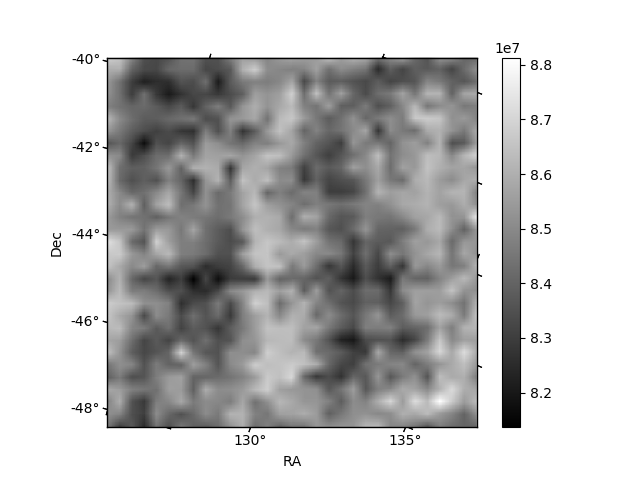
Histogram calculated using DETX and DETY for each event in the final _common_clean file
| Quadrant A | 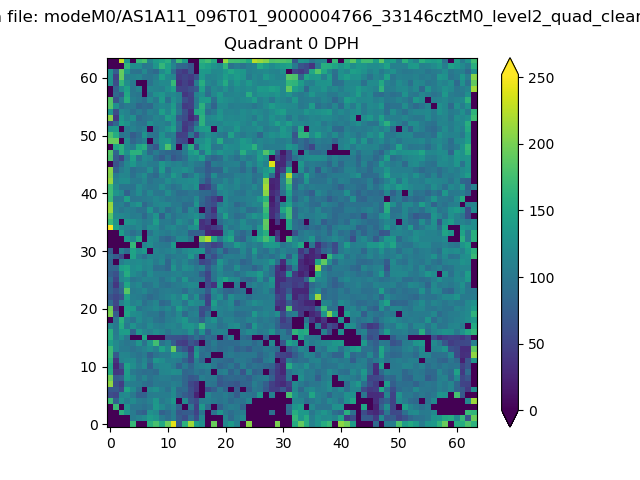 |
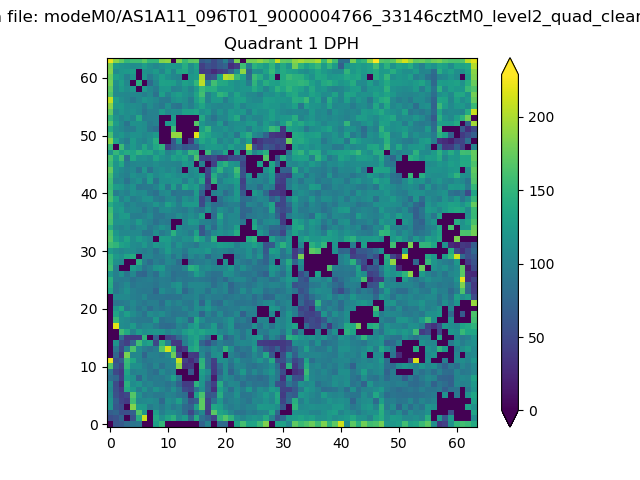 |
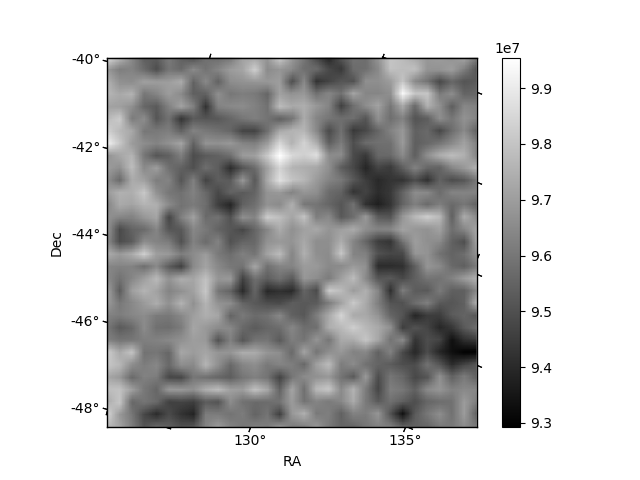
Quadrant B |
|---|---|---|---|
| Quadrant D | 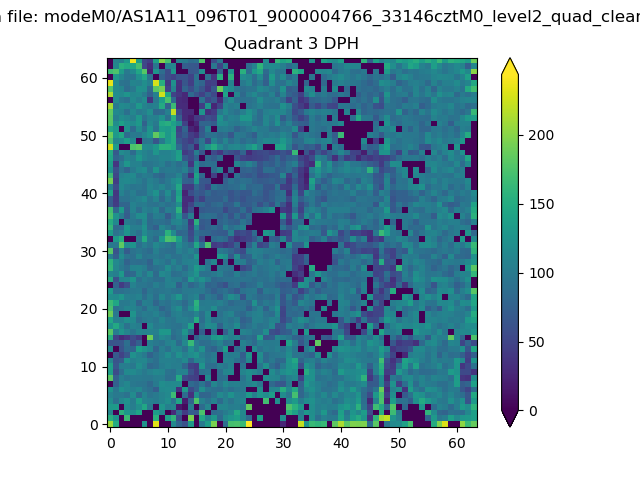 |
 |
Quadrant C |
| Plot type | Count rate plots | Images |
|---|---|---|
| Comparison with Poisson distribution Blue bars denote a histogram of data divided into 1 sec bins. Red curve is a Poisson curve with rate = median count rate of data. |
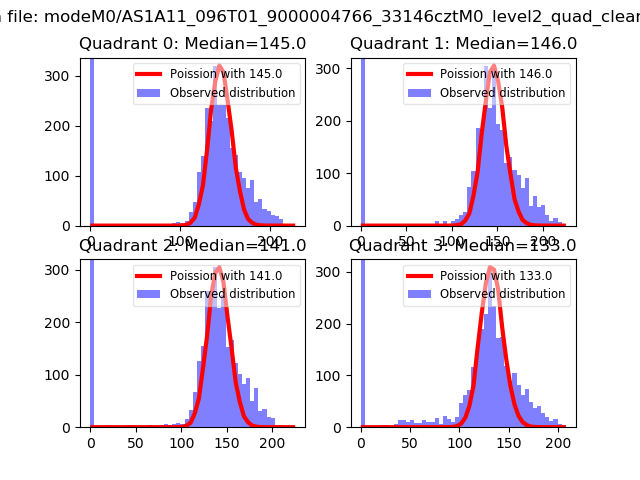 |
 |
| Quadrant-wise count rates Data is divided into 100 sec bins |
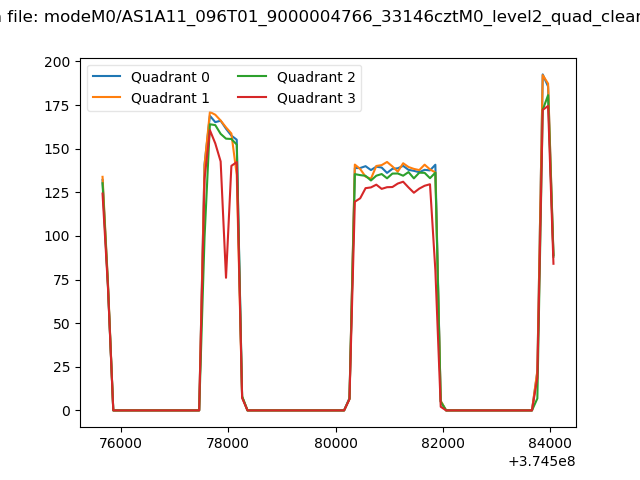 |
|
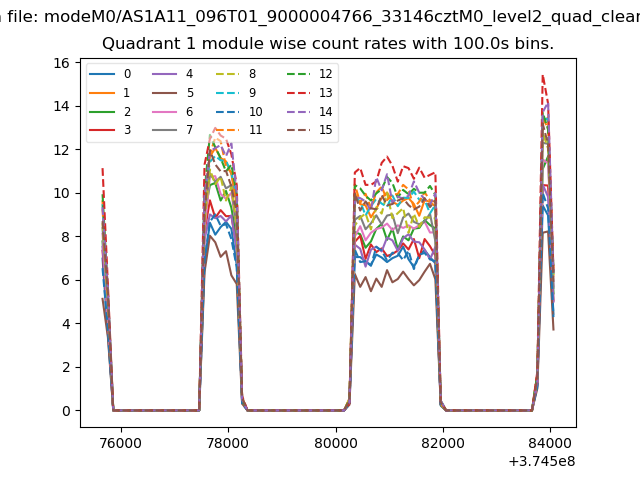
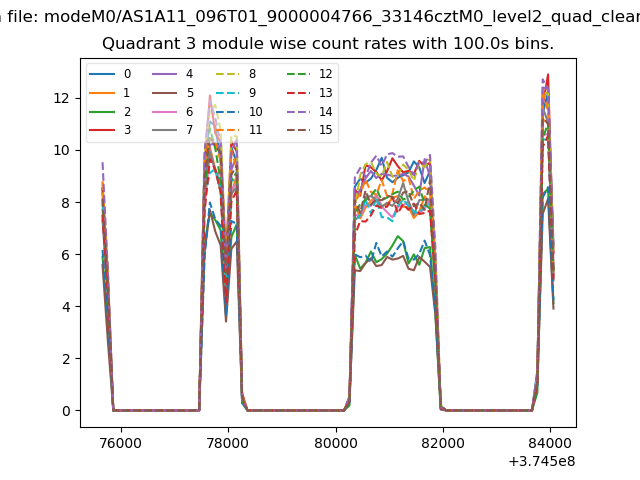
| Module-wise count rates for Quadrant A Data is divided into 100 sec bins |
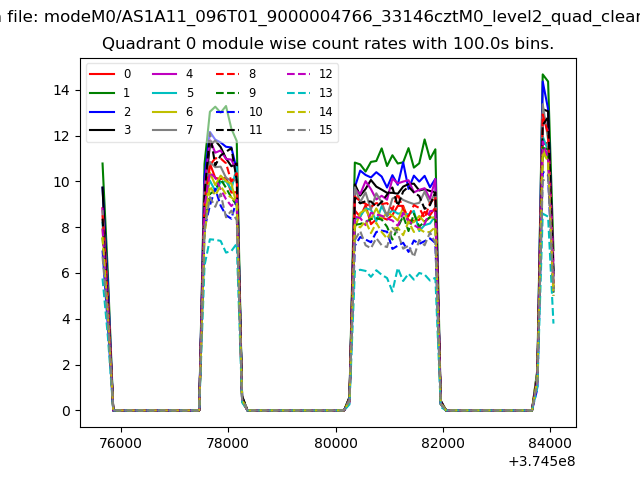 |
 |
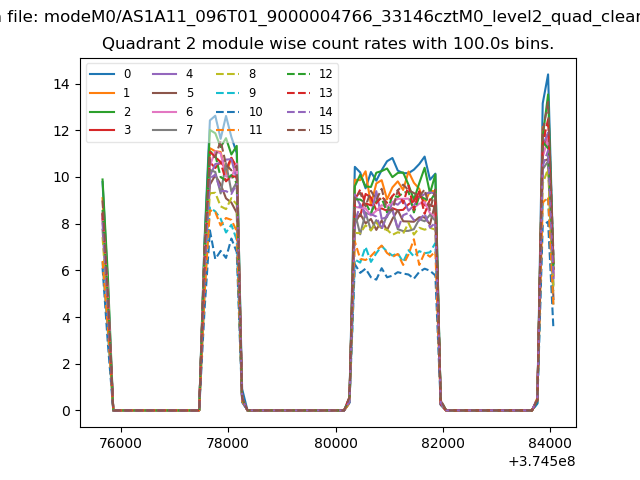
| Module-wise count rates for Quadrant B Data is divided into 100 sec bins |
 |
 |
| Module-wise count rates for Quadrant C Data is divided into 100 sec bins |
 |
 |
| Module-wise count rates for Quadrant D Data is divided into 100 sec bins |
 |
 |
| Parameter | Plot |
|---|---|
| CZT HV Monitor | 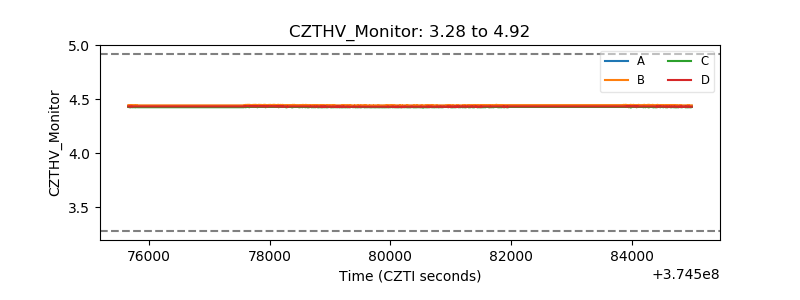 |
| D_VDD | 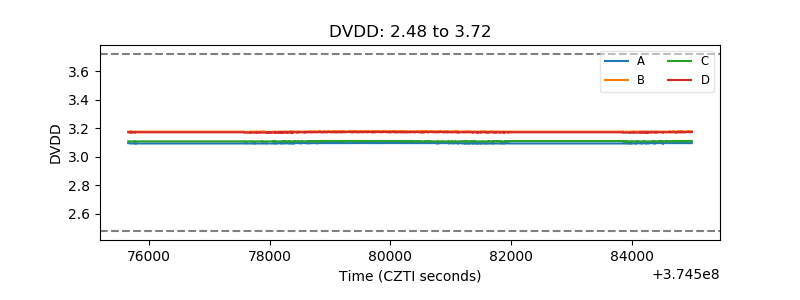 |
| Temperature 1 | 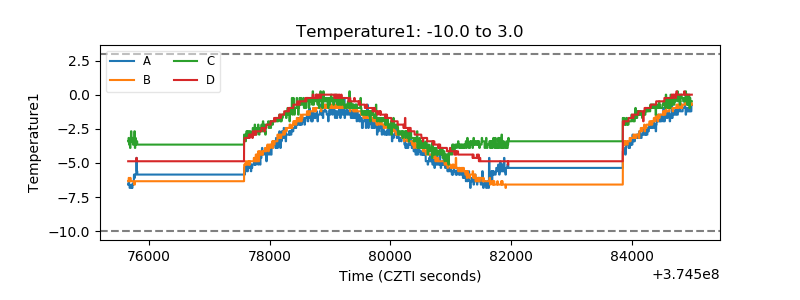 |
| Veto HV Monitor | 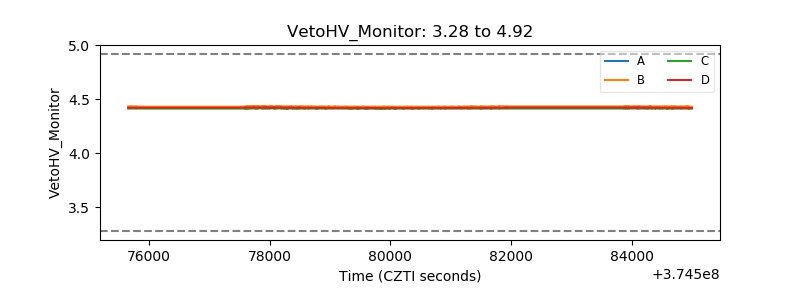 |
| Veto LLD | 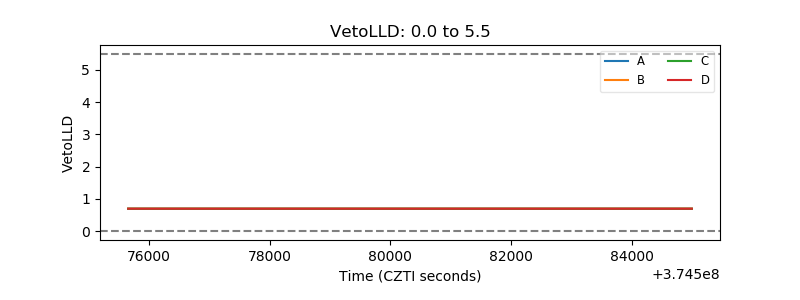 |
| Alpha Counter | 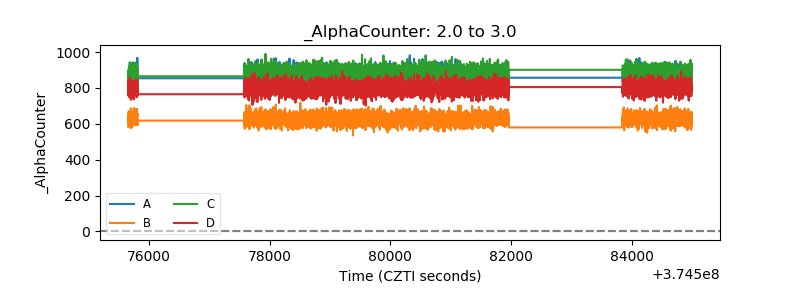 |
| _CPM_Rate | 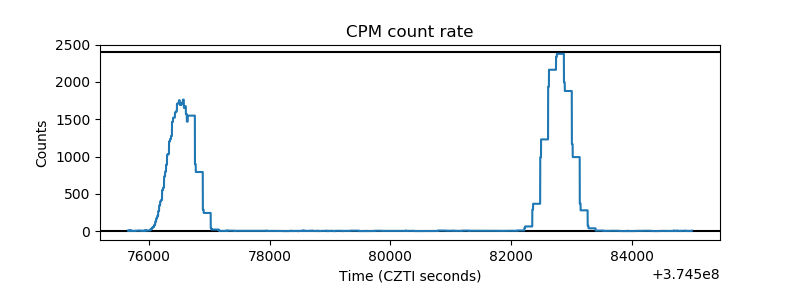 |
| CZT Counter | 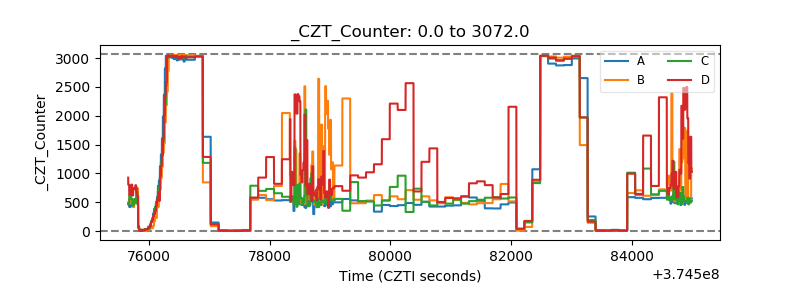 |
| +2.5 Volts monitor | 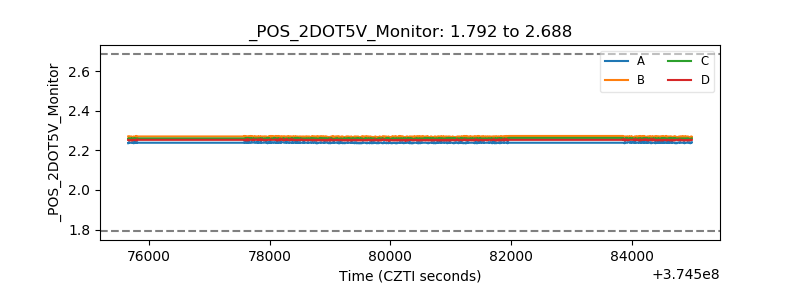 |
| +5 Volts monitor | 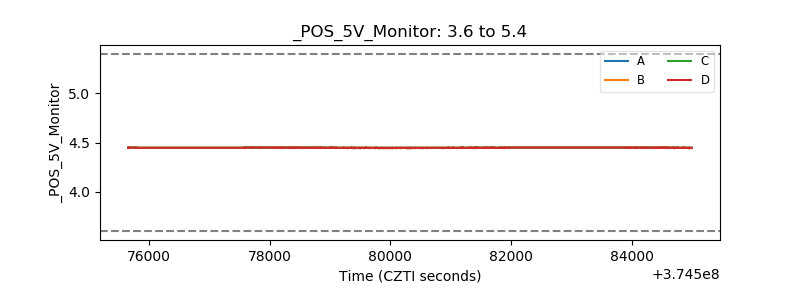 |
| _ROLL_ROT | 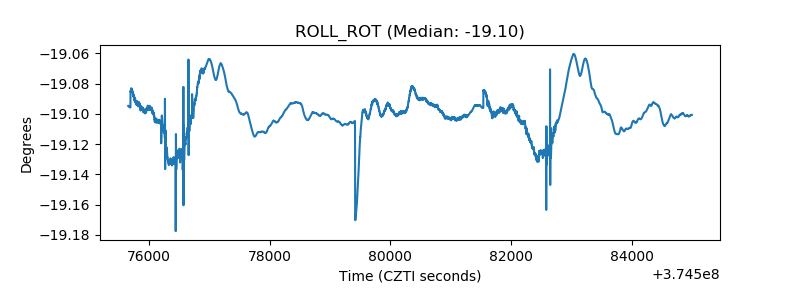 |
| _Roll_DEC | 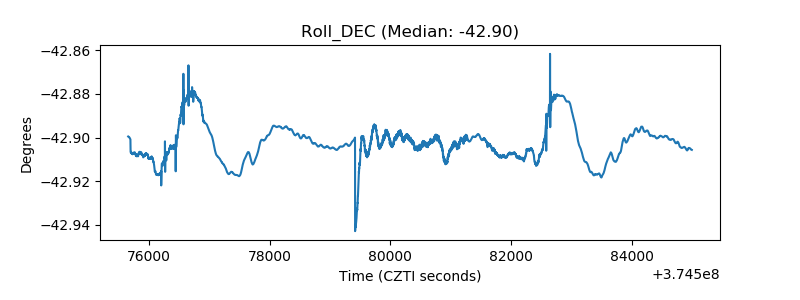 |
| _Roll_RA | 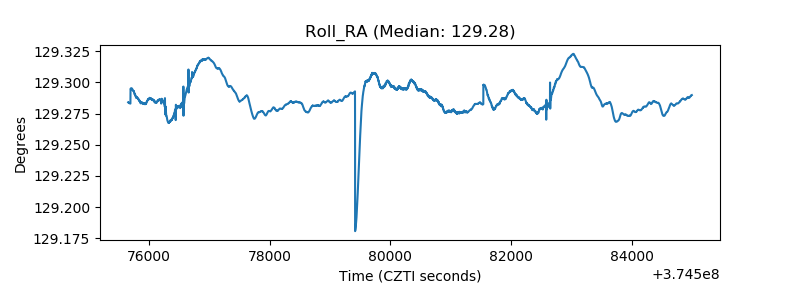 |
| Veto Counter | 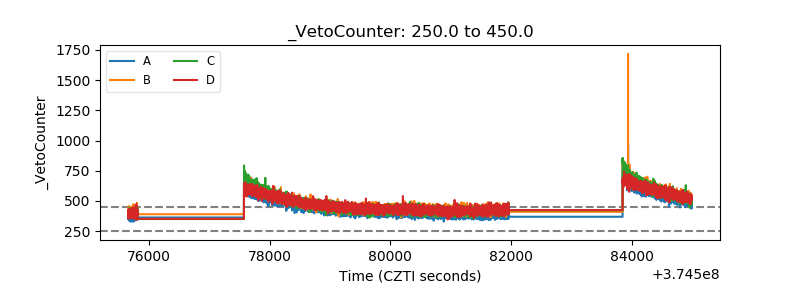 |