| Param | Original file | Final file |
|---|---|---|
| Filename | modeM0/AS1A11_096T01_9000004766_33147cztM0_level2.evt | modeM0/AS1A11_096T01_9000004766_33147cztM0_level2_quad_clean.evt |
| Size (bytes) | 544,069,440 | 54,555,840 |
| Size | 518.9 MB | 52.0 MB |
| Events in quadrant A | 2,884,872 | 328,244 |
| Events in quadrant B | 3,931,510 | 328,400 |
| Events in quadrant C | 3,293,310 | 314,893 |
| Events in quadrant D | 6,001,959 | 301,862 |
| Mode SS | |||
|---|---|---|---|
| Quadrant | BADHDUFLAG | Total packets | Discarded packets |
| A | 0 | 110 | 0 |
| B | 0 | 110 | 0 |
| C | 0 | 110 | 0 |
| D | 0 | 110 | 0 |
| Mode M0 | |||
|---|---|---|---|
| Quadrant | BADHDUFLAG | Total packets | Discarded packets |
| A | 0 | 11737 | 3 |
| B | 0 | 15156 | 2 |
| C | 0 | 12971 | 2 |
| D | 0 | 21760 | 2 |
| Mode M9 | |||
|---|---|---|---|
| Quadrant | BADHDUFLAG | Total packets | Discarded packets |
| A | 0 | 25 | 0 |
| B | 0 | 25 | 0 |
| C | 0 | 25 | 0 |
| D | 0 | 26 | 0 |
| Quadrant | Total seconds | Saturated seconds | Saturation percentage |
|---|---|---|---|
| A | 5402 | 6 | 0.111070% |
| B | 5402 | 308 | 5.701592% |
| C | 5402 | 96 | 1.777120% |
| D | 5402 | 691 | 12.791559% |
Noise dominated data is calculated using 1-second bins in cleaned event files. If a bin has >2000 counts, and if more than 50% of those come from <1% of pixels, then it is considered to be noise-dominated and hence unusable.
| Quadrant | # 1 sec bins | Bins with >0 counts | Bins with >2000 counts | High rate bins dominated by noise | Noise dominated (total time) | Noise dominated (detector-on time) | Marked lightcurve |
|---|---|---|---|---|---|---|---|
| A | 7405 | 5403 | 1 | 1 | 0.01% | 0.02% | 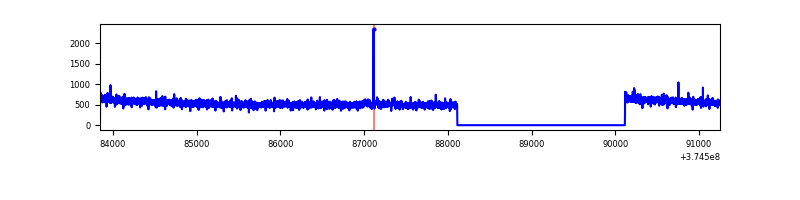 |
| B | 7405 | 5403 | 197 | 197 | 2.66% | 3.65% | 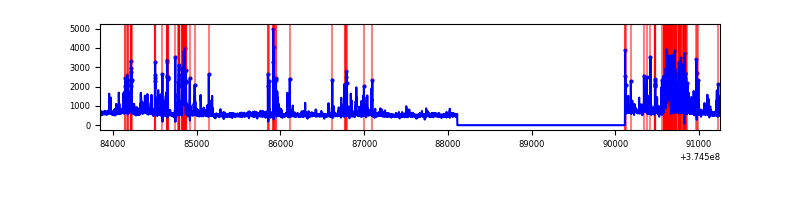 |
| C | 7405 | 5403 | 80 | 80 | 1.08% | 1.48% | 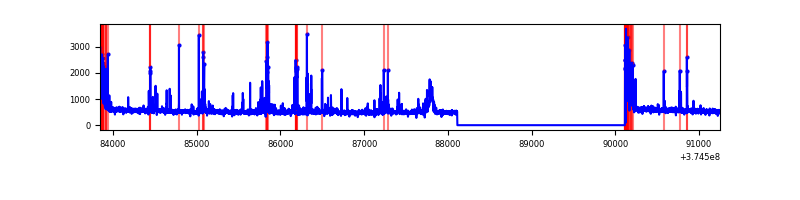 |
| D | 7405 | 5403 | 537 | 537 | 7.25% | 9.94% | 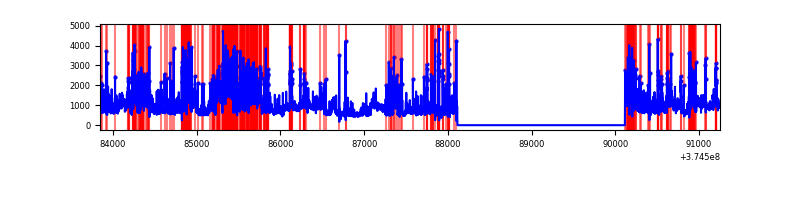 |
Top three noisy pixels from each quadrant. If the there are fewer than three noisy pixels in the level2.evt file, extra rows are filled as -1
| Pixel properties | Quadrant properties | ||||||
|---|---|---|---|---|---|---|---|
| Quadrant | DetID | PixID | Counts | Sigma | Mean | Median | Sigma |
| A | 0 | 47 | 19167 | 127.28 | 737 | 726 | 144.9 |
| A | 13 | 254 | 9985 | 63.9 | 737 | 726 | 144.9 |
| A | 13 | 6 | 7391 | 46.0 | 737 | 726 | 144.9 |
| B | 5 | 172 | 786766 | 5976.0 | 709 | 694 | 131.5 |
| B | 0 | 219 | 214688 | 1626.86 | 709 | 694 | 131.5 |
| B | 0 | 190 | 22845 | 168.4 | 709 | 694 | 131.5 |
| C | 0 | 10 | 246387 | 1564.06 | 693 | 701 | 157.1 |
| C | 9 | 187 | 221383 | 1404.88 | 693 | 701 | 157.1 |
| C | 1 | 241 | 75399 | 475.53 | 693 | 701 | 157.1 |
| D | 12 | 233 | 1057371 | 6403.31 | 673 | 660 | 165.0 |
| D | 8 | 195 | 1013771 | 6139.11 | 673 | 660 | 165.0 |
| D | 2 | 250 | 315323 | 1906.75 | 673 | 660 | 165.0 |
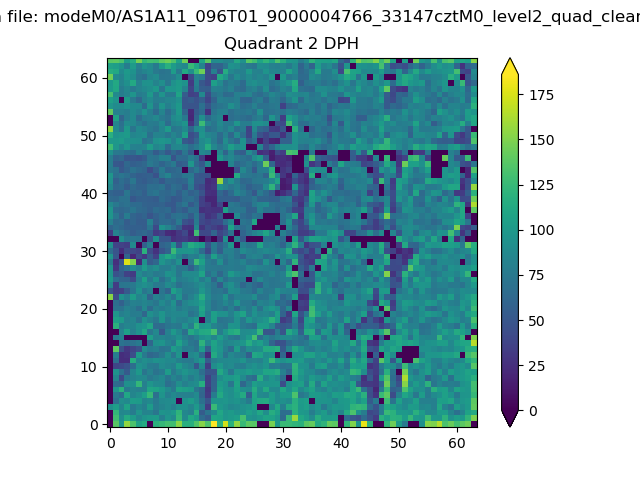
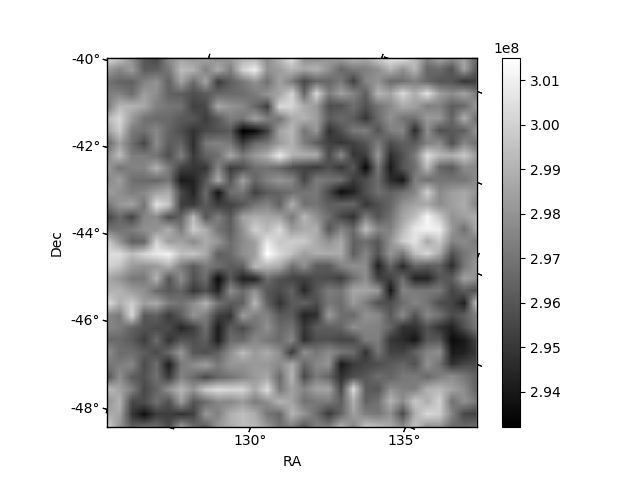
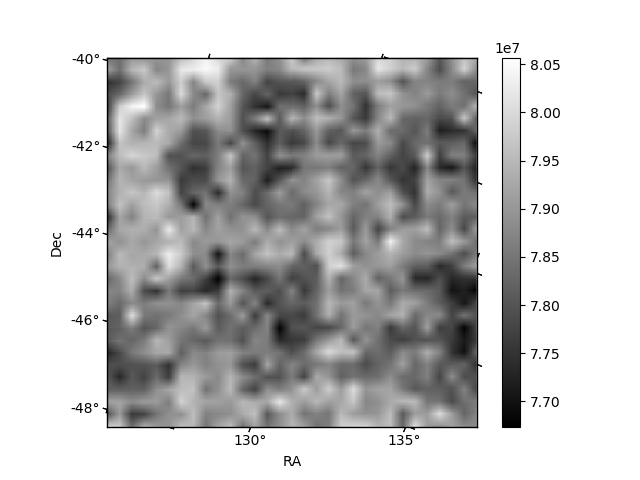
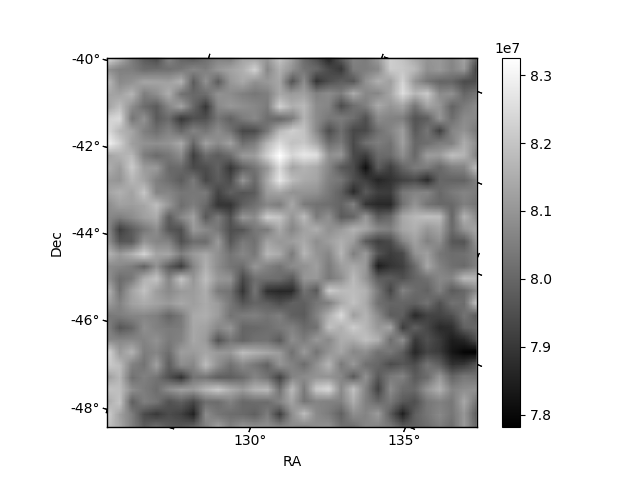
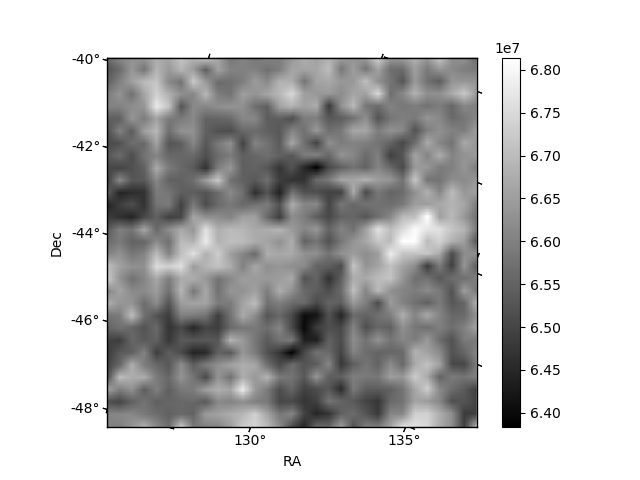
Histogram calculated using DETX and DETY for each event in the final _common_clean file
| Quadrant A | 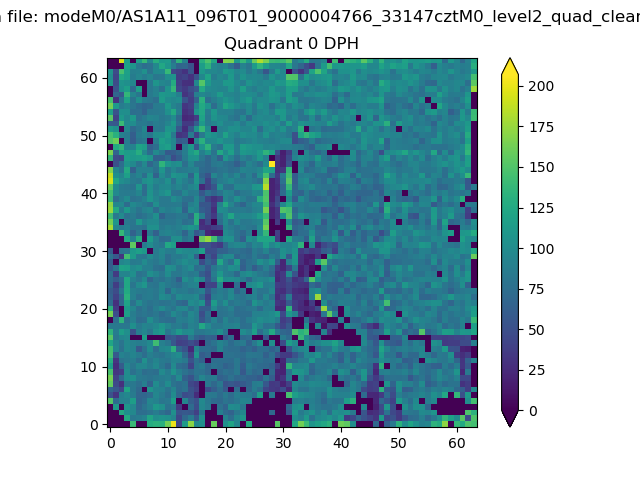 |
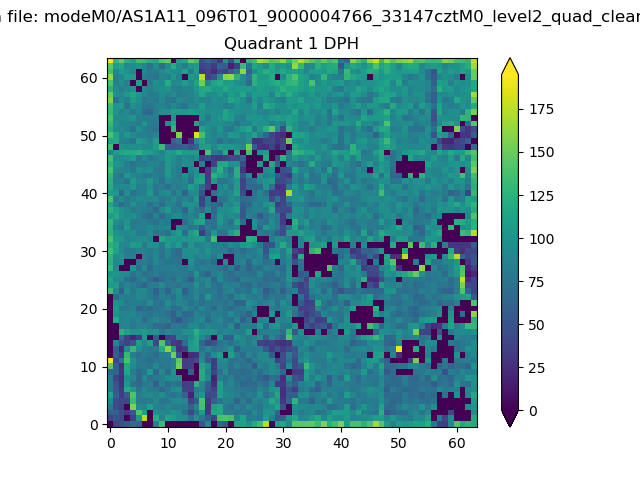 |
Quadrant B |
|---|---|---|---|
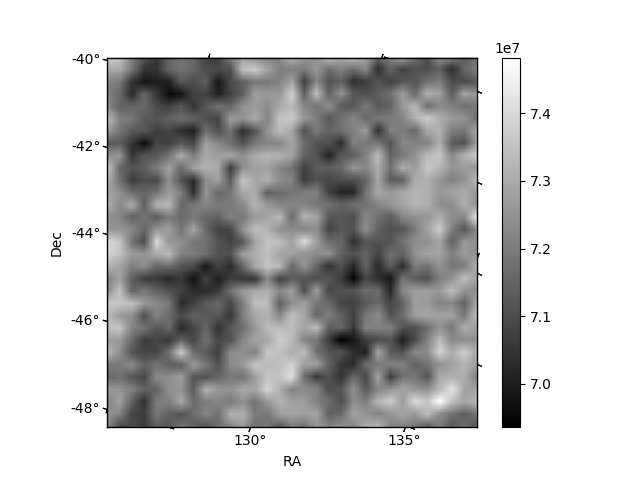
| Quadrant D | 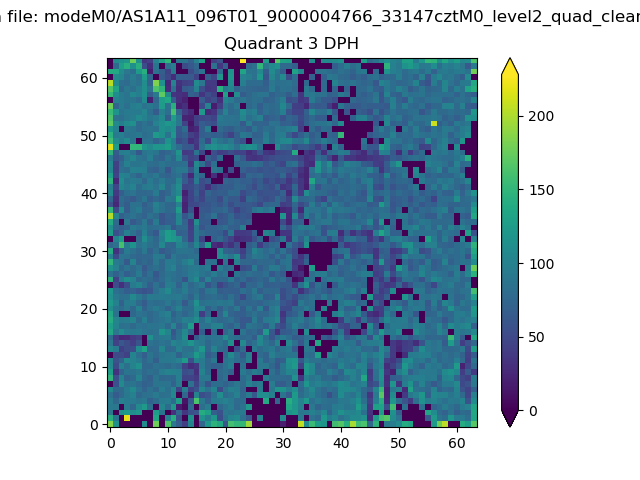 |
 |
Quadrant C |
| Plot type | Count rate plots | Images |
|---|---|---|
| Comparison with Poisson distribution Blue bars denote a histogram of data divided into 1 sec bins. Red curve is a Poisson curve with rate = median count rate of data. |
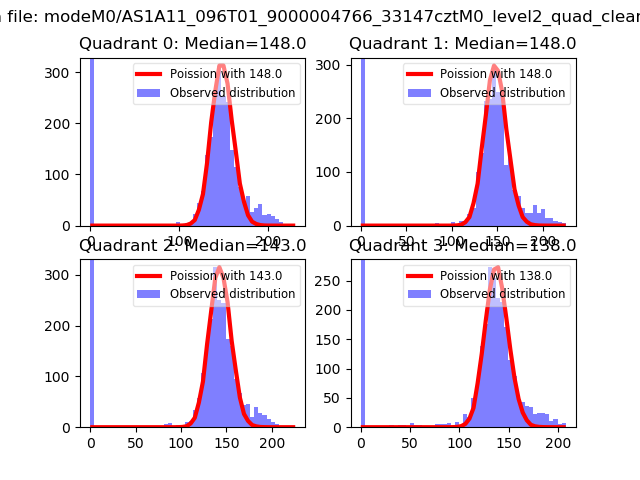 |
 |
| Quadrant-wise count rates Data is divided into 100 sec bins |
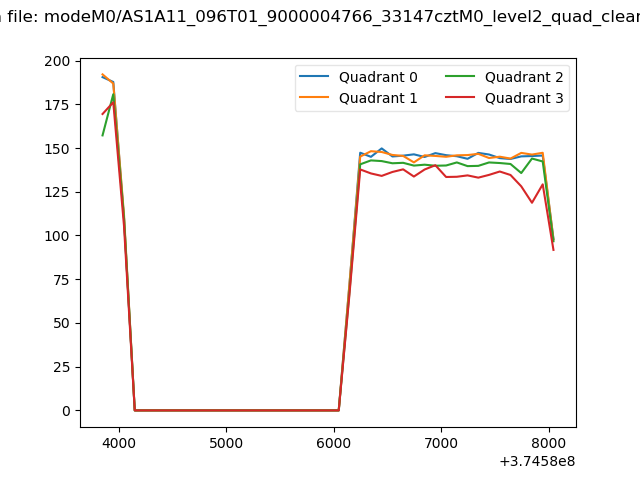 |
|
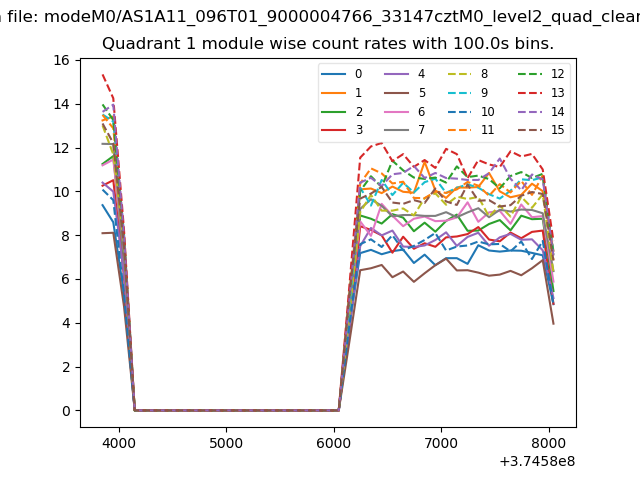
| Module-wise count rates for Quadrant A Data is divided into 100 sec bins |
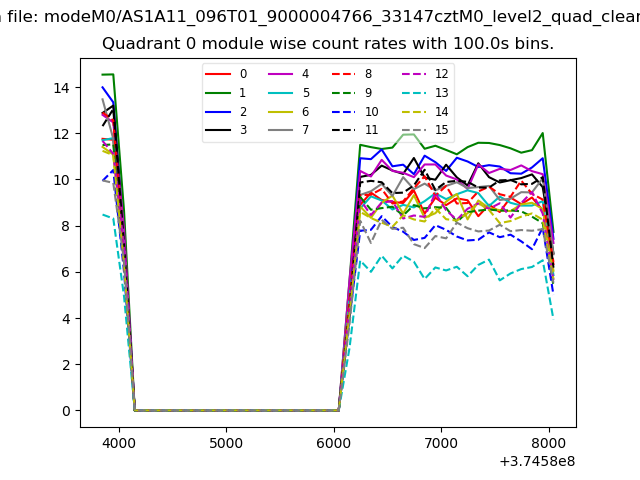 |
 |
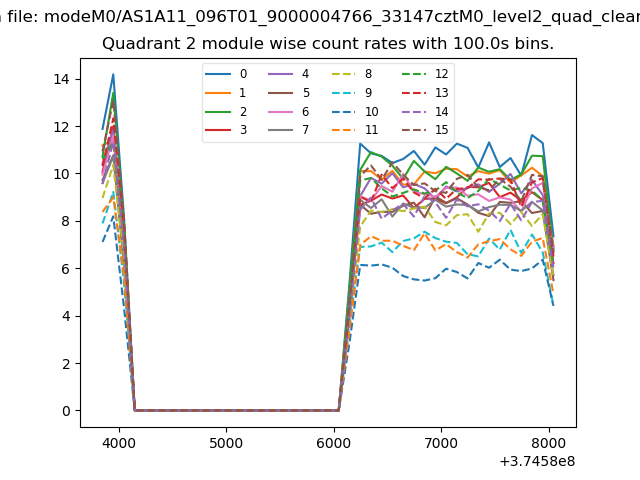
| Module-wise count rates for Quadrant B Data is divided into 100 sec bins |
 |
 |
| Module-wise count rates for Quadrant C Data is divided into 100 sec bins |
 |
 |
| Module-wise count rates for Quadrant D Data is divided into 100 sec bins |
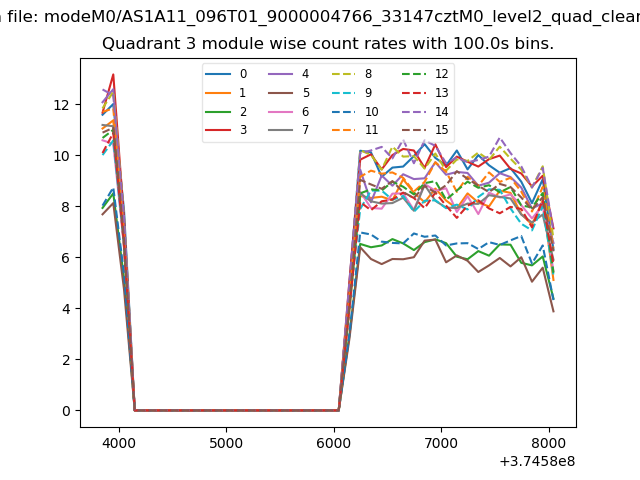 |
 |
| Parameter | Plot |
|---|---|
| CZT HV Monitor | 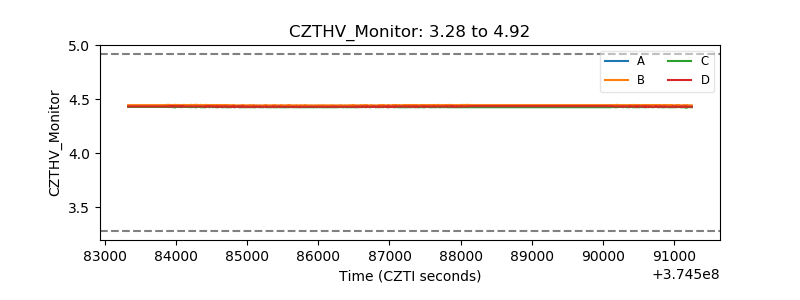 |
| D_VDD | 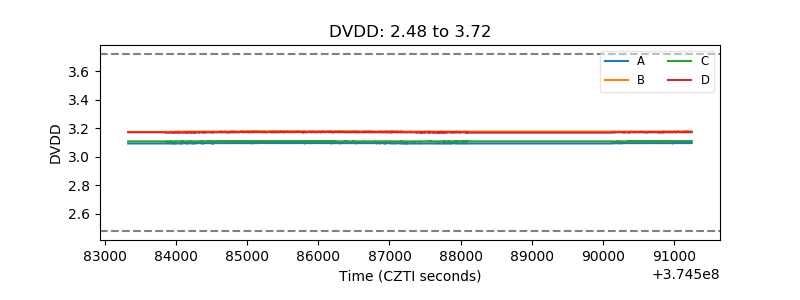 |
| Temperature 1 | 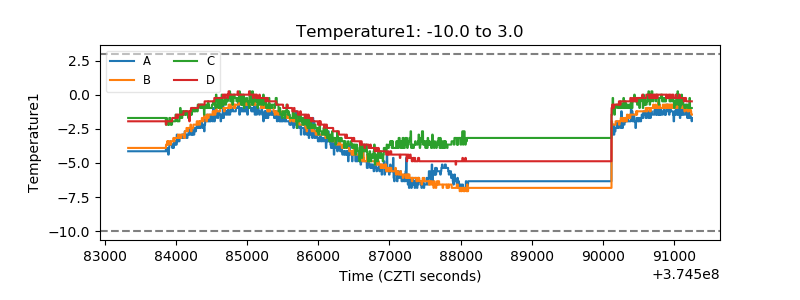 |
| Veto HV Monitor | 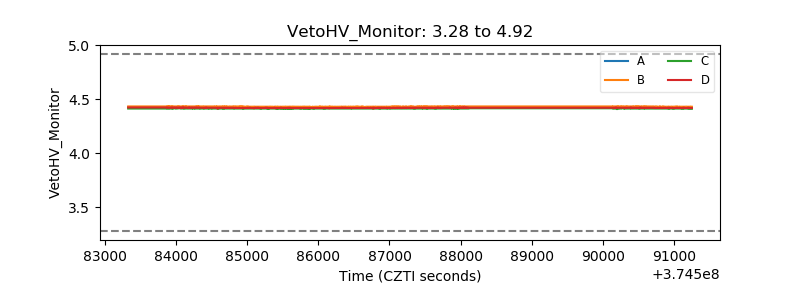 |
| Veto LLD | 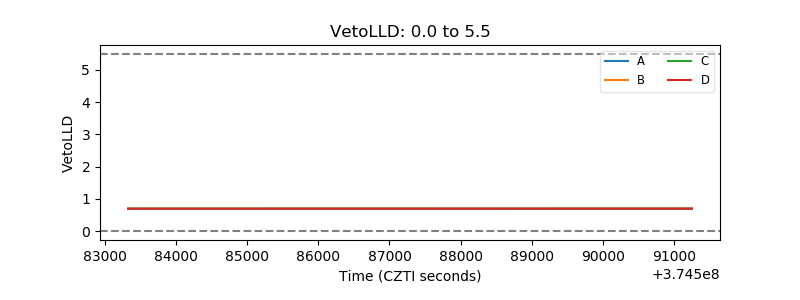 |
| Alpha Counter | 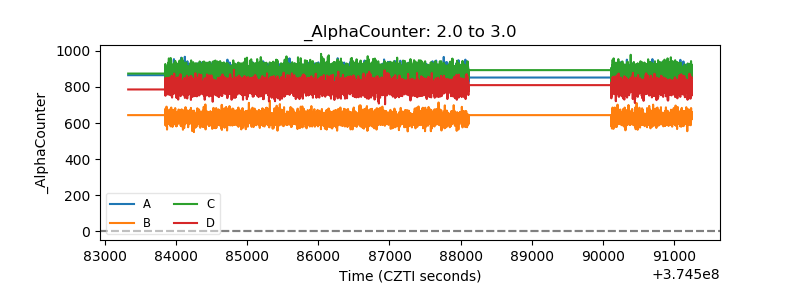 |
| _CPM_Rate | 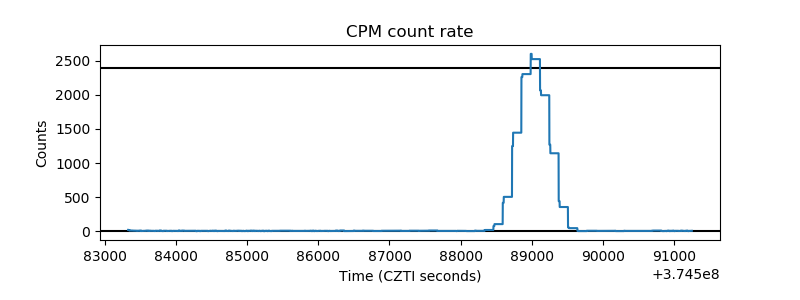 |
| CZT Counter | 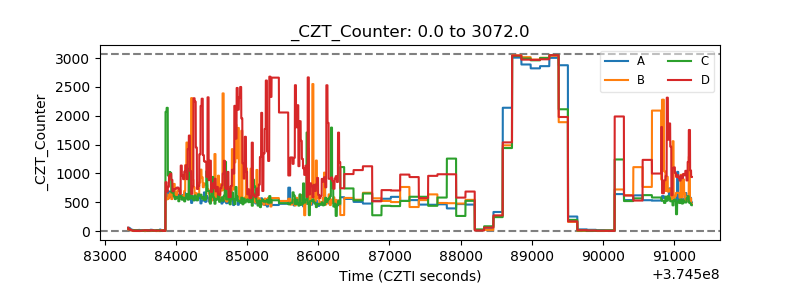 |
| +2.5 Volts monitor | 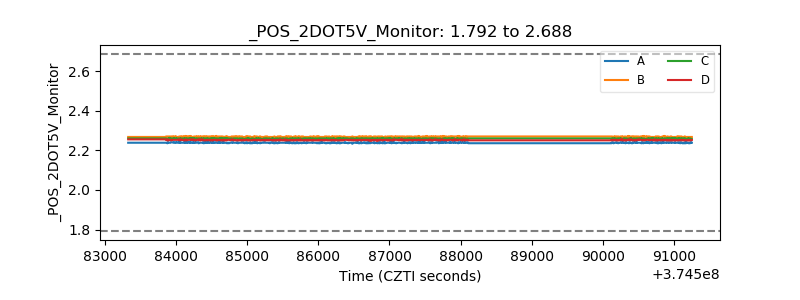 |
| +5 Volts monitor | 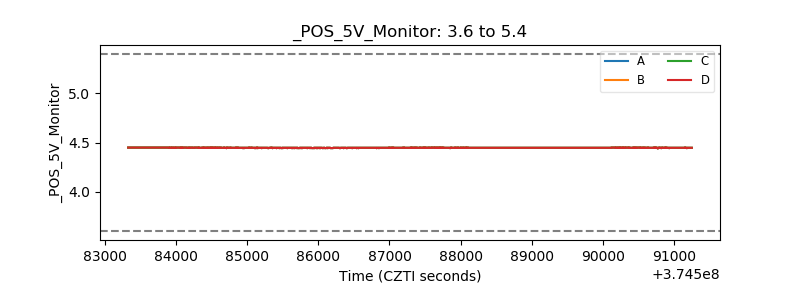 |
| _ROLL_ROT | 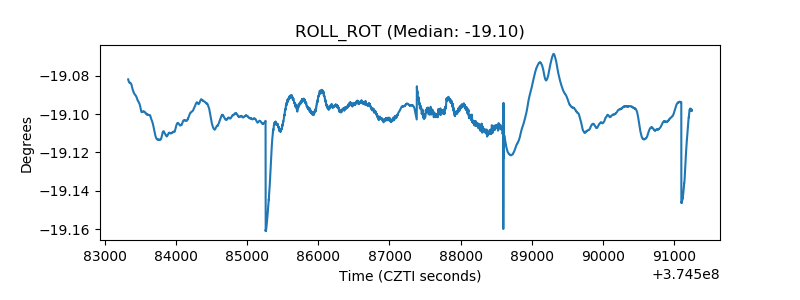 |
| _Roll_DEC | 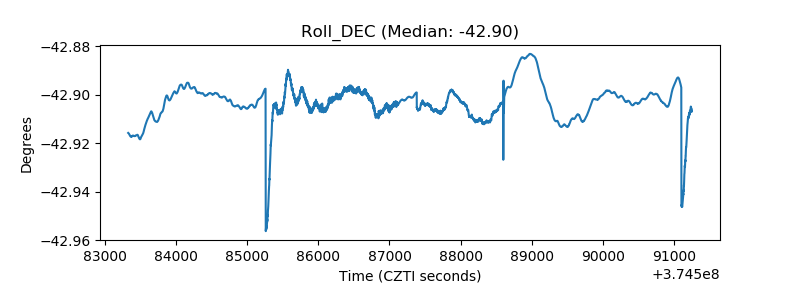 |
| _Roll_RA | 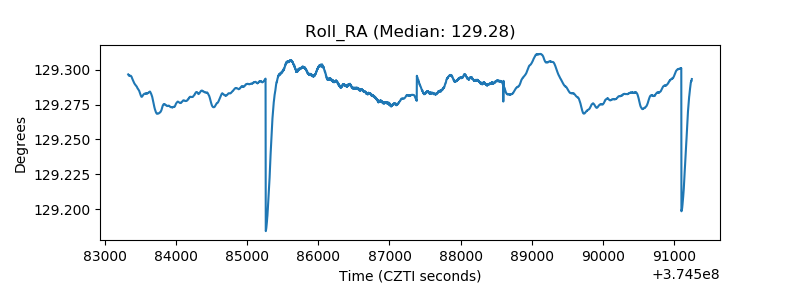 |
| Veto Counter | 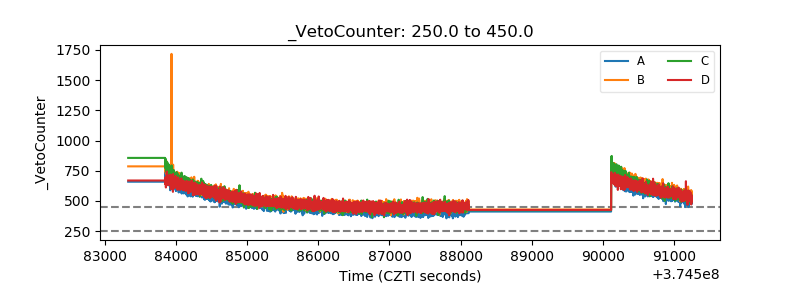 |