| Param | Original file | Final file |
|---|---|---|
| Filename | modeM0/AS1A11_096T01_9000004766_33148cztM0_level2.evt | modeM0/AS1A11_096T01_9000004766_33148cztM0_level2_quad_clean.evt |
| Size (bytes) | 511,318,080 | 55,483,200 |
| Size | 487.6 MB | 52.9 MB |
| Events in quadrant A | 2,804,208 | 339,683 |
| Events in quadrant B | 4,016,426 | 340,308 |
| Events in quadrant C | 2,963,078 | 326,700 |
| Events in quadrant D | 5,349,769 | 308,846 |
| Mode SS | |||
|---|---|---|---|
| Quadrant | BADHDUFLAG | Total packets | Discarded packets |
| A | 0 | 106 | 0 |
| B | 0 | 106 | 0 |
| C | 0 | 106 | 0 |
| D | 0 | 106 | 0 |
| Mode M0 | |||
|---|---|---|---|
| Quadrant | BADHDUFLAG | Total packets | Discarded packets |
| A | 0 | 11411 | 3 |
| B | 0 | 15342 | 2 |
| C | 0 | 11775 | 2 |
| D | 0 | 19583 | 2 |
| Mode M9 | |||
|---|---|---|---|
| Quadrant | BADHDUFLAG | Total packets | Discarded packets |
| A | 0 | 25 | 0 |
| B | 0 | 25 | 0 |
| C | 0 | 25 | 0 |
| D | 0 | 26 | 0 |
| Quadrant | Total seconds | Saturated seconds | Saturation percentage |
|---|---|---|---|
| A | 5197 | 7 | 0.134693% |
| B | 5197 | 383 | 7.369636% |
| C | 5197 | 88 | 1.693285% |
| D | 5197 | 407 | 7.831441% |
Noise dominated data is calculated using 1-second bins in cleaned event files. If a bin has >2000 counts, and if more than 50% of those come from <1% of pixels, then it is considered to be noise-dominated and hence unusable.
| Quadrant | # 1 sec bins | Bins with >0 counts | Bins with >2000 counts | High rate bins dominated by noise | Noise dominated (total time) | Noise dominated (detector-on time) | Marked lightcurve |
|---|---|---|---|---|---|---|---|
| A | 7289 | 5198 | 1 | 1 | 0.01% | 0.02% | 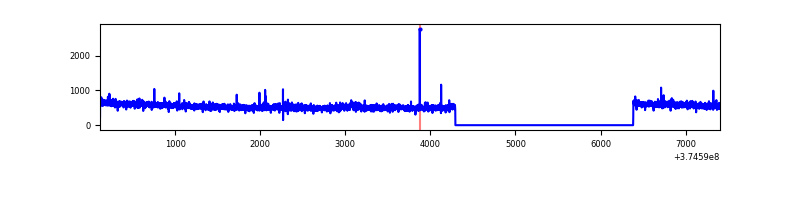 |
| B | 7289 | 5198 | 203 | 203 | 2.79% | 3.91% | 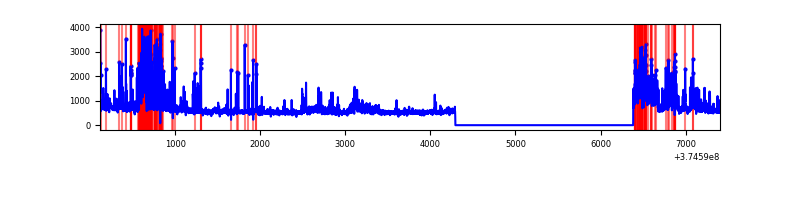 |
| C | 7289 | 5198 | 61 | 61 | 0.84% | 1.17% | 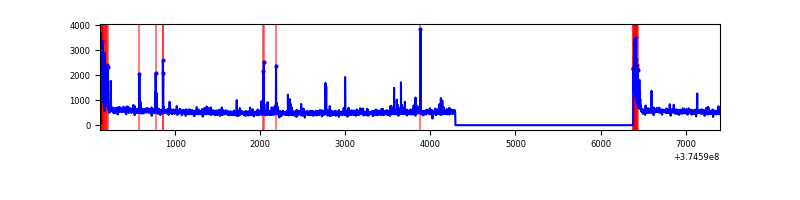 |
| D | 7289 | 5198 | 330 | 330 | 4.53% | 6.35% | 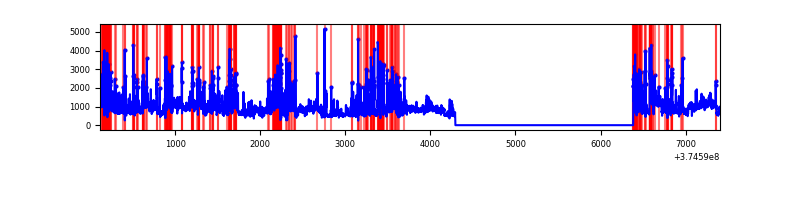 |
Top three noisy pixels from each quadrant. If the there are fewer than three noisy pixels in the level2.evt file, extra rows are filled as -1
| Pixel properties | Quadrant properties | ||||||
|---|---|---|---|---|---|---|---|
| Quadrant | DetID | PixID | Counts | Sigma | Mean | Median | Sigma |
| A | 0 | 47 | 13891 | 93.82 | 715 | 706 | 140.5 |
| A | 0 | 31 | 13125 | 88.37 | 715 | 706 | 140.5 |
| A | 13 | 254 | 9743 | 64.31 | 715 | 706 | 140.5 |
| B | 5 | 172 | 662833 | 5214.69 | 687 | 675 | 127.0 |
| B | 0 | 219 | 360096 | 2830.54 | 687 | 675 | 127.0 |
| B | 0 | 199 | 85835 | 670.66 | 687 | 675 | 127.0 |
| C | 0 | 10 | 232003 | 1516.54 | 669 | 675 | 152.5 |
| C | 1 | 241 | 44836 | 289.51 | 669 | 675 | 152.5 |
| C | 9 | 187 | 23421 | 149.12 | 669 | 675 | 152.5 |
| D | 8 | 195 | 1090651 | 6828.49 | 661 | 650 | 159.6 |
| D | 12 | 233 | 426782 | 2669.57 | 661 | 650 | 159.6 |
| D | 1 | 47 | 404682 | 2531.12 | 661 | 650 | 159.6 |
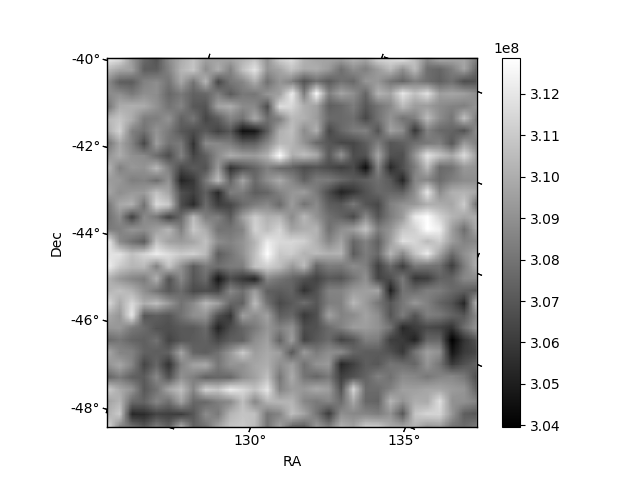
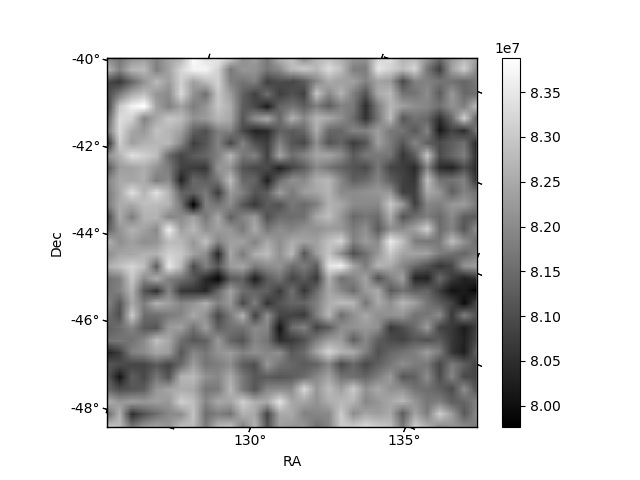
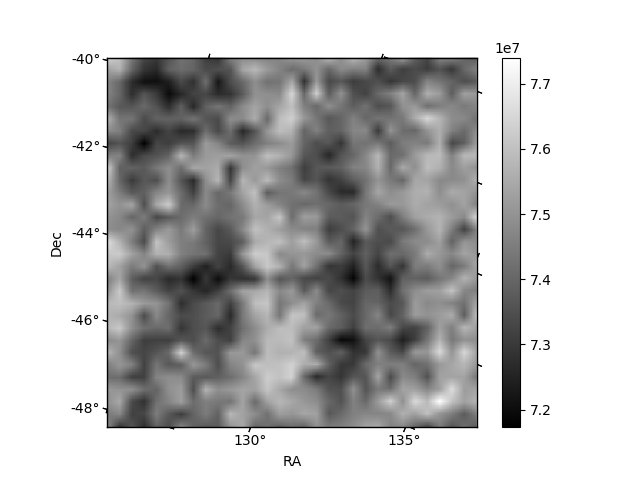
Histogram calculated using DETX and DETY for each event in the final _common_clean file
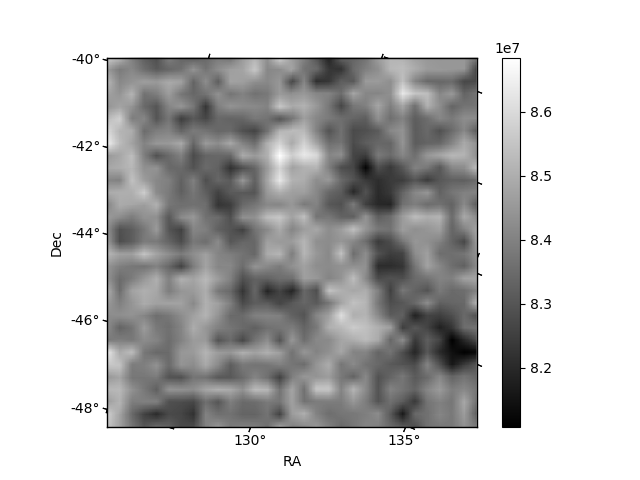
| Quadrant A | 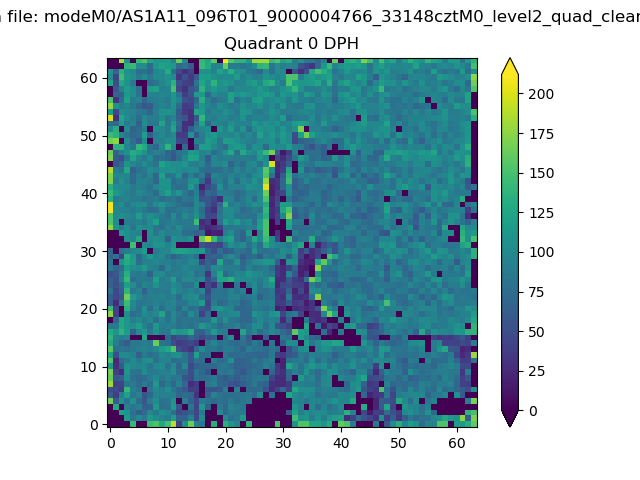 |
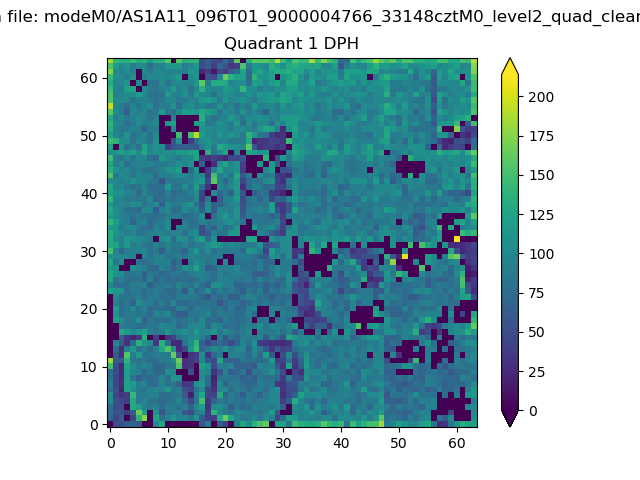 |
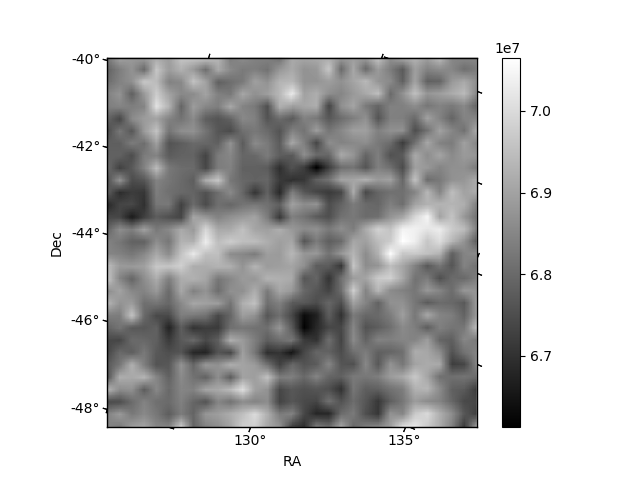
Quadrant B |
|---|---|---|---|
| Quadrant D | 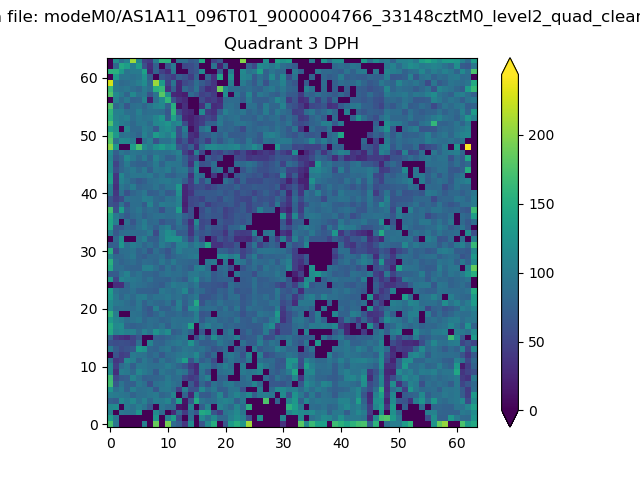 |
 |
Quadrant C |
| Plot type | Count rate plots | Images |
|---|---|---|
| Comparison with Poisson distribution Blue bars denote a histogram of data divided into 1 sec bins. Red curve is a Poisson curve with rate = median count rate of data. |
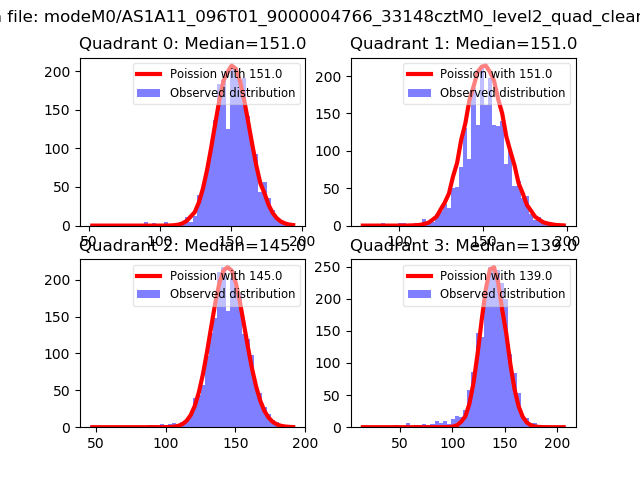 |
 |
| Quadrant-wise count rates Data is divided into 100 sec bins |
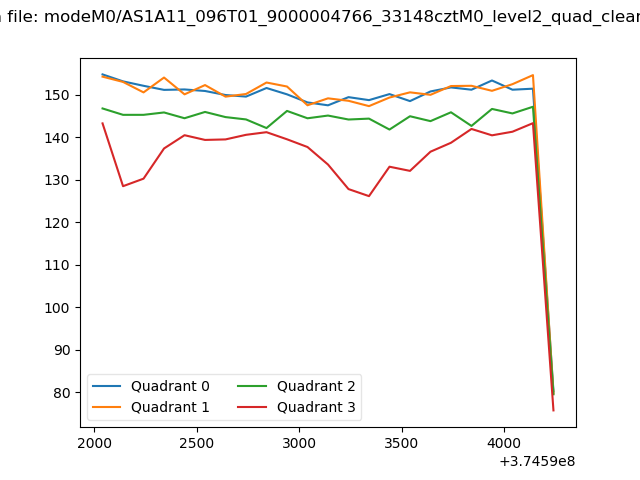 |
|
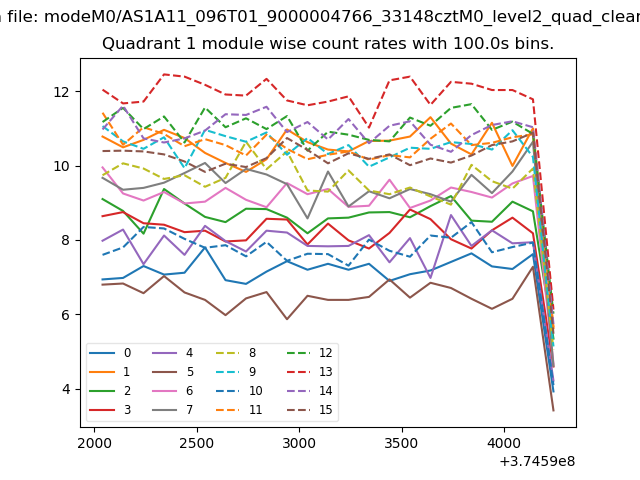
| Module-wise count rates for Quadrant A Data is divided into 100 sec bins |
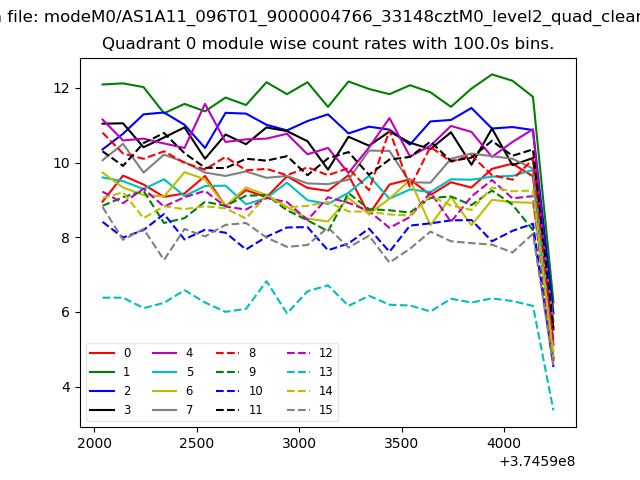 |
 |
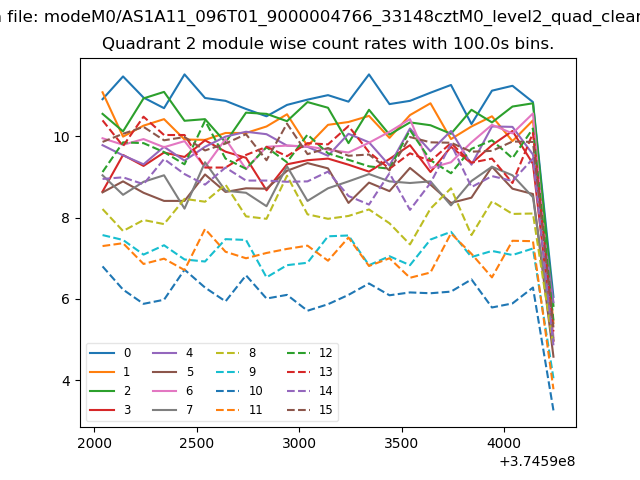
| Module-wise count rates for Quadrant B Data is divided into 100 sec bins |
 |
 |
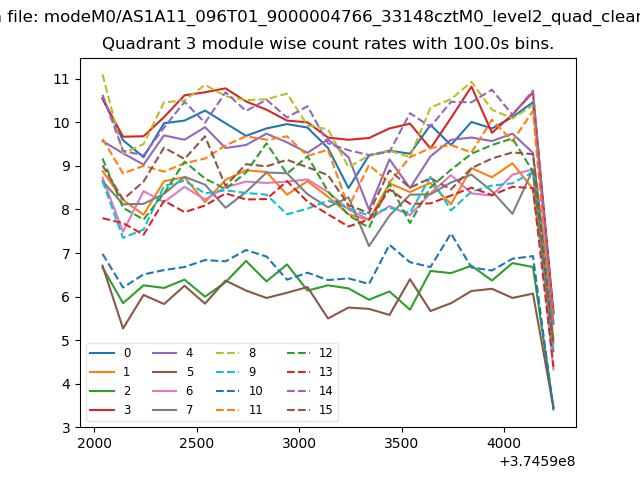
| Module-wise count rates for Quadrant C Data is divided into 100 sec bins |
 |
 |
| Module-wise count rates for Quadrant D Data is divided into 100 sec bins |
 |
 |
| Parameter | Plot |
|---|---|
| CZT HV Monitor | 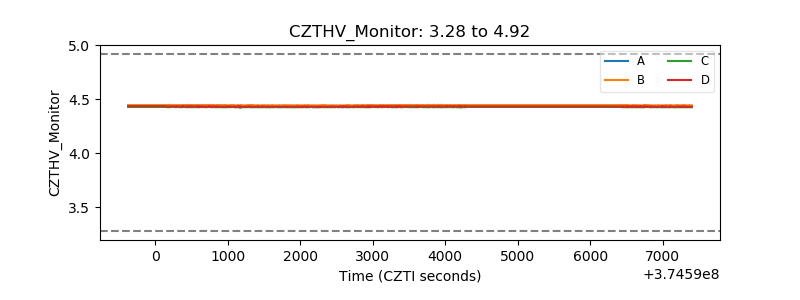 |
| D_VDD | 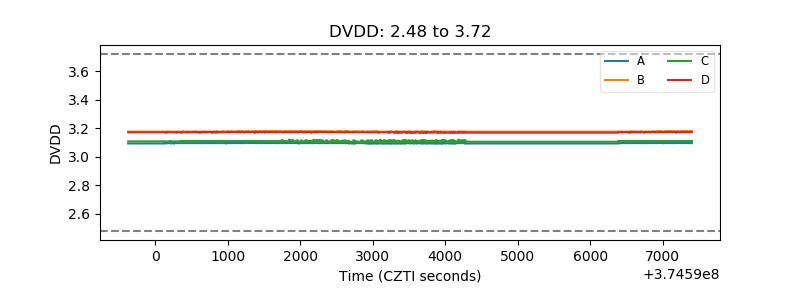 |
| Temperature 1 | 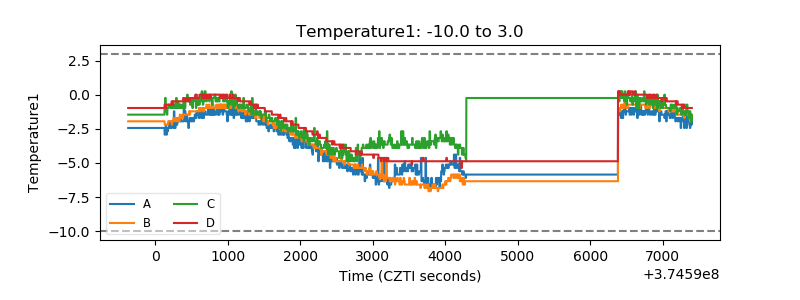 |
| Veto HV Monitor | 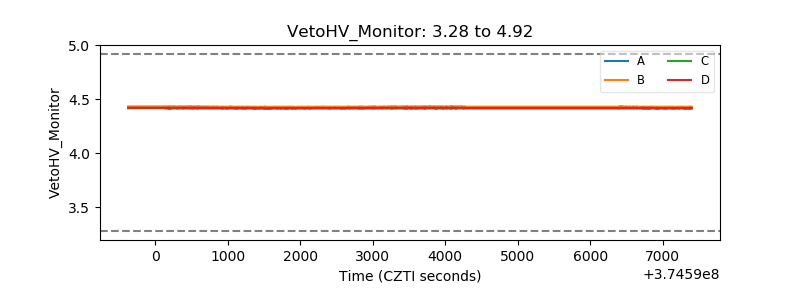 |
| Veto LLD | 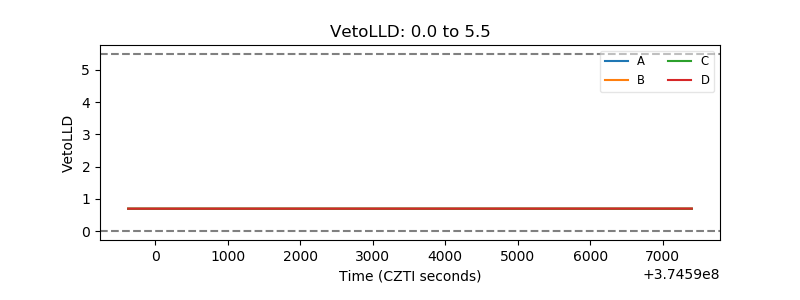 |
| Alpha Counter | 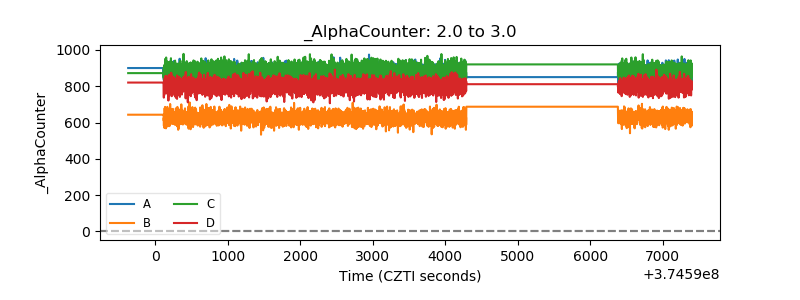 |
| _CPM_Rate | 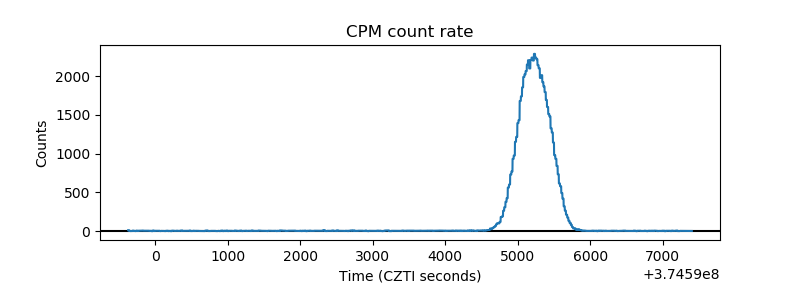 |
| CZT Counter |  |
| +2.5 Volts monitor |  |
| +5 Volts monitor |  |
| _ROLL_ROT | 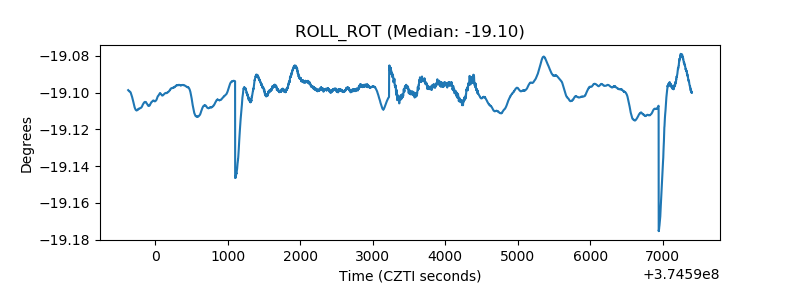 |
| _Roll_DEC | 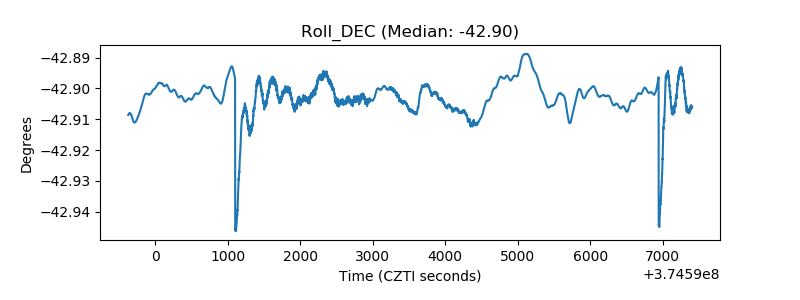 |
| _Roll_RA | 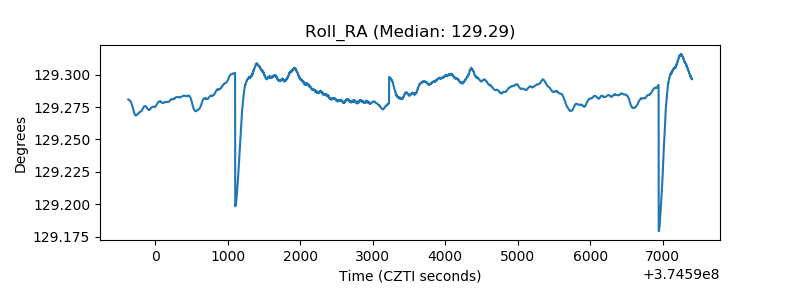 |
| Veto Counter | 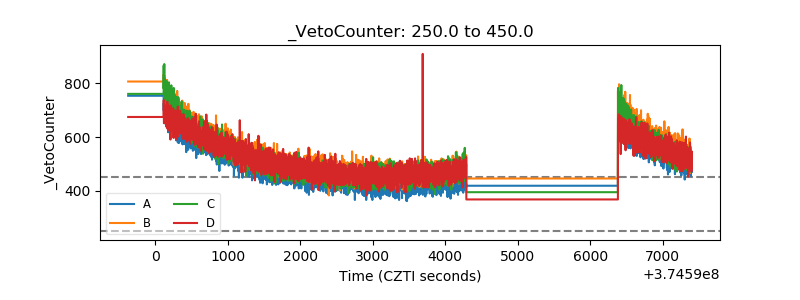 |