| Param | Original file | Final file |
|---|---|---|
| Filename | modeM0/AS1A11_096T01_9000004766_33149cztM0_level2.evt | modeM0/AS1A11_096T01_9000004766_33149cztM0_level2_quad_clean.evt |
| Size (bytes) | 489,617,280 | 62,251,200 |
| Size | 466.9 MB | 59.4 MB |
| Events in quadrant A | 2,654,589 | 398,271 |
| Events in quadrant B | 3,984,567 | 389,826 |
| Events in quadrant C | 2,806,626 | 381,116 |
| Events in quadrant D | 5,037,882 | 359,318 |
| Mode SS | |||
|---|---|---|---|
| Quadrant | BADHDUFLAG | Total packets | Discarded packets |
| A | 0 | 104 | 0 |
| B | 0 | 104 | 0 |
| C | 0 | 104 | 0 |
| D | 0 | 104 | 0 |
| Mode M0 | |||
|---|---|---|---|
| Quadrant | BADHDUFLAG | Total packets | Discarded packets |
| A | 0 | 10783 | 3 |
| B | 0 | 15217 | 2 |
| C | 0 | 11274 | 2 |
| D | 0 | 18526 | 2 |
| Mode M9 | |||
|---|---|---|---|
| Quadrant | BADHDUFLAG | Total packets | Discarded packets |
| A | 0 | 26 | 0 |
| B | 0 | 26 | 0 |
| C | 0 | 26 | 0 |
| D | 0 | 27 | 0 |
| Quadrant | Total seconds | Saturated seconds | Saturation percentage |
|---|---|---|---|
| A | 5082 | 5 | 0.098386% |
| B | 5082 | 379 | 7.457694% |
| C | 5082 | 81 | 1.593861% |
| D | 5082 | 384 | 7.556080% |
Noise dominated data is calculated using 1-second bins in cleaned event files. If a bin has >2000 counts, and if more than 50% of those come from <1% of pixels, then it is considered to be noise-dominated and hence unusable.
| Quadrant | # 1 sec bins | Bins with >0 counts | Bins with >2000 counts | High rate bins dominated by noise | Noise dominated (total time) | Noise dominated (detector-on time) | Marked lightcurve |
|---|---|---|---|---|---|---|---|
| A | 7205 | 5083 | 0 | 0 | 0.00% | 0.00% | 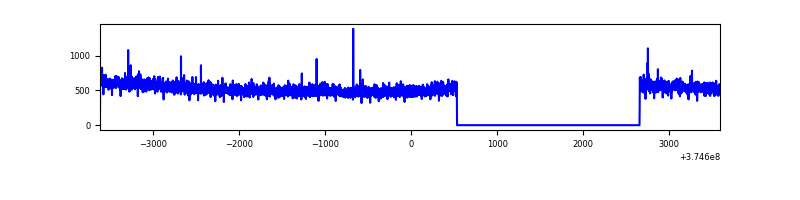 |
| B | 7205 | 5083 | 178 | 178 | 2.47% | 3.50% | 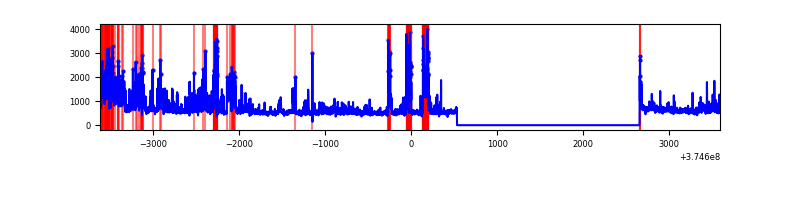 |
| C | 7205 | 5083 | 48 | 48 | 0.67% | 0.94% | 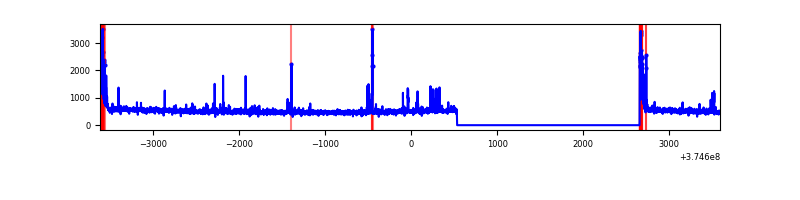 |
| D | 7205 | 5083 | 329 | 329 | 4.57% | 6.47% | 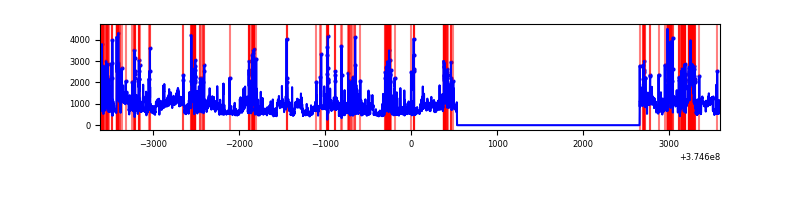 |
Top three noisy pixels from each quadrant. If the there are fewer than three noisy pixels in the level2.evt file, extra rows are filled as -1
| Pixel properties | Quadrant properties | ||||||
|---|---|---|---|---|---|---|---|
| Quadrant | DetID | PixID | Counts | Sigma | Mean | Median | Sigma |
| A | 13 | 6 | 18128 | 130.92 | 677 | 666 | 133.4 |
| A | 13 | 254 | 9678 | 67.57 | 677 | 666 | 133.4 |
| A | 0 | 31 | 7321 | 49.9 | 677 | 666 | 133.4 |
| B | 0 | 219 | 560149 | 4535.25 | 658 | 645 | 123.4 |
| B | 5 | 172 | 504010 | 4080.19 | 658 | 645 | 123.4 |
| B | 0 | 189 | 159162 | 1284.91 | 658 | 645 | 123.4 |
| C | 0 | 10 | 188021 | 1288.88 | 635 | 641 | 145.4 |
| C | 9 | 187 | 59376 | 404.01 | 635 | 641 | 145.4 |
| C | 7 | 221 | 36404 | 245.99 | 635 | 641 | 145.4 |
| D | 8 | 195 | 1247313 | 8348.36 | 620 | 609 | 149.3 |
| D | 12 | 233 | 278388 | 1860.1 | 620 | 609 | 149.3 |
| D | 2 | 249 | 210834 | 1407.74 | 620 | 609 | 149.3 |
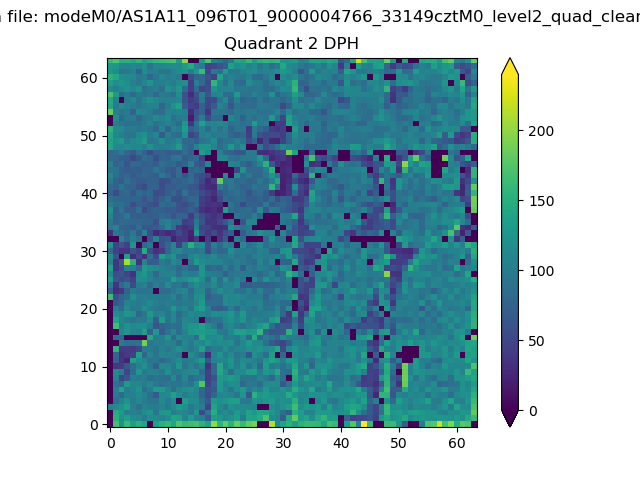
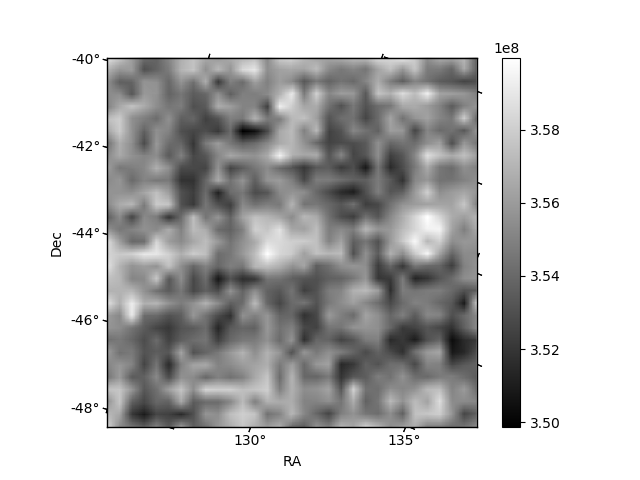
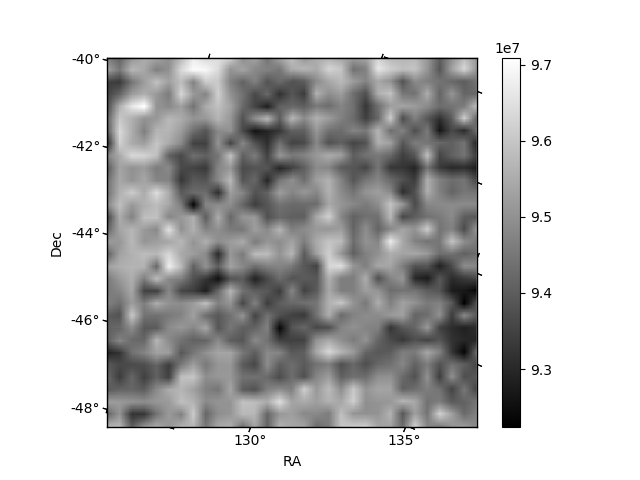
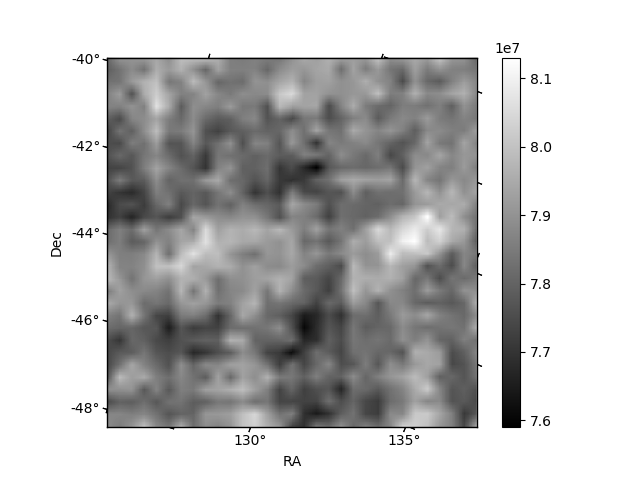
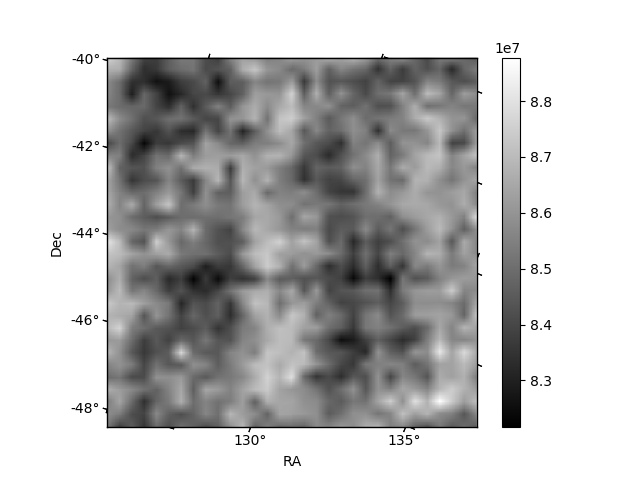
Histogram calculated using DETX and DETY for each event in the final _common_clean file
| Quadrant A | 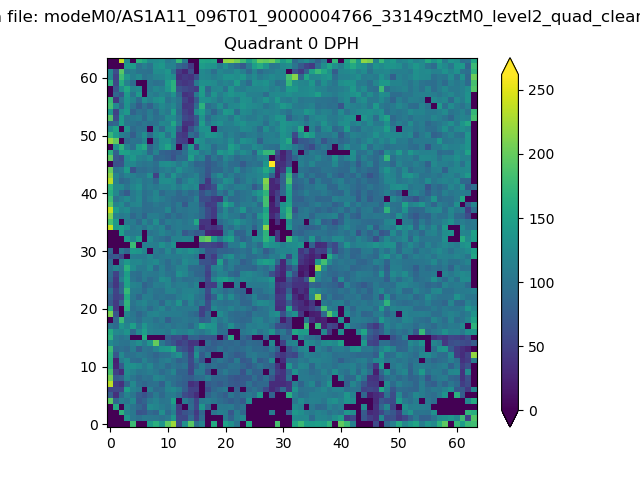 |
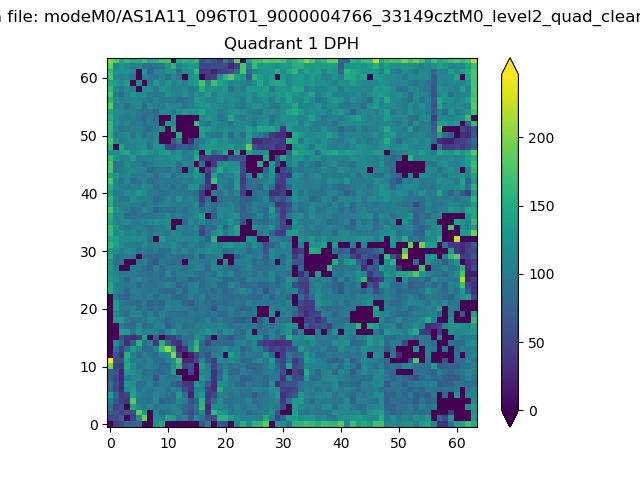 |
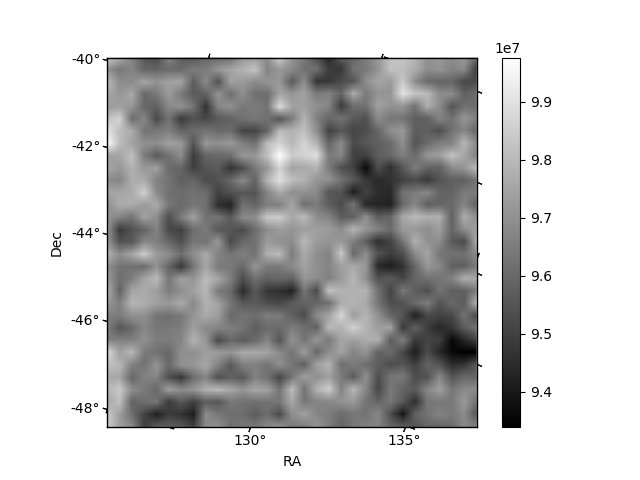
Quadrant B |
|---|---|---|---|
| Quadrant D | 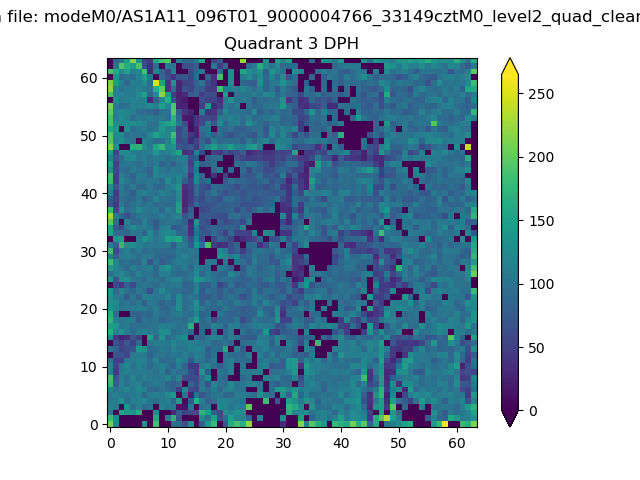 |
 |
Quadrant C |
| Plot type | Count rate plots | Images |
|---|---|---|
| Comparison with Poisson distribution Blue bars denote a histogram of data divided into 1 sec bins. Red curve is a Poisson curve with rate = median count rate of data. |
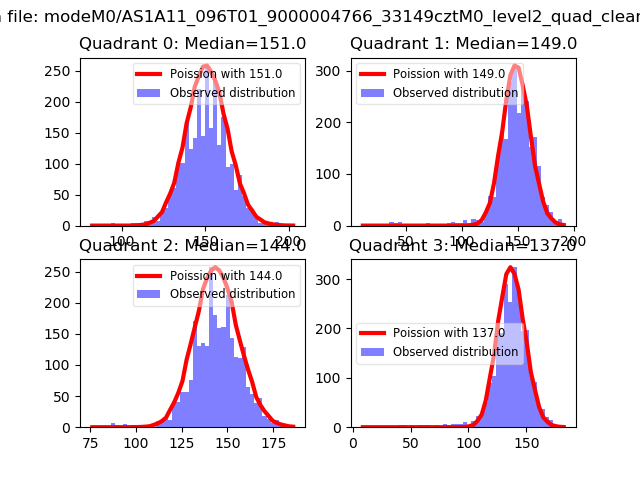 |
 |
| Quadrant-wise count rates Data is divided into 100 sec bins |
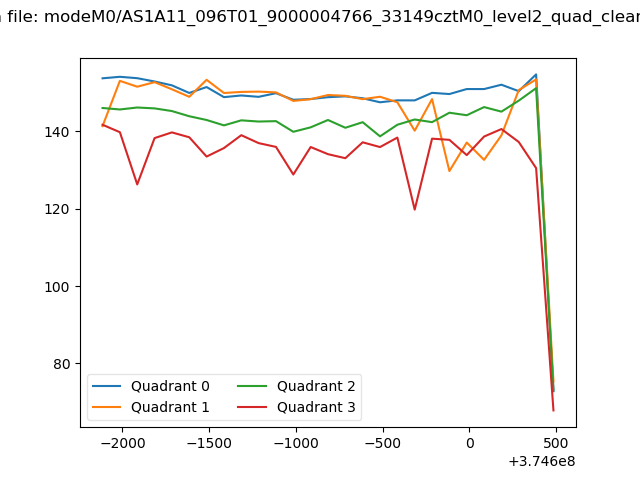 |
|
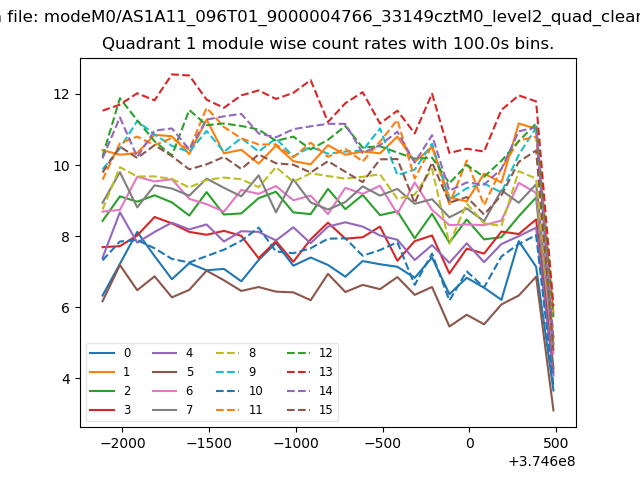
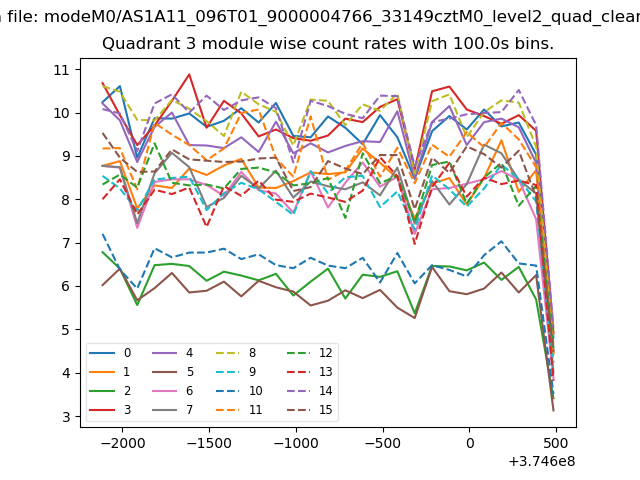
| Module-wise count rates for Quadrant A Data is divided into 100 sec bins |
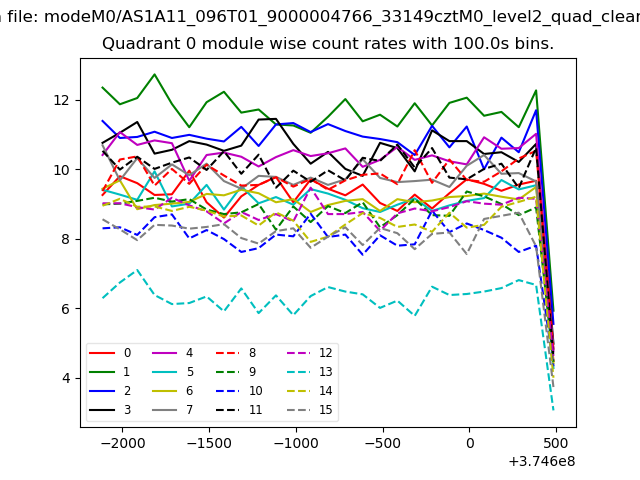 |
 |
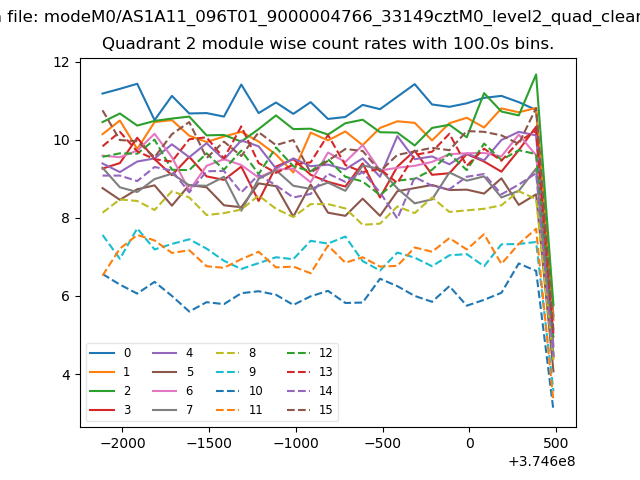
| Module-wise count rates for Quadrant B Data is divided into 100 sec bins |
 |
 |
| Module-wise count rates for Quadrant C Data is divided into 100 sec bins |
 |
 |
| Module-wise count rates for Quadrant D Data is divided into 100 sec bins |
 |
 |
| Parameter | Plot |
|---|---|
| CZT HV Monitor | 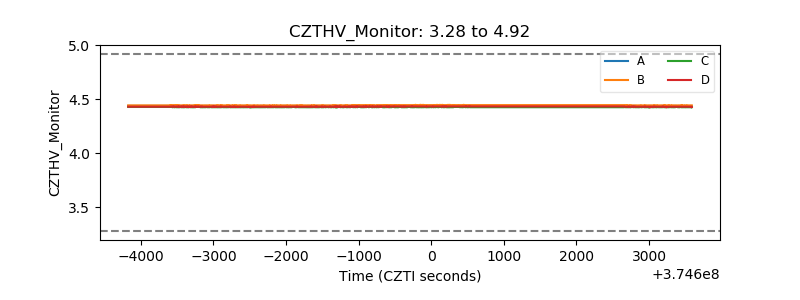 |
| D_VDD | 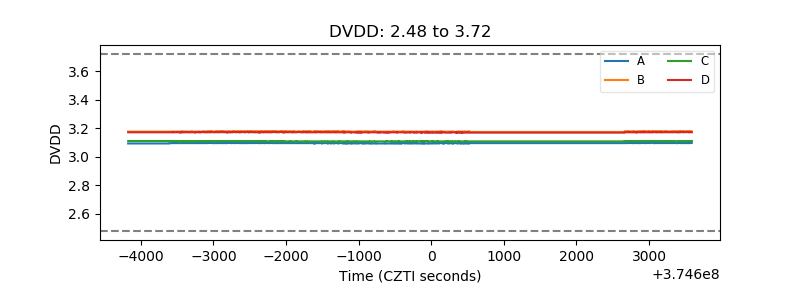 |
| Temperature 1 | 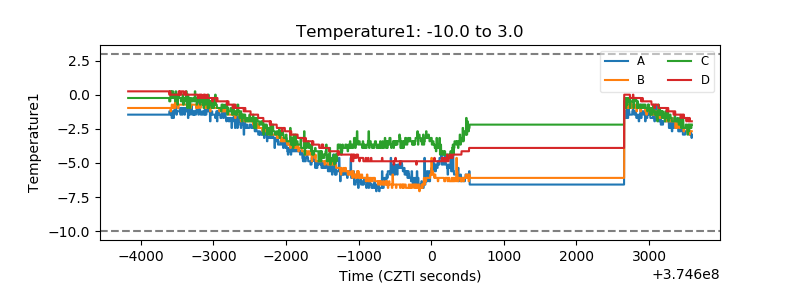 |
| Veto HV Monitor |  |
| Veto LLD | 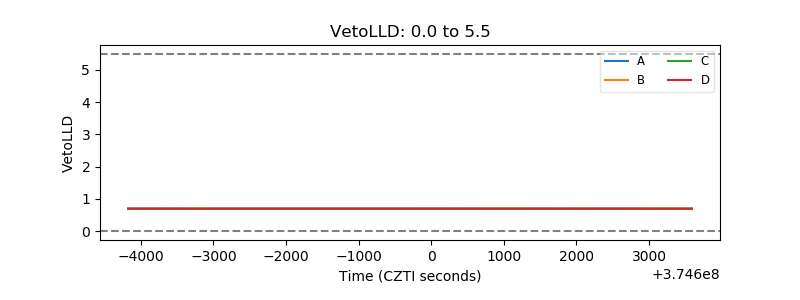 |
| Alpha Counter | 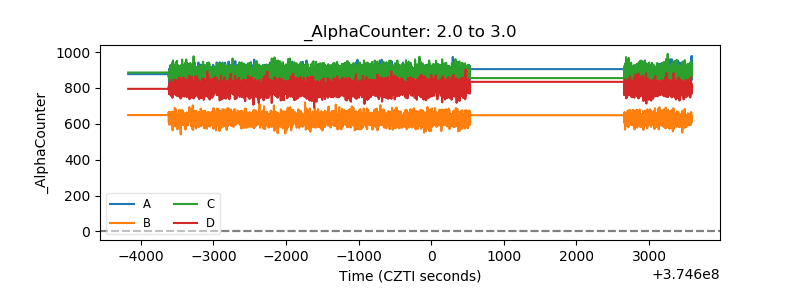 |
| _CPM_Rate | 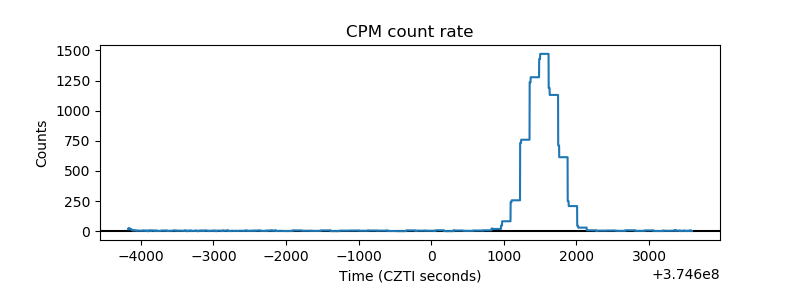 |
| CZT Counter | 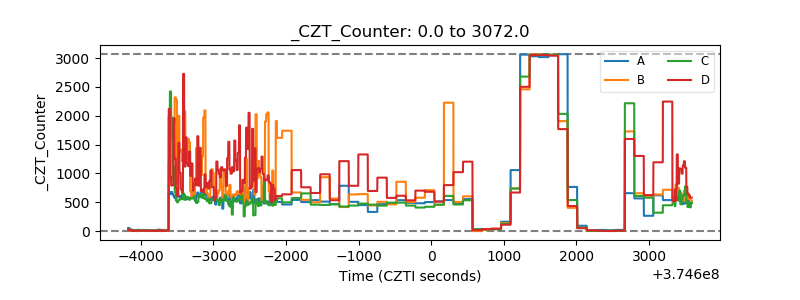 |
| +2.5 Volts monitor | 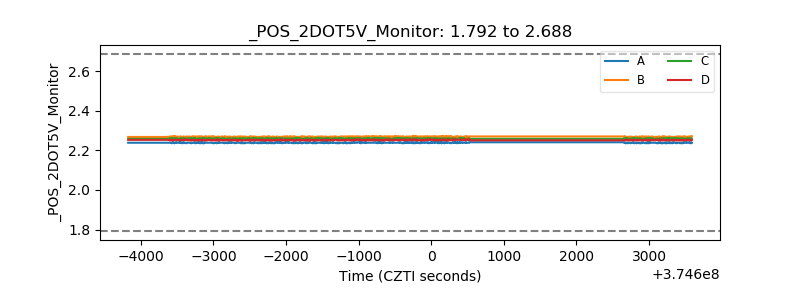 |
| +5 Volts monitor |  |
| _ROLL_ROT | 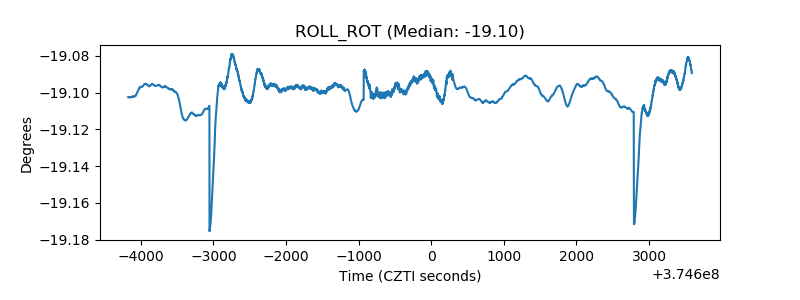 |
| _Roll_DEC | 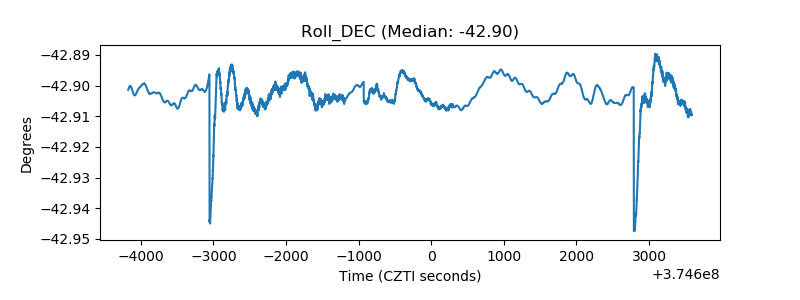 |
| _Roll_RA | 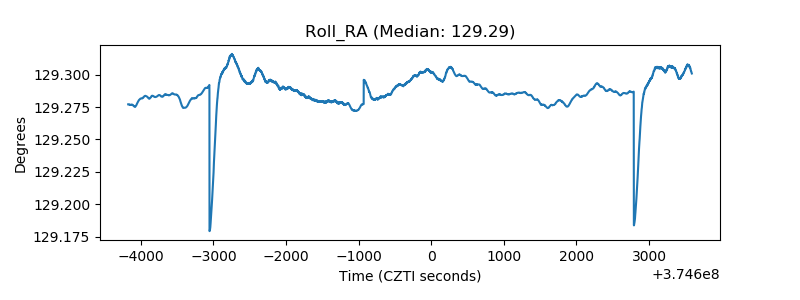 |
| Veto Counter | 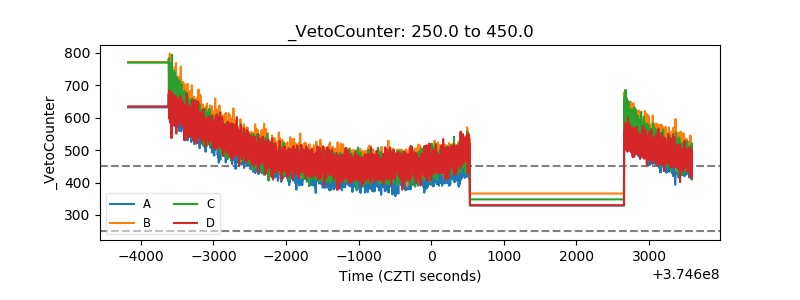 |