| Param | Original file | Final file |
|---|---|---|
| Filename | modeM0/AS1A11_096T01_9000004766_33150cztM0_level2.evt | modeM0/AS1A11_096T01_9000004766_33150cztM0_level2_quad_clean.evt |
| Size (bytes) | 438,468,480 | 70,960,320 |
| Size | 418.2 MB | 67.7 MB |
| Events in quadrant A | 2,461,178 | 462,932 |
| Events in quadrant B | 3,147,312 | 464,809 |
| Events in quadrant C | 2,710,991 | 446,304 |
| Events in quadrant D | 4,623,161 | 426,844 |
| Mode SS | |||
|---|---|---|---|
| Quadrant | BADHDUFLAG | Total packets | Discarded packets |
| A | 0 | 102 | 0 |
| B | 0 | 102 | 0 |
| C | 0 | 102 | 0 |
| D | 0 | 102 | 0 |
| Mode M0 | |||
|---|---|---|---|
| Quadrant | BADHDUFLAG | Total packets | Discarded packets |
| A | 0 | 10251 | 3 |
| B | 0 | 12680 | 2 |
| C | 0 | 11095 | 2 |
| D | 0 | 17257 | 2 |
| Mode M9 | |||
|---|---|---|---|
| Quadrant | BADHDUFLAG | Total packets | Discarded packets |
| A | 0 | 34 | 0 |
| B | 0 | 34 | 0 |
| C | 0 | 34 | 0 |
| D | 0 | 35 | 0 |
| Quadrant | Total seconds | Saturated seconds | Saturation percentage |
|---|---|---|---|
| A | 4958 | 6 | 0.121017% |
| B | 4958 | 45 | 0.907624% |
| C | 4958 | 94 | 1.895926% |
| D | 4958 | 251 | 5.062525% |
Noise dominated data is calculated using 1-second bins in cleaned event files. If a bin has >2000 counts, and if more than 50% of those come from <1% of pixels, then it is considered to be noise-dominated and hence unusable.
| Quadrant | # 1 sec bins | Bins with >0 counts | Bins with >2000 counts | High rate bins dominated by noise | Noise dominated (total time) | Noise dominated (detector-on time) | Marked lightcurve |
|---|---|---|---|---|---|---|---|
| A | 7050 | 4959 | 0 | 0 | 0.00% | 0.00% | 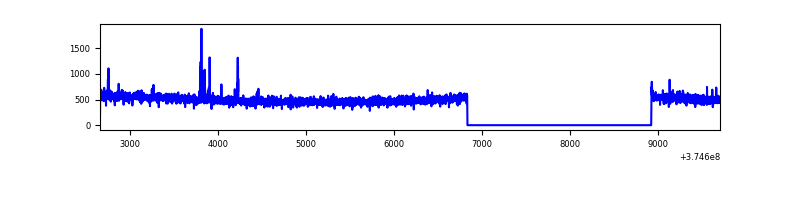 |
| B | 7050 | 4959 | 15 | 15 | 0.21% | 0.30% | 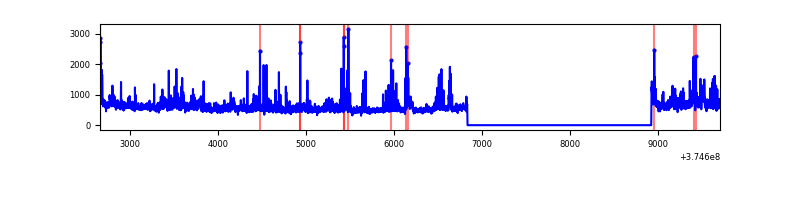 |
| C | 7050 | 4959 | 67 | 67 | 0.95% | 1.35% | 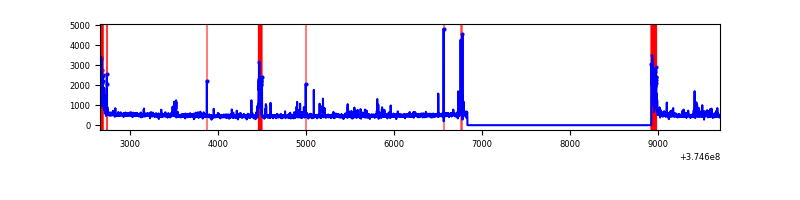 |
| D | 7050 | 4959 | 216 | 216 | 3.06% | 4.36% | 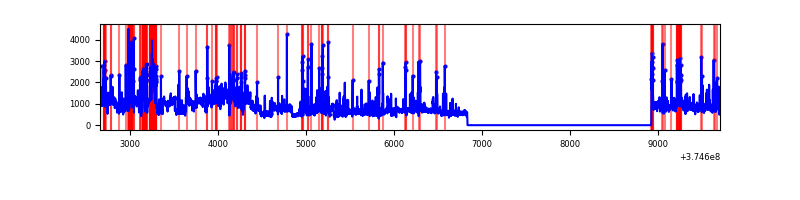 |
Top three noisy pixels from each quadrant. If the there are fewer than three noisy pixels in the level2.evt file, extra rows are filled as -1
| Pixel properties | Quadrant properties | ||||||
|---|---|---|---|---|---|---|---|
| Quadrant | DetID | PixID | Counts | Sigma | Mean | Median | Sigma |
| A | 14 | 235 | 29368 | 231.24 | 623 | 613 | 124.3 |
| A | 13 | 6 | 12911 | 98.9 | 623 | 613 | 124.3 |
| A | 13 | 254 | 9720 | 73.24 | 623 | 613 | 124.3 |
| B | 0 | 219 | 312217 | 2662.75 | 624 | 610 | 117.0 |
| B | 5 | 172 | 121726 | 1034.96 | 624 | 610 | 117.0 |
| B | 0 | 189 | 82596 | 700.59 | 624 | 610 | 117.0 |
| C | 0 | 10 | 193678 | 1402.32 | 592 | 597 | 137.7 |
| C | 9 | 187 | 73134 | 526.83 | 592 | 597 | 137.7 |
| C | 1 | 241 | 72068 | 519.09 | 592 | 597 | 137.7 |
| D | 8 | 195 | 1212950 | 8520.06 | 583 | 572 | 142.3 |
| D | 2 | 249 | 329889 | 2314.3 | 583 | 572 | 142.3 |
| D | 1 | 52 | 185413 | 1298.98 | 583 | 572 | 142.3 |
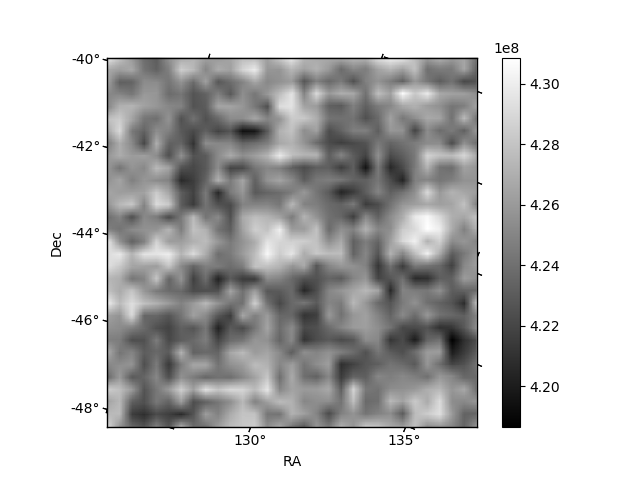
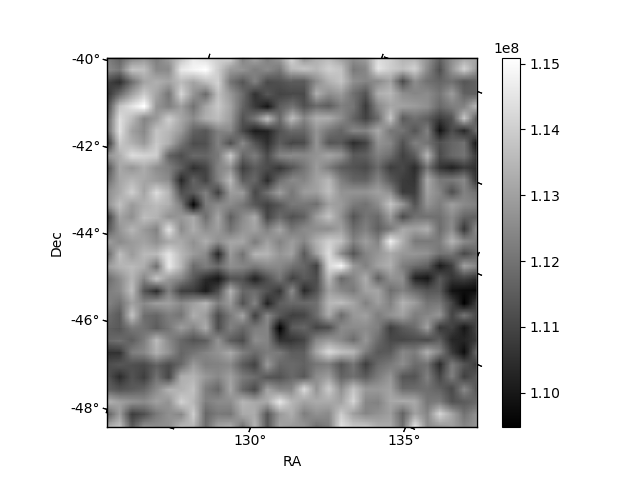
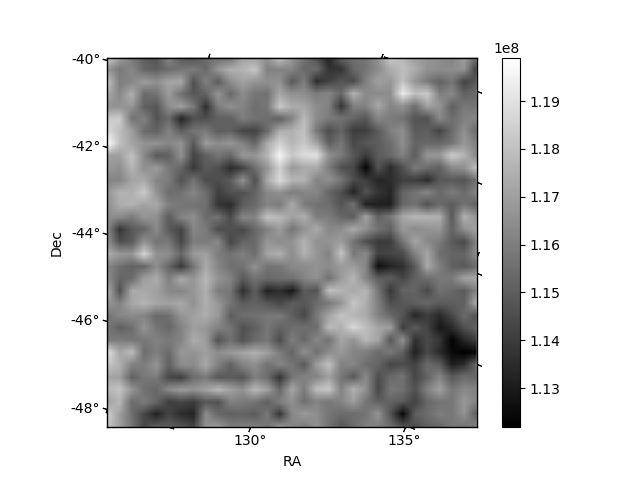
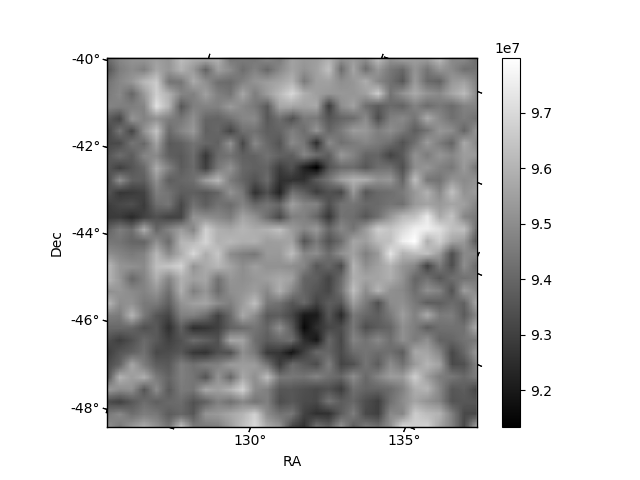
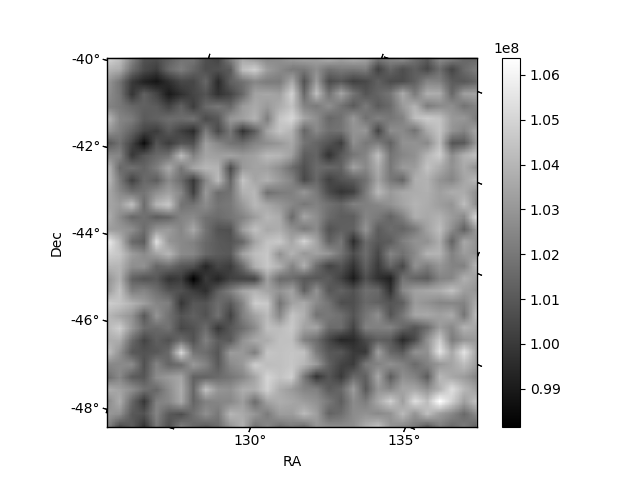
Histogram calculated using DETX and DETY for each event in the final _common_clean file
| Quadrant A | 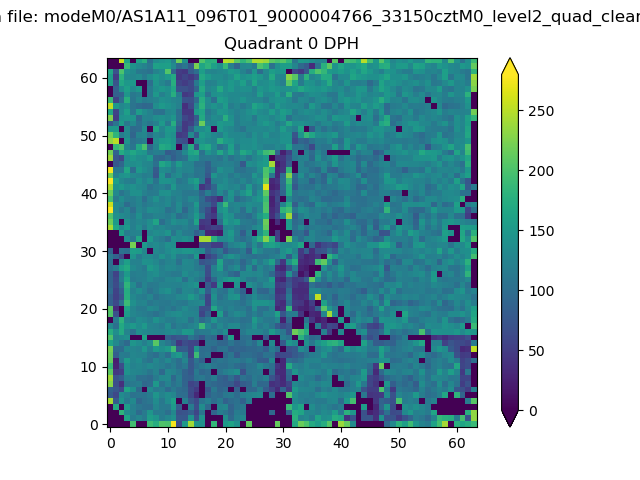 |
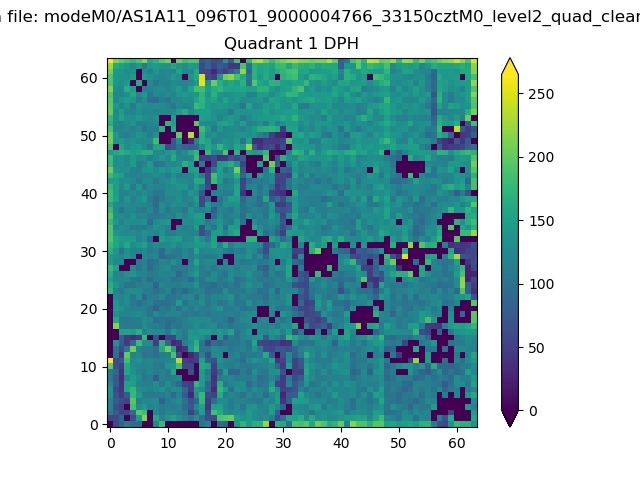 |
Quadrant B |
|---|---|---|---|
| Quadrant D | 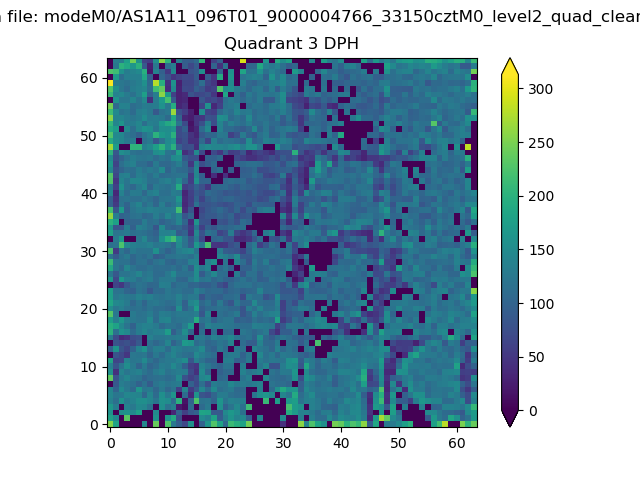 |
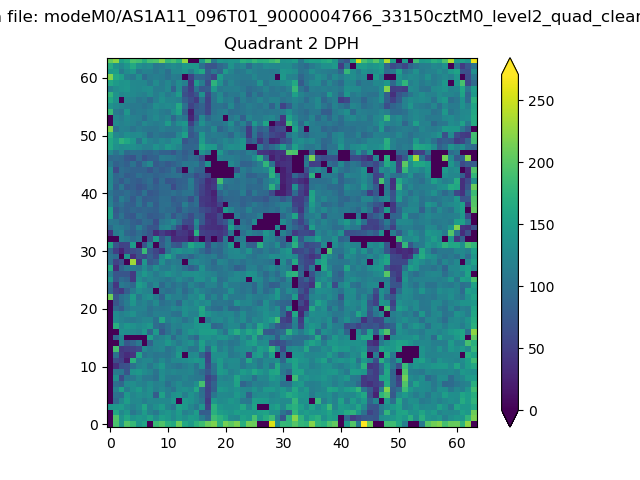 |
Quadrant C |
| Plot type | Count rate plots | Images |
|---|---|---|
| Comparison with Poisson distribution Blue bars denote a histogram of data divided into 1 sec bins. Red curve is a Poisson curve with rate = median count rate of data. |
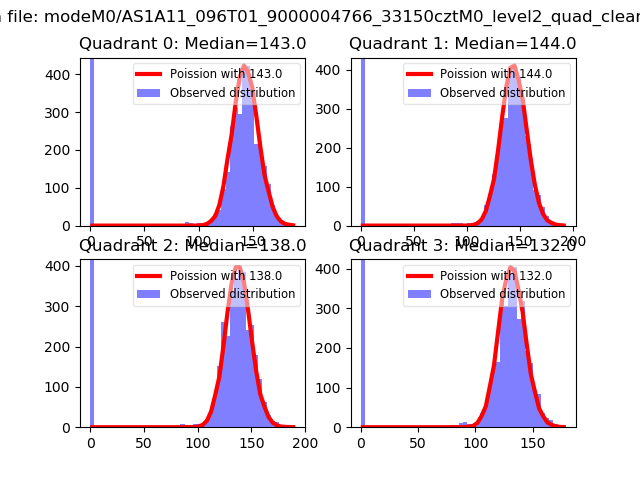 |
 |
| Quadrant-wise count rates Data is divided into 100 sec bins |
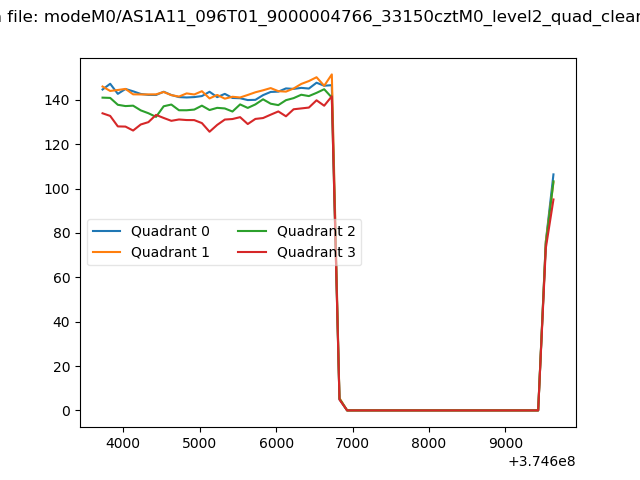 |
|
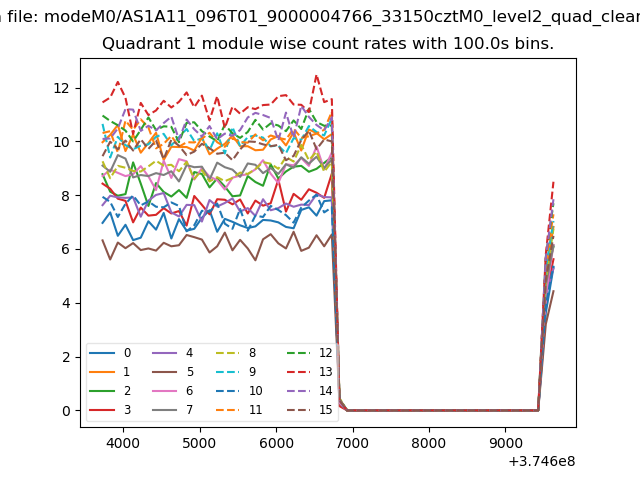
| Module-wise count rates for Quadrant A Data is divided into 100 sec bins |
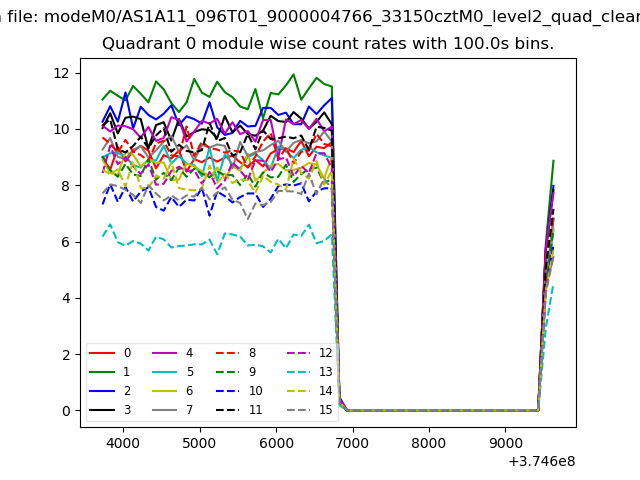 |
 |
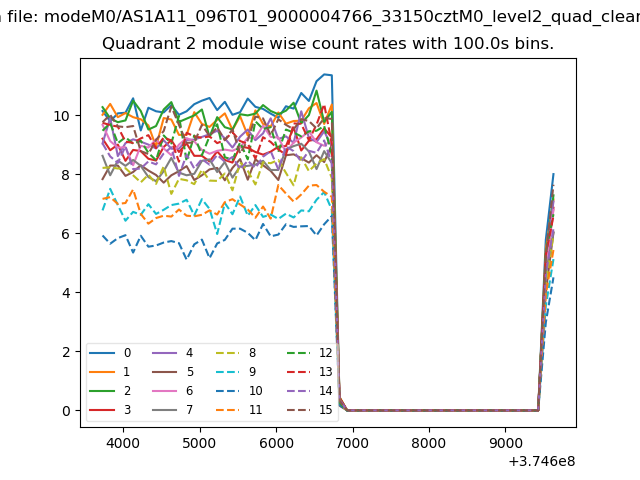
| Module-wise count rates for Quadrant B Data is divided into 100 sec bins |
 |
 |
| Module-wise count rates for Quadrant C Data is divided into 100 sec bins |
 |
 |
| Module-wise count rates for Quadrant D Data is divided into 100 sec bins |
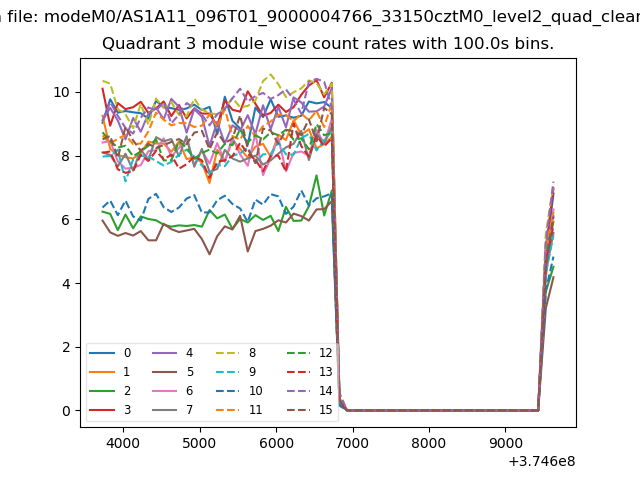 |
 |
| Parameter | Plot |
|---|---|
| CZT HV Monitor | 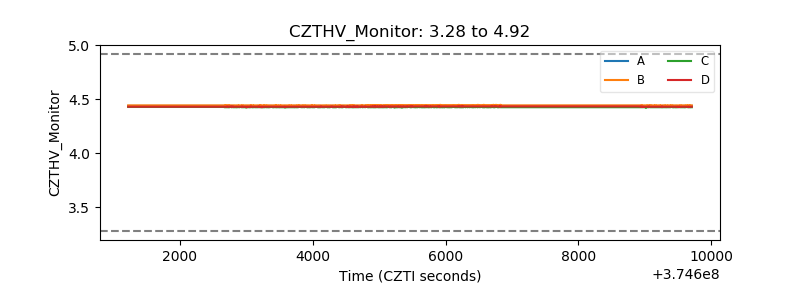 |
| D_VDD |  |
| Temperature 1 | 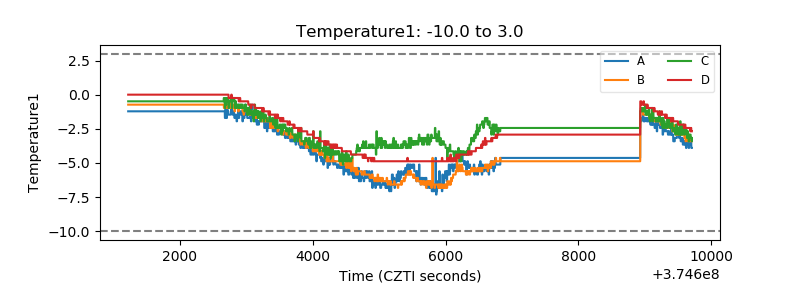 |
| Veto HV Monitor | 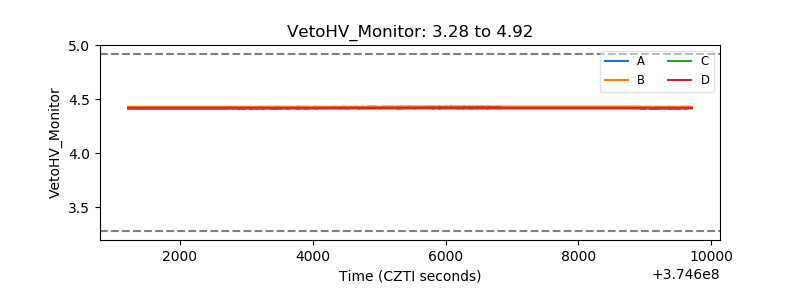 |
| Veto LLD | 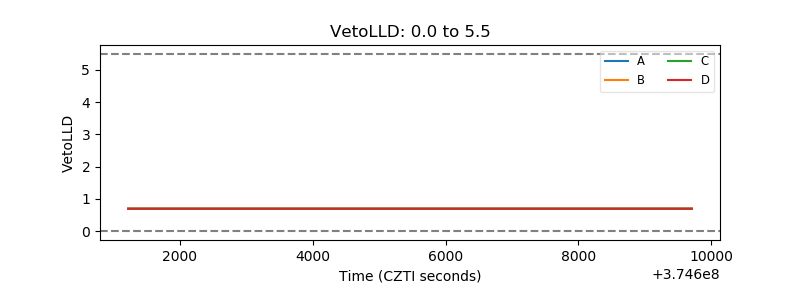 |
| Alpha Counter | 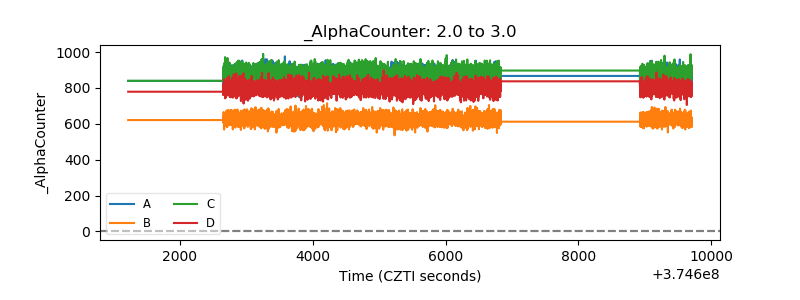 |
| _CPM_Rate | 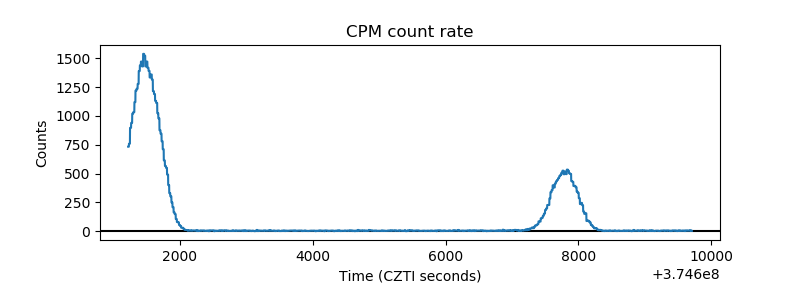 |
| CZT Counter | 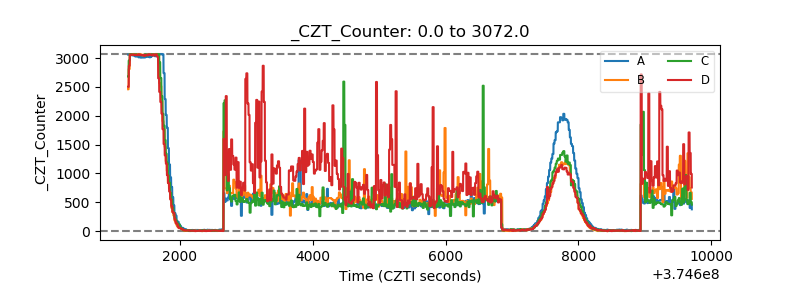 |
| +2.5 Volts monitor | 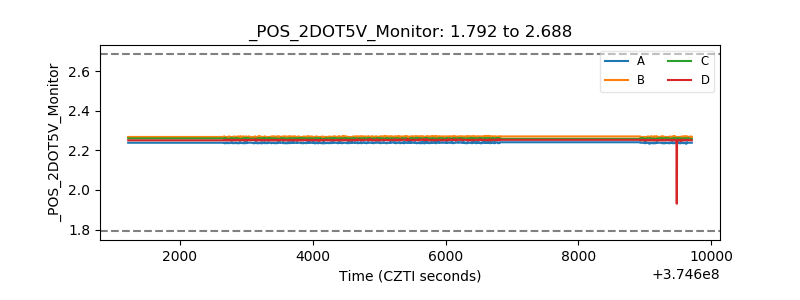 |
| +5 Volts monitor |  |
| _ROLL_ROT | 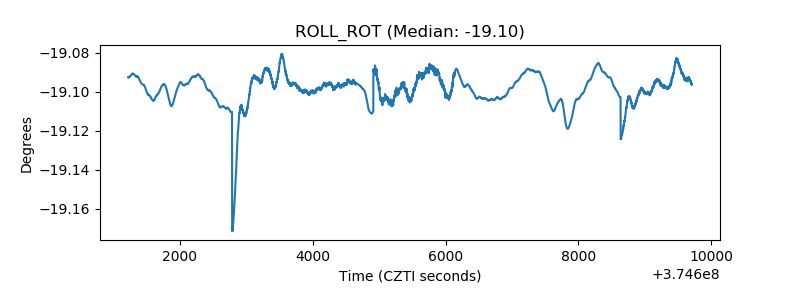 |
| _Roll_DEC | 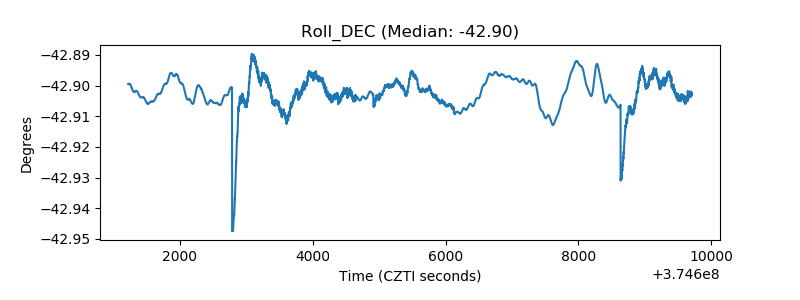 |
| _Roll_RA | 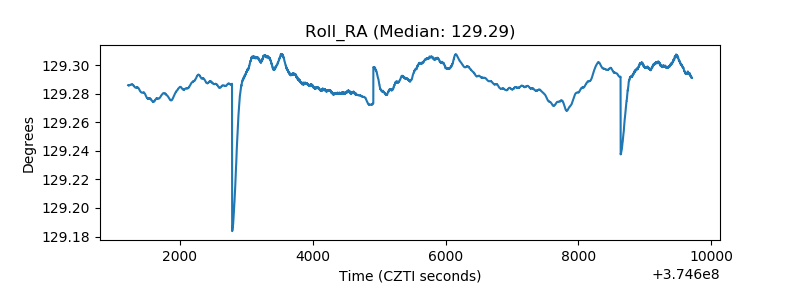 |
| Veto Counter | 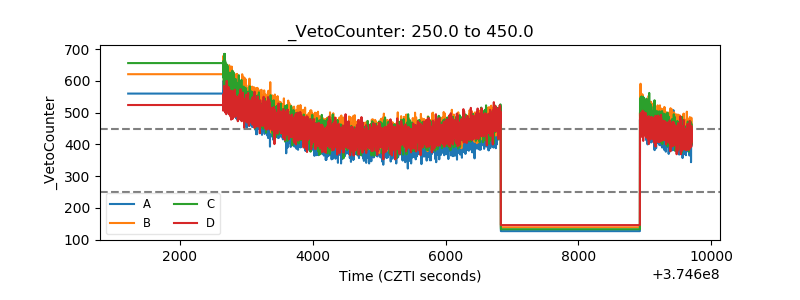 |