| Param | Original file | Final file |
|---|---|---|
| Filename | modeM0/AS1A11_096T01_9000004766_33151cztM0_level2.evt | modeM0/AS1A11_096T01_9000004766_33151cztM0_level2_quad_clean.evt |
| Size (bytes) | 510,318,720 | 83,949,120 |
| Size | 486.7 MB | 80.1 MB |
| Events in quadrant A | 2,402,111 | 576,617 |
| Events in quadrant B | 3,411,780 | 574,324 |
| Events in quadrant C | 3,217,658 | 549,802 |
| Events in quadrant D | 6,074,869 | 480,547 |
| Mode SS | |||
|---|---|---|---|
| Quadrant | BADHDUFLAG | Total packets | Discarded packets |
| A | 0 | 106 | 0 |
| B | 0 | 106 | 0 |
| C | 0 | 106 | 0 |
| D | 0 | 106 | 0 |
| Mode M0 | |||
|---|---|---|---|
| Quadrant | BADHDUFLAG | Total packets | Discarded packets |
| A | 0 | 10394 | 3 |
| B | 0 | 13559 | 2 |
| C | 0 | 12848 | 2 |
| D | 0 | 21633 | 2 |
| Mode M9 | |||
|---|---|---|---|
| Quadrant | BADHDUFLAG | Total packets | Discarded packets |
| A | 0 | 25 | 0 |
| B | 0 | 25 | 0 |
| C | 0 | 25 | 0 |
| D | 0 | 26 | 0 |
| Quadrant | Total seconds | Saturated seconds | Saturation percentage |
|---|---|---|---|
| A | 5140 | 7 | 0.136187% |
| B | 5140 | 98 | 1.906615% |
| C | 5140 | 232 | 4.513619% |
| D | 5140 | 1007 | 19.591440% |
Noise dominated data is calculated using 1-second bins in cleaned event files. If a bin has >2000 counts, and if more than 50% of those come from <1% of pixels, then it is considered to be noise-dominated and hence unusable.
| Quadrant | # 1 sec bins | Bins with >0 counts | Bins with >2000 counts | High rate bins dominated by noise | Noise dominated (total time) | Noise dominated (detector-on time) | Marked lightcurve |
|---|---|---|---|---|---|---|---|
| A | 7022 | 5141 | 0 | 0 | 0.00% | 0.00% | 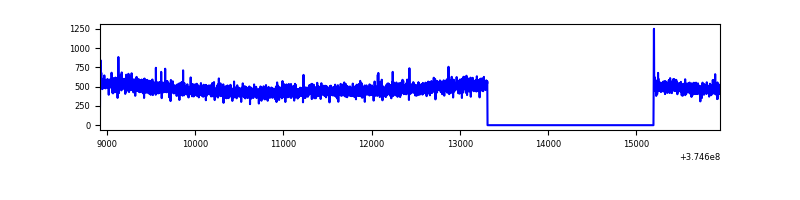 |
| B | 7022 | 5141 | 44 | 44 | 0.63% | 0.86% | 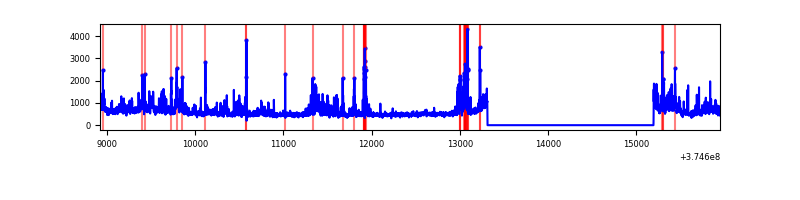 |
| C | 7022 | 5141 | 189 | 189 | 2.69% | 3.68% | 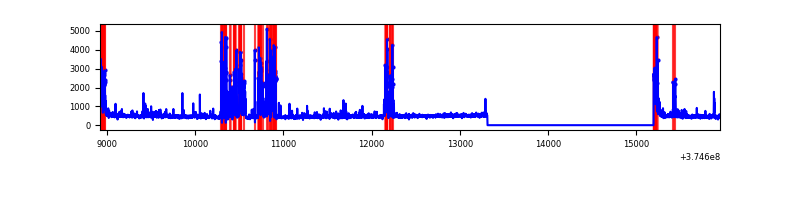 |
| D | 7022 | 5141 | 810 | 810 | 11.54% | 15.76% | 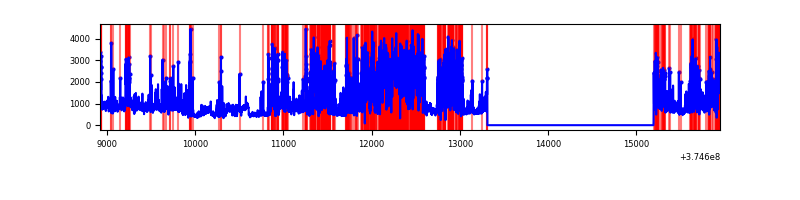 |
Top three noisy pixels from each quadrant. If the there are fewer than three noisy pixels in the level2.evt file, extra rows are filled as -1
| Pixel properties | Quadrant properties | ||||||
|---|---|---|---|---|---|---|---|
| Quadrant | DetID | PixID | Counts | Sigma | Mean | Median | Sigma |
| A | 13 | 6 | 11718 | 90.31 | 615 | 604 | 123.1 |
| A | 13 | 254 | 9658 | 73.57 | 615 | 604 | 123.1 |
| A | 14 | 235 | 6515 | 48.03 | 615 | 604 | 123.1 |
| B | 0 | 219 | 471011 | 4041.85 | 614 | 601 | 116.4 |
| B | 0 | 189 | 200290 | 1715.76 | 614 | 601 | 116.4 |
| B | 5 | 172 | 140025 | 1197.96 | 614 | 601 | 116.4 |
| C | 1 | 241 | 590543 | 4346.44 | 582 | 586 | 135.7 |
| C | 0 | 10 | 207336 | 1523.21 | 582 | 586 | 135.7 |
| C | 9 | 187 | 70978 | 518.6 | 582 | 586 | 135.7 |
| D | 2 | 250 | 2451405 | 18240.31 | 542 | 530 | 134.4 |
| D | 8 | 195 | 719990 | 5354.48 | 542 | 530 | 134.4 |
| D | 12 | 218 | 174311 | 1293.34 | 542 | 530 | 134.4 |
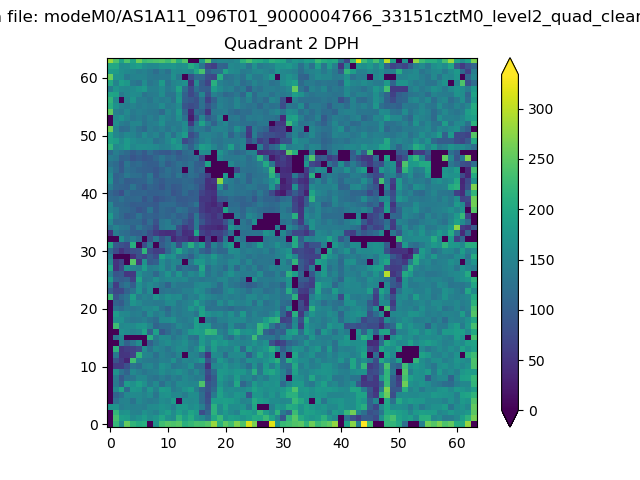
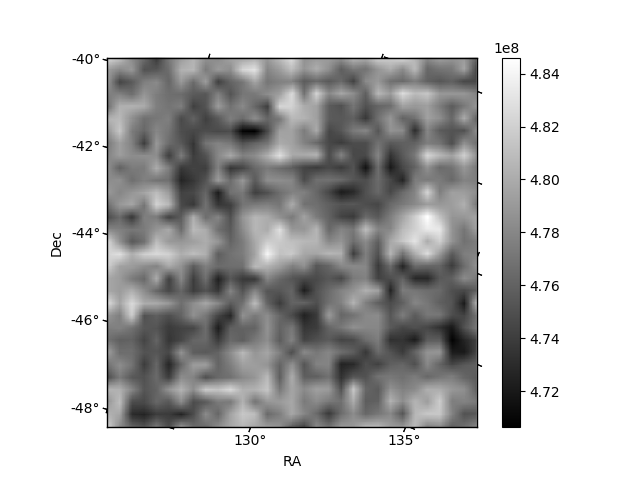
Histogram calculated using DETX and DETY for each event in the final _common_clean file
| Quadrant A | 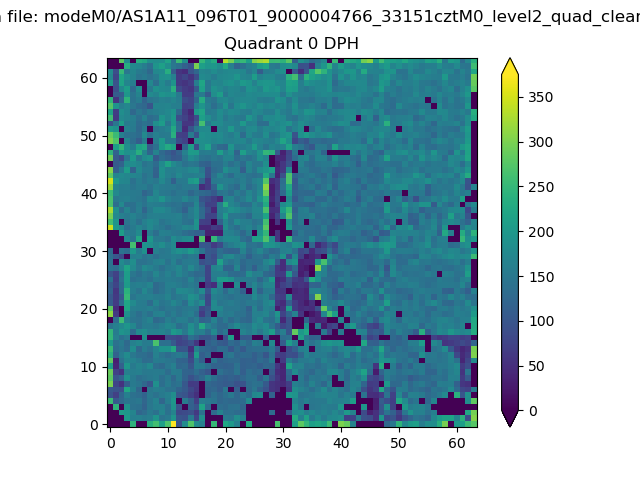 |
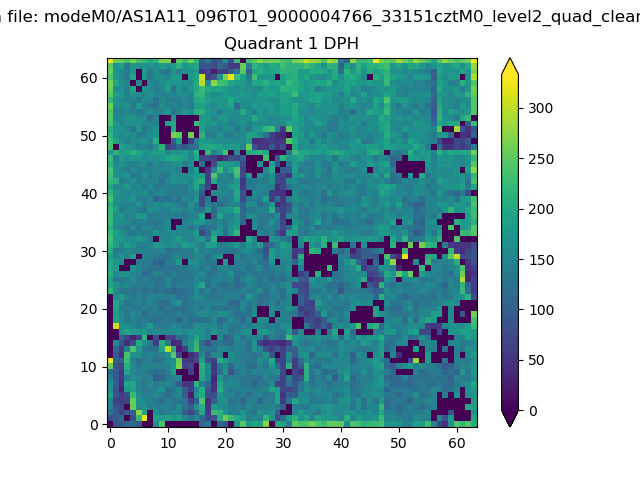 |
Quadrant B |
|---|---|---|---|
| Quadrant D | 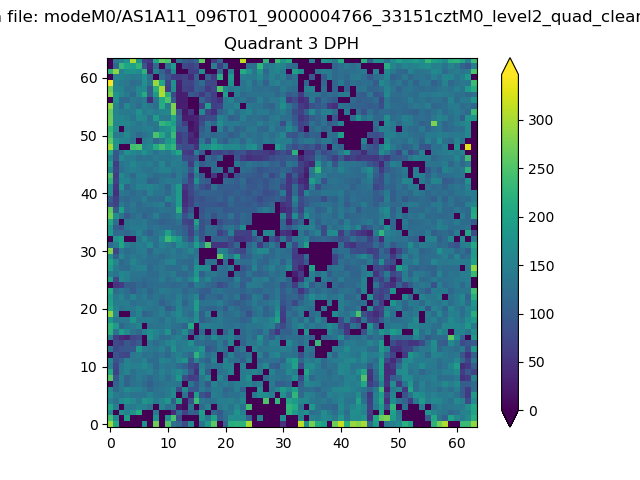 |
 |
Quadrant C |
| Plot type | Count rate plots | Images |
|---|---|---|
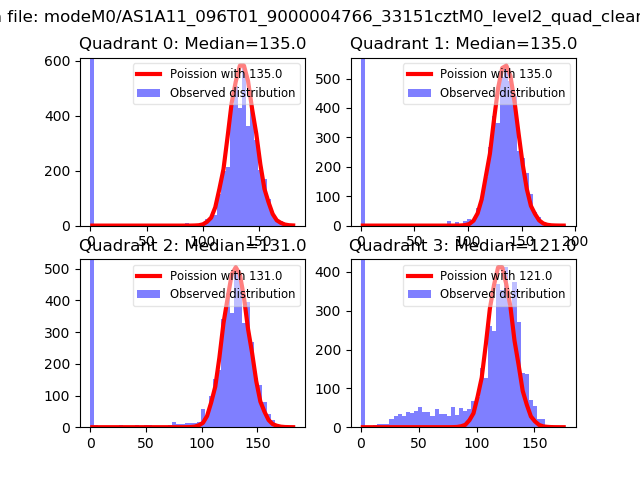
| Comparison with Poisson distribution Blue bars denote a histogram of data divided into 1 sec bins. Red curve is a Poisson curve with rate = median count rate of data. |
 |
 |
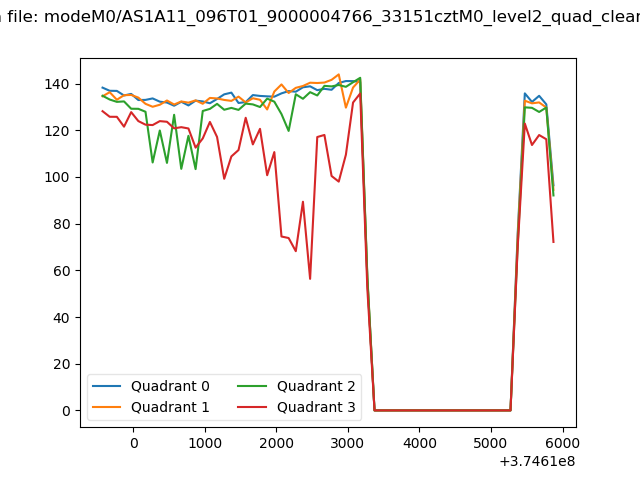
| Quadrant-wise count rates Data is divided into 100 sec bins |
 |
|
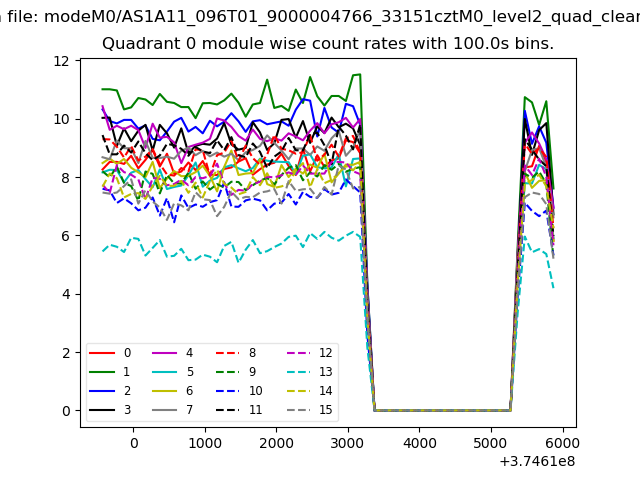
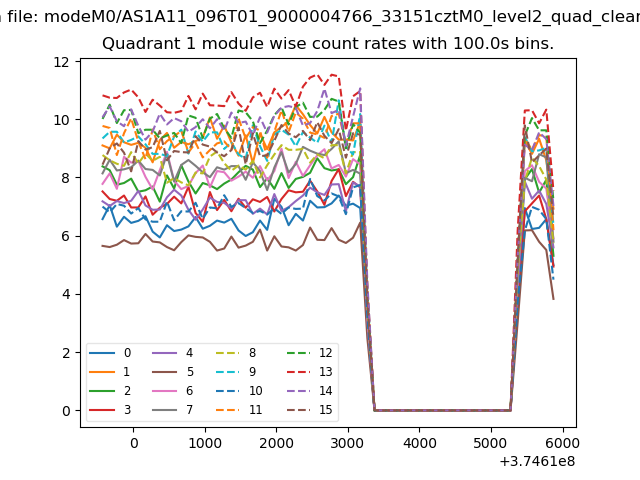
| Module-wise count rates for Quadrant A Data is divided into 100 sec bins |
 |
 |
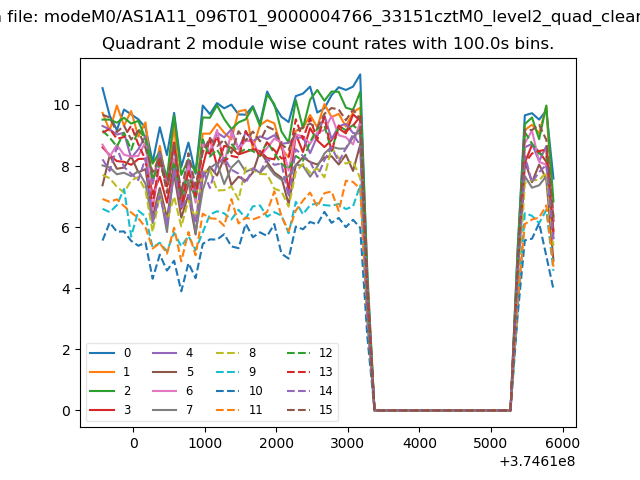
| Module-wise count rates for Quadrant B Data is divided into 100 sec bins |
 |
 |
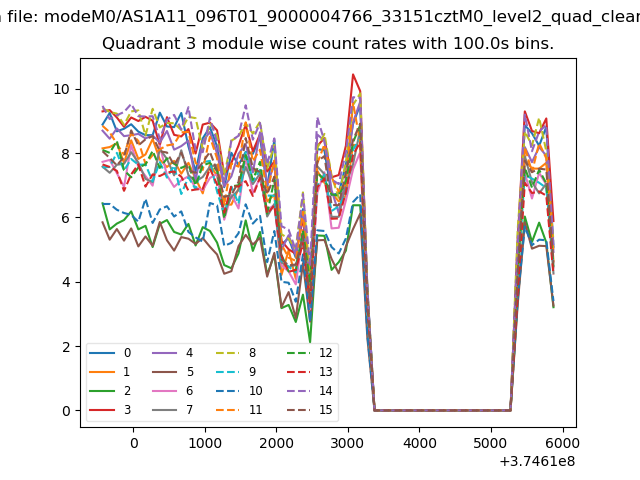
| Module-wise count rates for Quadrant C Data is divided into 100 sec bins |
 |
 |
| Module-wise count rates for Quadrant D Data is divided into 100 sec bins |
 |
 |
| Parameter | Plot |
|---|---|
| CZT HV Monitor | 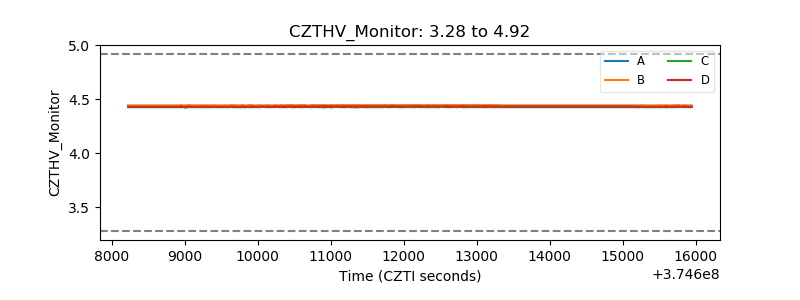 |
| D_VDD | 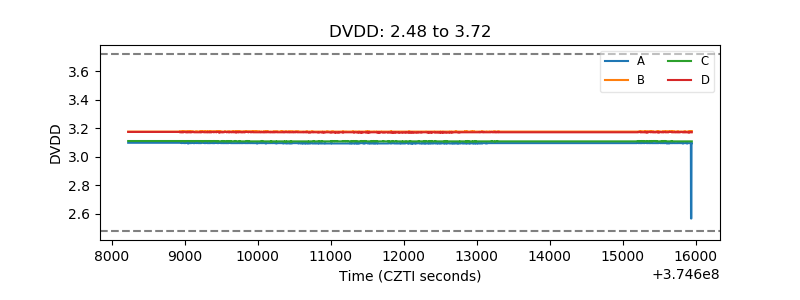 |
| Temperature 1 | 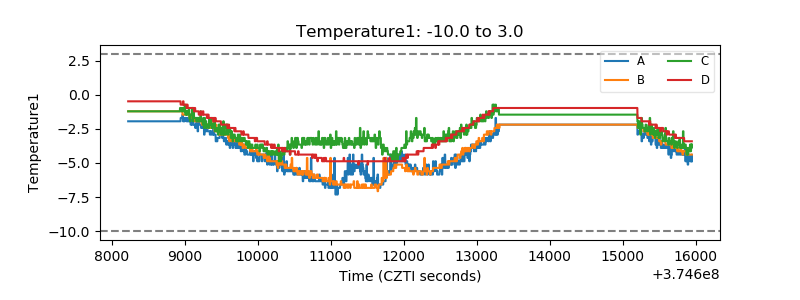 |
| Veto HV Monitor |  |
| Veto LLD | 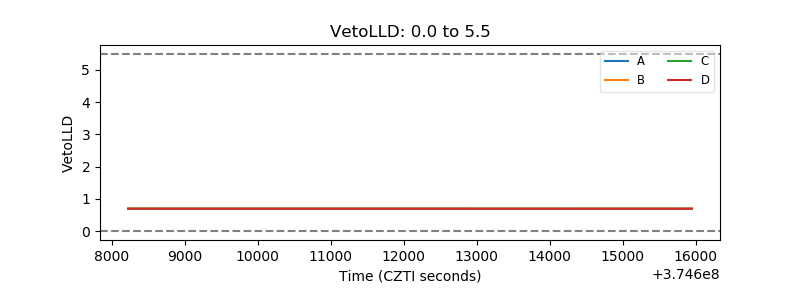 |
| Alpha Counter | 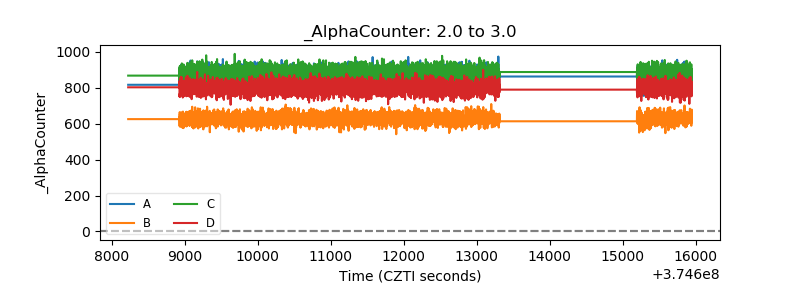 |
| _CPM_Rate | 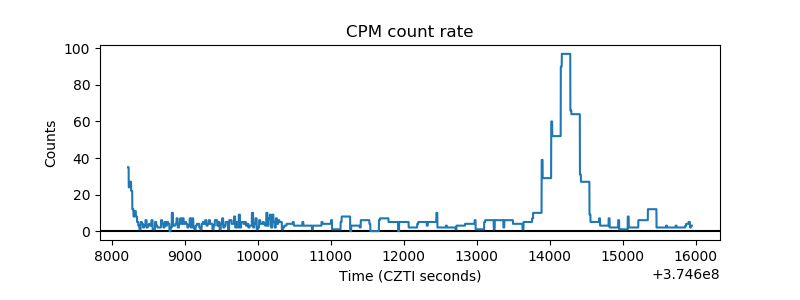 |
| CZT Counter | 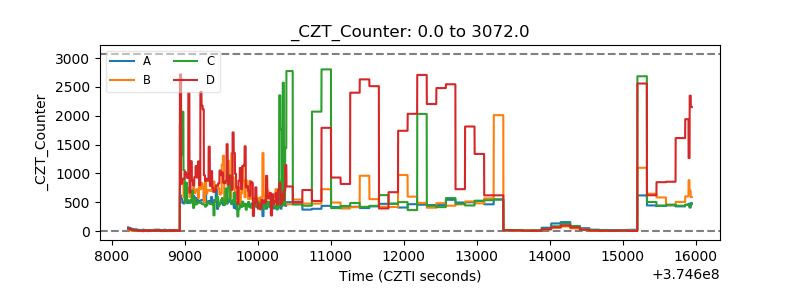 |
| +2.5 Volts monitor | 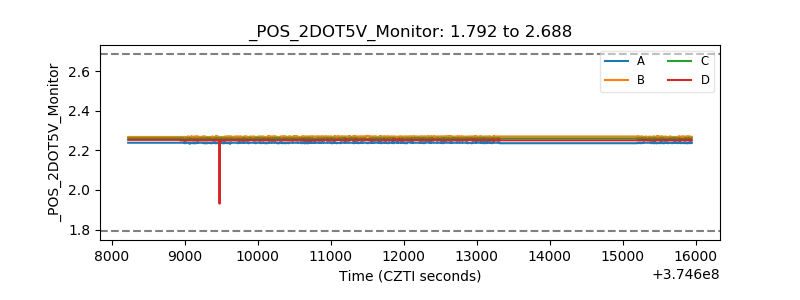 |
| +5 Volts monitor | 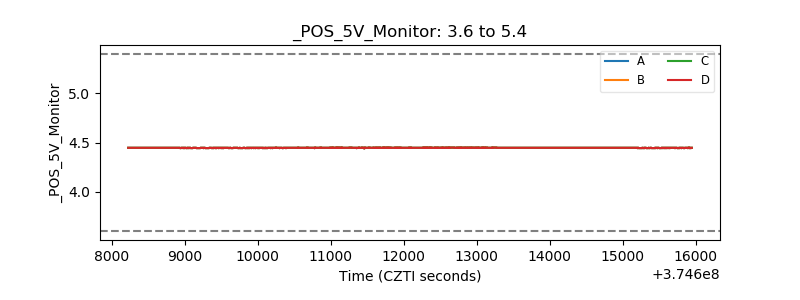 |
| _ROLL_ROT | 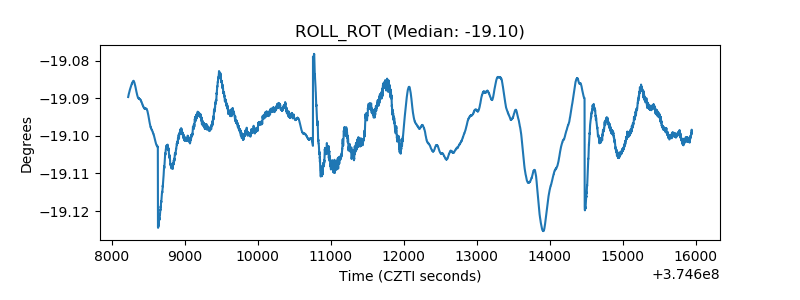 |
| _Roll_DEC | 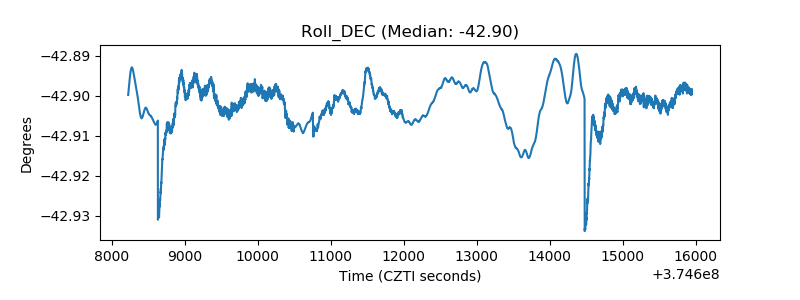 |
| _Roll_RA | 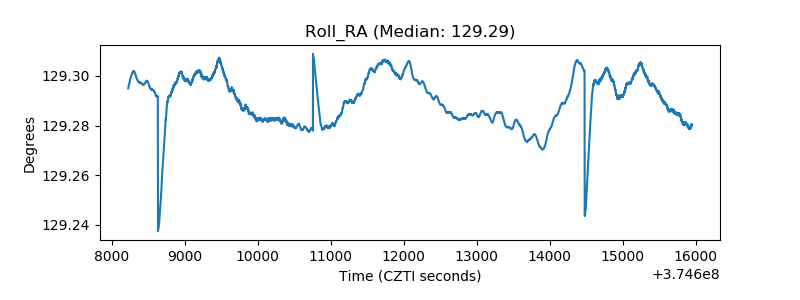 |
| Veto Counter | 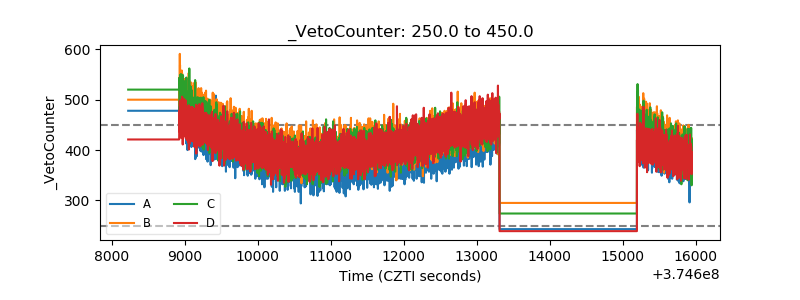 |