| Param | Original file | Final file |
|---|---|---|
| Filename | modeM0/AS1A11_096T01_9000004766_33153cztM0_level2.evt | modeM0/AS1A11_096T01_9000004766_33153cztM0_level2_quad_clean.evt |
| Size (bytes) | 527,175,360 | 85,982,400 |
| Size | 502.8 MB | 82.0 MB |
| Events in quadrant A | 2,675,244 | 566,958 |
| Events in quadrant B | 4,094,097 | 565,239 |
| Events in quadrant C | 3,000,011 | 551,922 |
| Events in quadrant D | 5,799,176 | 510,180 |
| Mode SS | |||
|---|---|---|---|
| Quadrant | BADHDUFLAG | Total packets | Discarded packets |
| A | 0 | 118 | 0 |
| B | 0 | 118 | 0 |
| C | 0 | 118 | 0 |
| D | 0 | 118 | 0 |
| Mode M0 | |||
|---|---|---|---|
| Quadrant | BADHDUFLAG | Total packets | Discarded packets |
| A | 0 | 11852 | 3 |
| B | 0 | 16185 | 2 |
| C | 0 | 12842 | 2 |
| D | 0 | 21395 | 2 |
| Mode M9 | |||
|---|---|---|---|
| Quadrant | BADHDUFLAG | Total packets | Discarded packets |
| A | 0 | 20 | 0 |
| B | 0 | 20 | 0 |
| C | 0 | 20 | 0 |
| D | 0 | 21 | 0 |
| Quadrant | Total seconds | Saturated seconds | Saturation percentage |
|---|---|---|---|
| A | 5863 | 7 | 0.119393% |
| B | 5863 | 439 | 7.487634% |
| C | 5863 | 95 | 1.620331% |
| D | 5863 | 385 | 6.566604% |
Noise dominated data is calculated using 1-second bins in cleaned event files. If a bin has >2000 counts, and if more than 50% of those come from <1% of pixels, then it is considered to be noise-dominated and hence unusable.
| Quadrant | # 1 sec bins | Bins with >0 counts | Bins with >2000 counts | High rate bins dominated by noise | Noise dominated (total time) | Noise dominated (detector-on time) | Marked lightcurve |
|---|---|---|---|---|---|---|---|
| A | 7204 | 5864 | 0 | 0 | 0.00% | 0.00% | 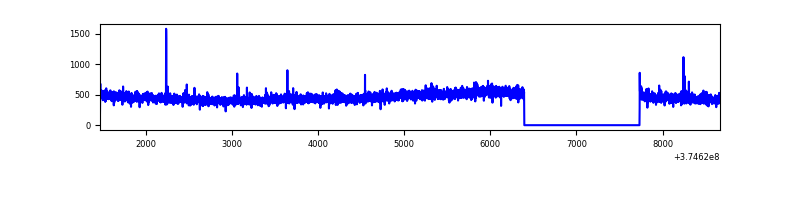 |
| B | 7204 | 5864 | 122 | 122 | 1.69% | 2.08% | 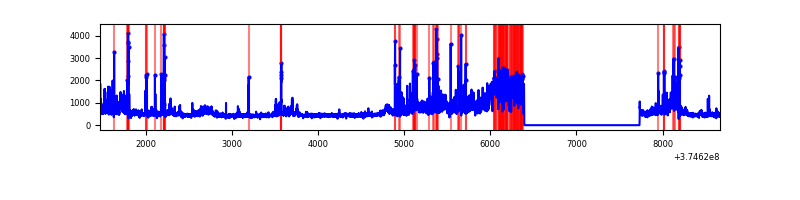 |
| C | 7204 | 5864 | 74 | 74 | 1.03% | 1.26% | 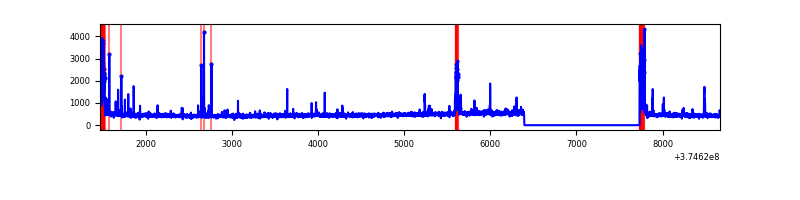 |
| D | 7204 | 5864 | 289 | 289 | 4.01% | 4.93% | 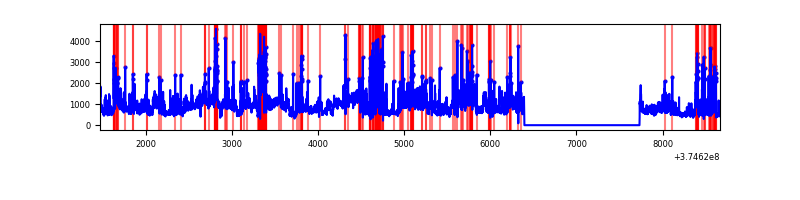 |
Top three noisy pixels from each quadrant. If the there are fewer than three noisy pixels in the level2.evt file, extra rows are filled as -1
| Pixel properties | Quadrant properties | ||||||
|---|---|---|---|---|---|---|---|
| Quadrant | DetID | PixID | Counts | Sigma | Mean | Median | Sigma |
| A | 13 | 6 | 10236 | 69.13 | 686 | 672 | 138.4 |
| A | 13 | 254 | 10091 | 68.08 | 686 | 672 | 138.4 |
| A | 0 | 31 | 7796 | 51.49 | 686 | 672 | 138.4 |
| B | 0 | 219 | 659316 | 5140.22 | 671 | 654 | 128.1 |
| B | 5 | 172 | 329057 | 2562.87 | 671 | 654 | 128.1 |
| B | 0 | 189 | 202046 | 1571.67 | 671 | 654 | 128.1 |
| C | 0 | 10 | 210781 | 1359.75 | 664 | 670 | 154.5 |
| C | 1 | 241 | 112008 | 720.53 | 664 | 670 | 154.5 |
| C | 9 | 187 | 21361 | 133.9 | 664 | 670 | 154.5 |
| D | 8 | 195 | 1777015 | 10872.76 | 646 | 630 | 163.4 |
| D | 2 | 250 | 649689 | 3972.71 | 646 | 630 | 163.4 |
| D | 2 | 249 | 422928 | 2584.77 | 646 | 630 | 163.4 |
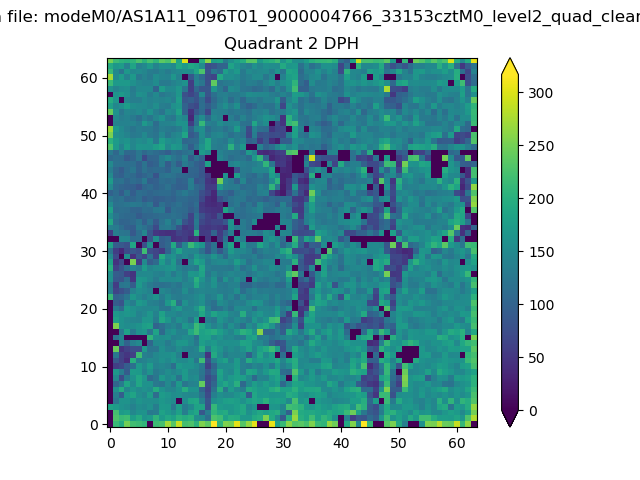
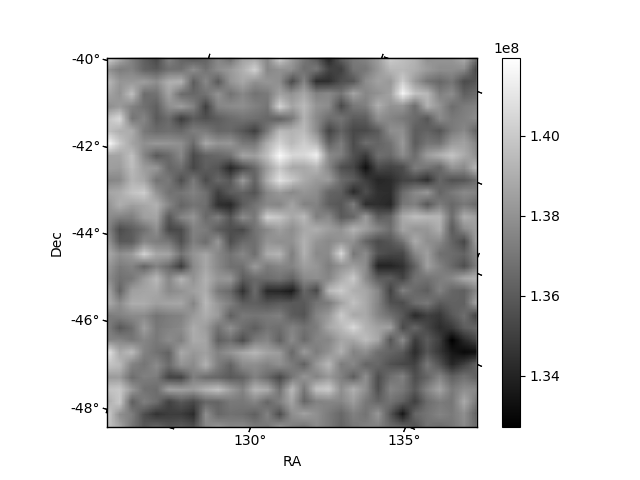
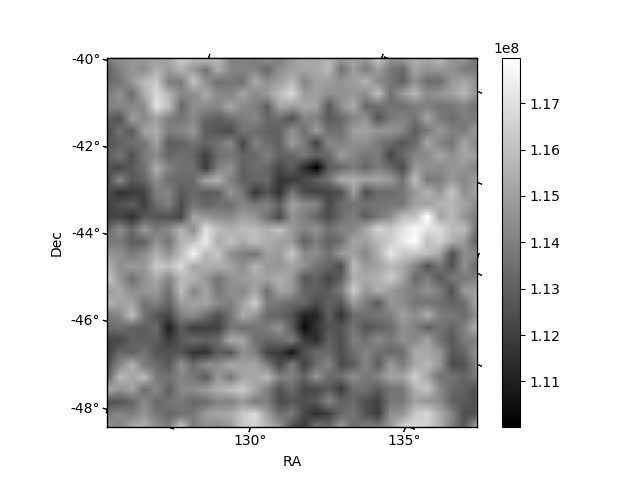
Histogram calculated using DETX and DETY for each event in the final _common_clean file
| Quadrant A | 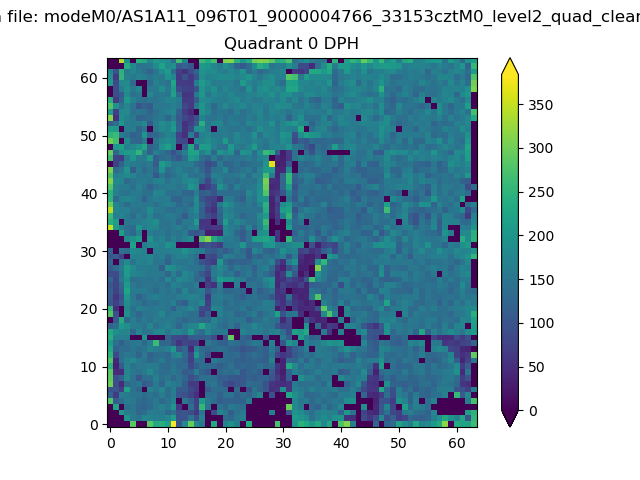 |
 |
Quadrant B |
|---|---|---|---|
| Quadrant D |  |
 |
Quadrant C |
| Plot type | Count rate plots | Images |
|---|---|---|
| Comparison with Poisson distribution Blue bars denote a histogram of data divided into 1 sec bins. Red curve is a Poisson curve with rate = median count rate of data. |
 |
 |
| Quadrant-wise count rates Data is divided into 100 sec bins |
 |
|
| Module-wise count rates for Quadrant A Data is divided into 100 sec bins |
 |
 |
| Module-wise count rates for Quadrant B Data is divided into 100 sec bins |
 |
 |
| Module-wise count rates for Quadrant C Data is divided into 100 sec bins |
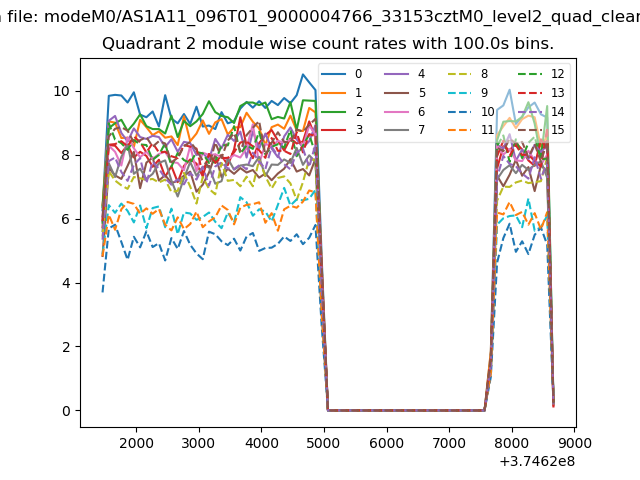 |
 |
| Module-wise count rates for Quadrant D Data is divided into 100 sec bins |
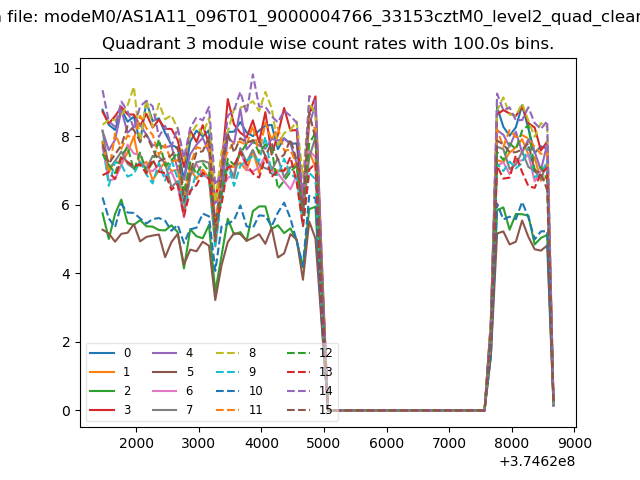 |
 |
| Parameter | Plot |
|---|---|
| CZT HV Monitor |  |
| D_VDD | 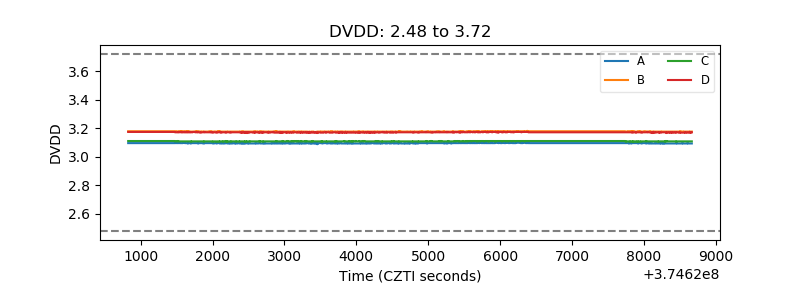 |
| Temperature 1 | 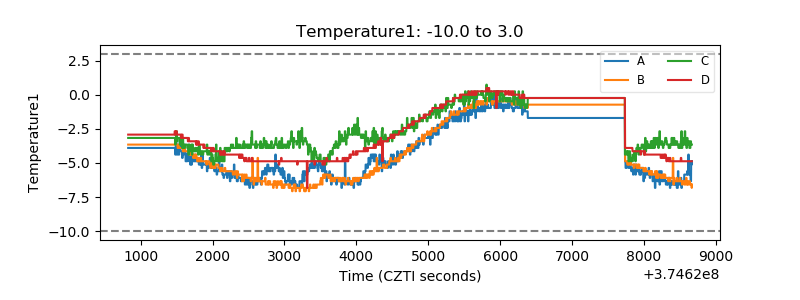 |
| Veto HV Monitor | 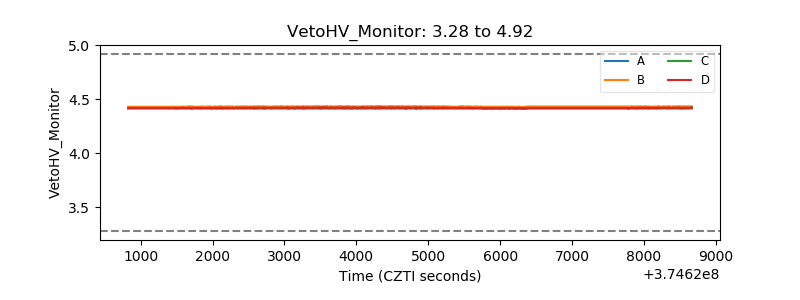 |
| Veto LLD | 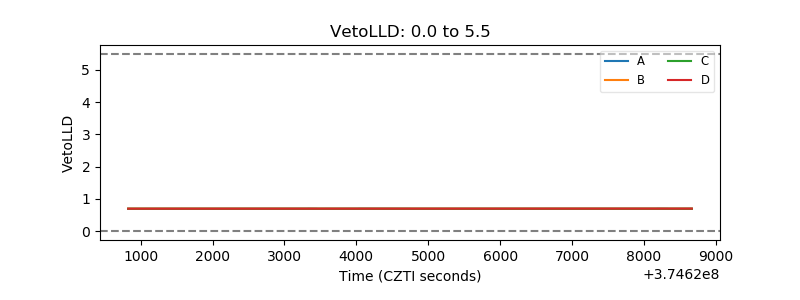 |
| Alpha Counter | 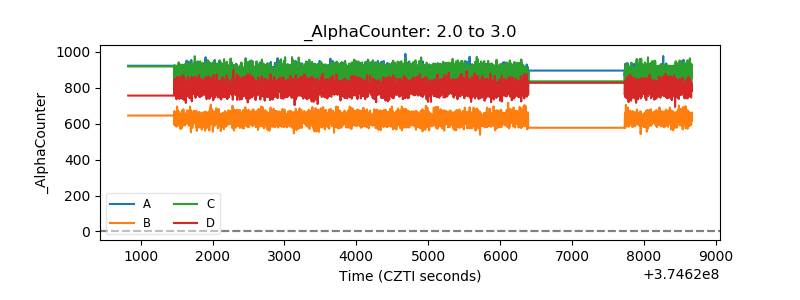 |
| _CPM_Rate | 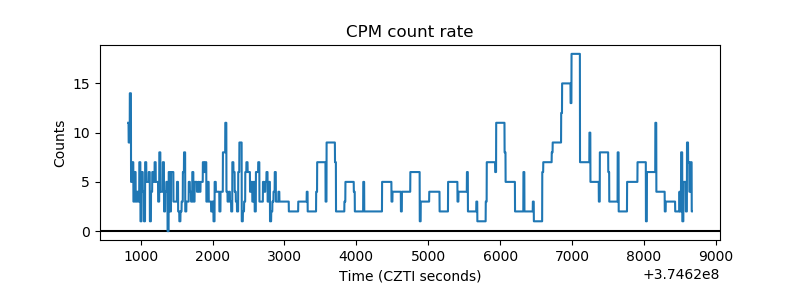 |
| CZT Counter | 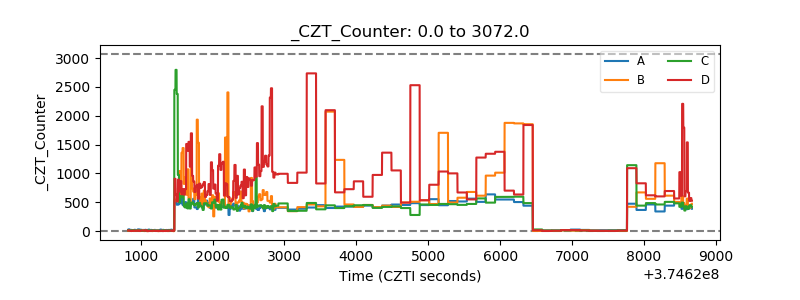 |
| +2.5 Volts monitor | 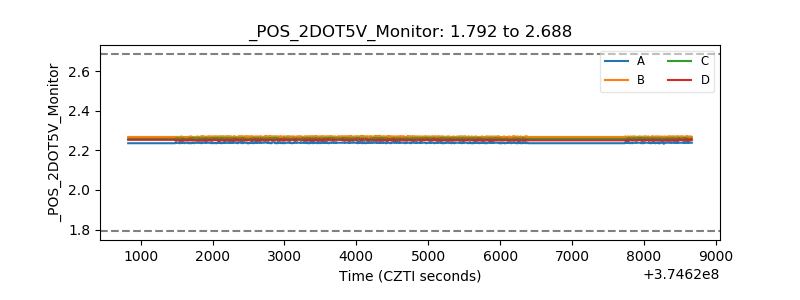 |
| +5 Volts monitor | 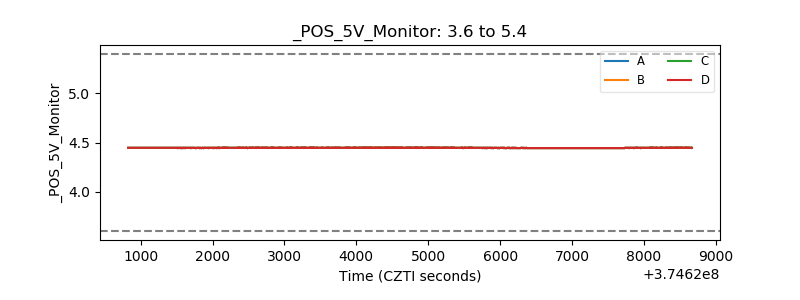 |
| _ROLL_ROT | 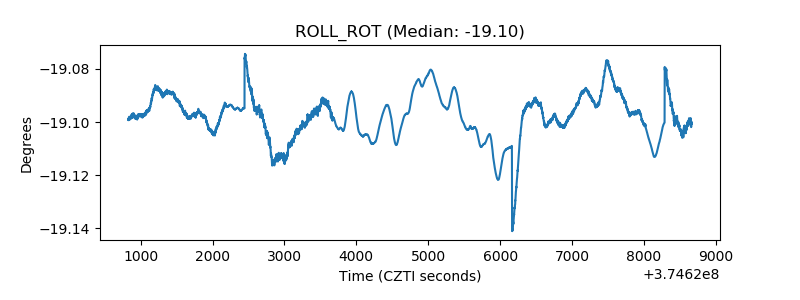 |
| _Roll_DEC | 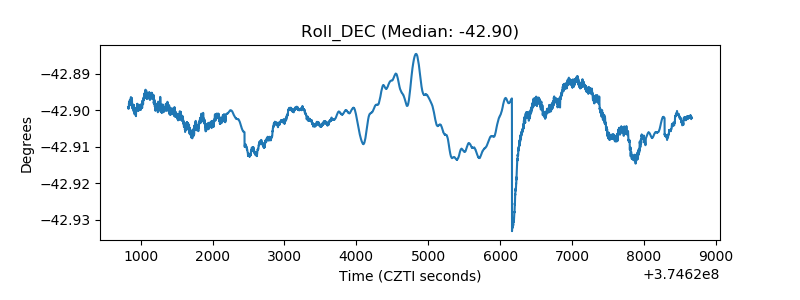 |
| _Roll_RA | 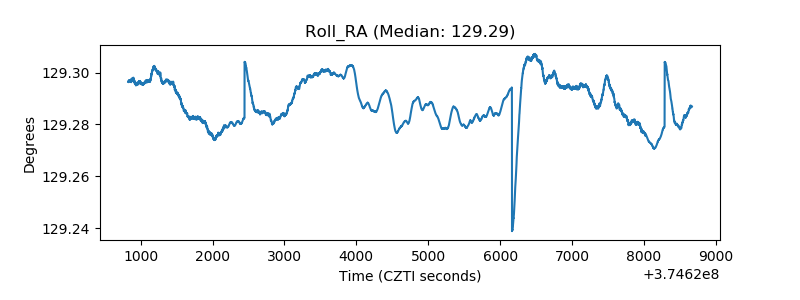 |
| Veto Counter | 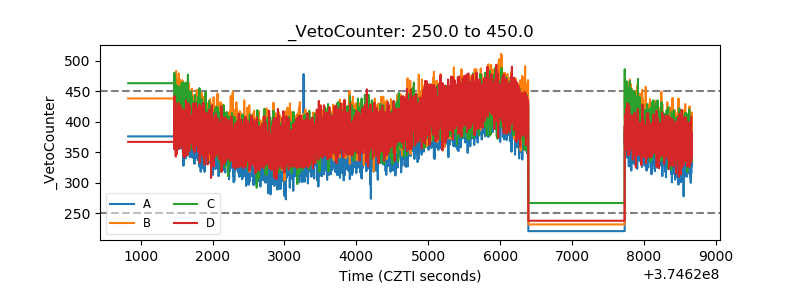 |