| Param | Original file | Final file |
|---|---|---|
| Filename | modeM0/AS1A11_096T01_9000004766_33160cztM0_level2.evt | modeM0/AS1A11_096T01_9000004766_33160cztM0_level2_quad_clean.evt |
| Size (bytes) | 2,441,053,440 | 317,171,520 |
| Size | 2.3 GB | 302.5 MB |
| Events in quadrant A | 13,085,685 | 1,974,469 |
| Events in quadrant B | 19,022,918 | 1,965,944 |
| Events in quadrant C | 13,787,970 | 1,948,376 |
| Events in quadrant D | 26,171,468 | 1,816,620 |
| Mode SS | |||
|---|---|---|---|
| Quadrant | BADHDUFLAG | Total packets | Discarded packets |
| A | 0 | 564 | 0 |
| B | 0 | 564 | 0 |
| C | 0 | 564 | 0 |
| D | 0 | 564 | 0 |
| Mode M0 | |||
|---|---|---|---|
| Quadrant | BADHDUFLAG | Total packets | Discarded packets |
| A | 0 | 56490 | 7 |
| B | 0 | 74616 | 6 |
| C | 0 | 58413 | 6 |
| D | 0 | 97643 | 6 |
| Mode M9 | |||
|---|---|---|---|
| Quadrant | BADHDUFLAG | Total packets | Discarded packets |
| A | 0 | 92 | 0 |
| B | 0 | 92 | 0 |
| C | 0 | 92 | 0 |
| D | 0 | 93 | 0 |
| Quadrant | Total seconds | Saturated seconds | Saturation percentage |
|---|---|---|---|
| A | 27645 | 39 | 0.141074% |
| B | 27645 | 1658 | 5.997468% |
| C | 27645 | 215 | 0.777717% |
| D | 27645 | 1392 | 5.035269% |
Noise dominated data is calculated using 1-second bins in cleaned event files. If a bin has >2000 counts, and if more than 50% of those come from <1% of pixels, then it is considered to be noise-dominated and hence unusable.
| Quadrant | # 1 sec bins | Bins with >0 counts | Bins with >2000 counts | High rate bins dominated by noise | Noise dominated (total time) | Noise dominated (detector-on time) | Marked lightcurve |
|---|---|---|---|---|---|---|---|
| A | 38388 | 27651 | 1 | 1 | 0.00% | 0.00% | 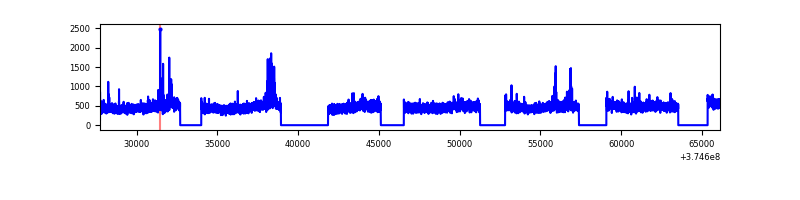 |
| B | 38388 | 27651 | 851 | 851 | 2.22% | 3.08% | 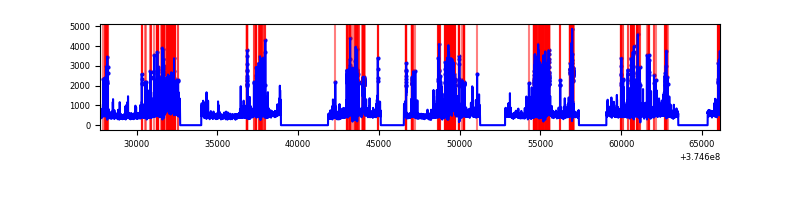 |
| C | 38388 | 27651 | 164 | 164 | 0.43% | 0.59% | 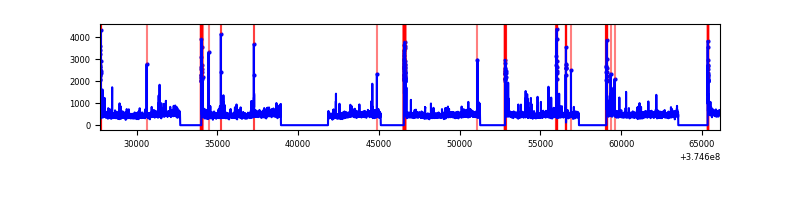 |
| D | 38388 | 27651 | 1073 | 1073 | 2.80% | 3.88% | 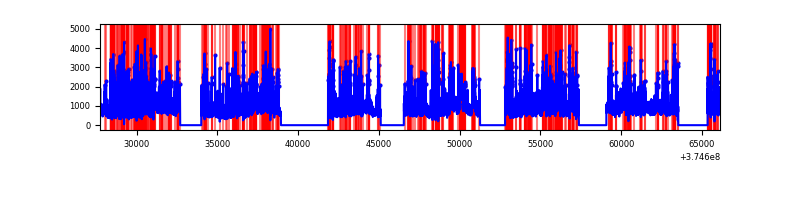 |
Top three noisy pixels from each quadrant. If the there are fewer than three noisy pixels in the level2.evt file, extra rows are filled as -1
| Pixel properties | Quadrant properties | ||||||
|---|---|---|---|---|---|---|---|
| Quadrant | DetID | PixID | Counts | Sigma | Mean | Median | Sigma |
| A | 14 | 254 | 126127 | 185.02 | 3335 | 3267 | 664.0 |
| A | 13 | 254 | 49984 | 70.35 | 3335 | 3267 | 664.0 |
| A | 13 | 6 | 41975 | 58.29 | 3335 | 3267 | 664.0 |
| B | 5 | 172 | 2292635 | 3761.97 | 3242 | 3161 | 608.6 |
| B | 0 | 219 | 1637097 | 2684.82 | 3242 | 3161 | 608.6 |
| B | 5 | 200 | 838354 | 1372.36 | 3242 | 3161 | 608.6 |
| C | 0 | 10 | 586616 | 787.13 | 3228 | 3257 | 741.1 |
| C | 1 | 241 | 288747 | 385.22 | 3228 | 3257 | 741.1 |
| C | 14 | 67 | 137112 | 180.61 | 3228 | 3257 | 741.1 |
| D | 8 | 195 | 6674005 | 8278.27 | 3186 | 3116 | 805.8 |
| D | 2 | 249 | 1631228 | 2020.41 | 3186 | 3116 | 805.8 |
| D | 2 | 250 | 1618476 | 2004.59 | 3186 | 3116 | 805.8 |
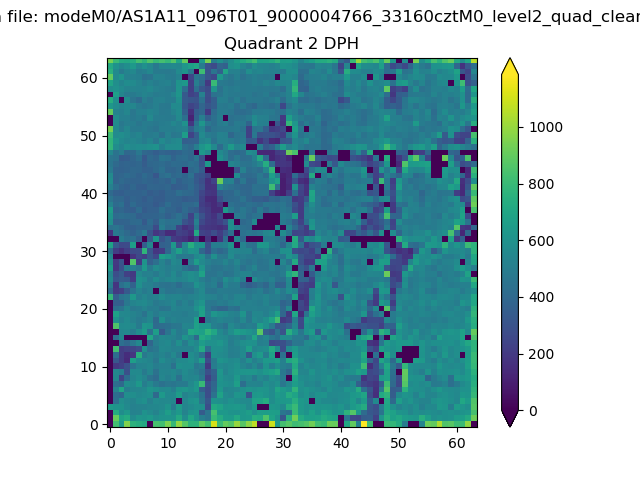
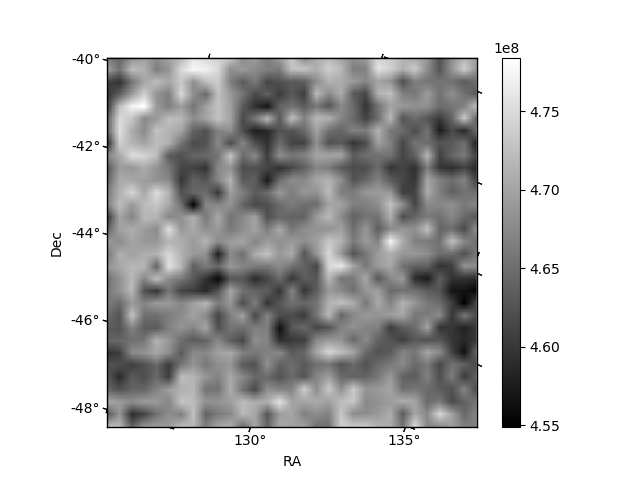
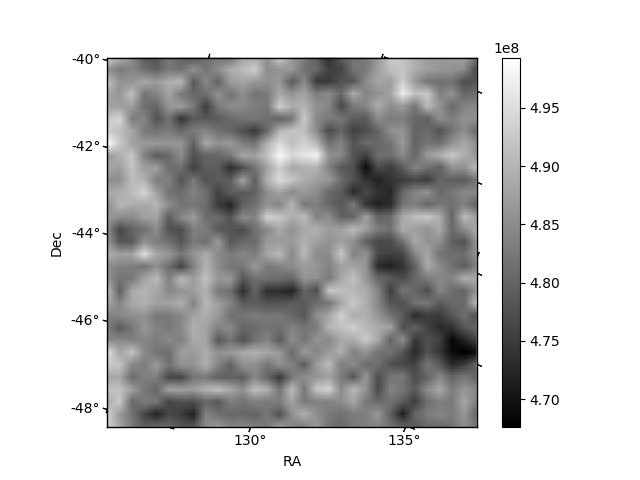
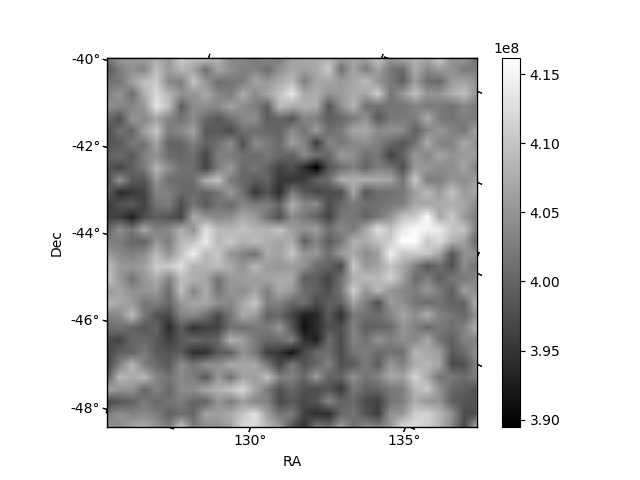
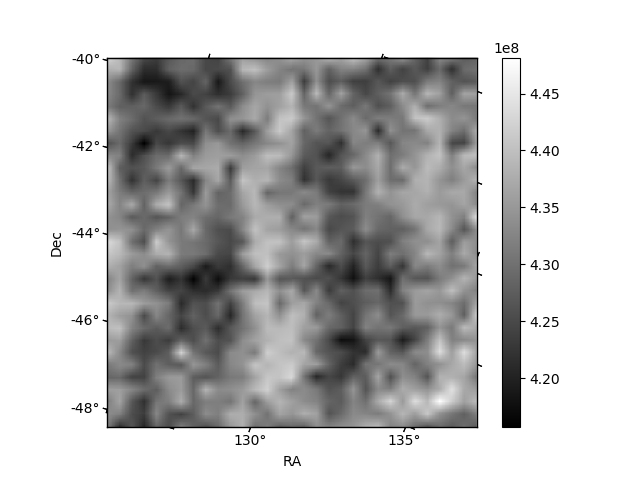
Histogram calculated using DETX and DETY for each event in the final _common_clean file
| Quadrant A | 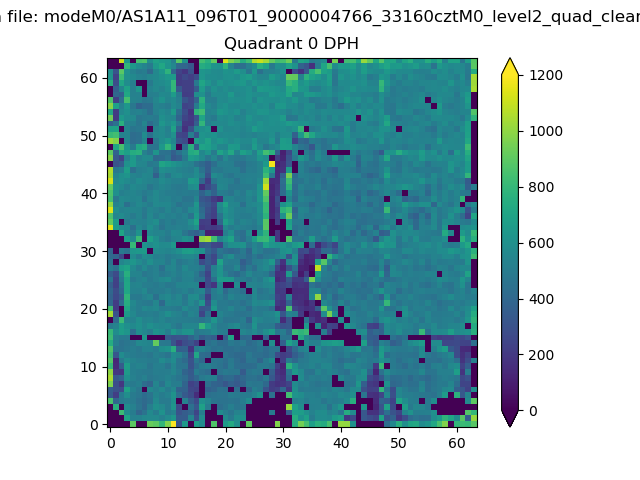 |
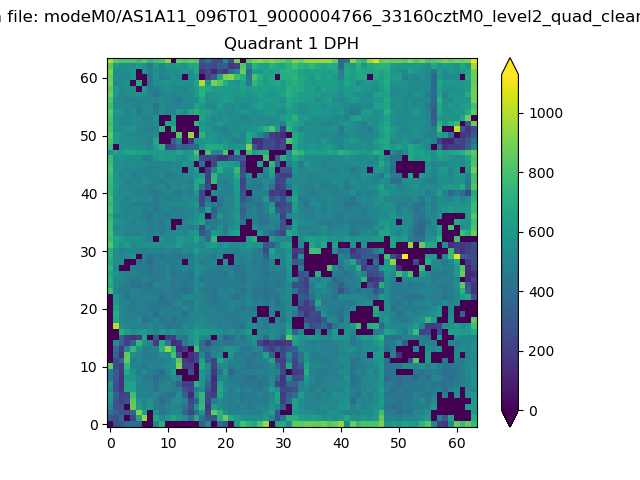 |
Quadrant B |
|---|---|---|---|
| Quadrant D | 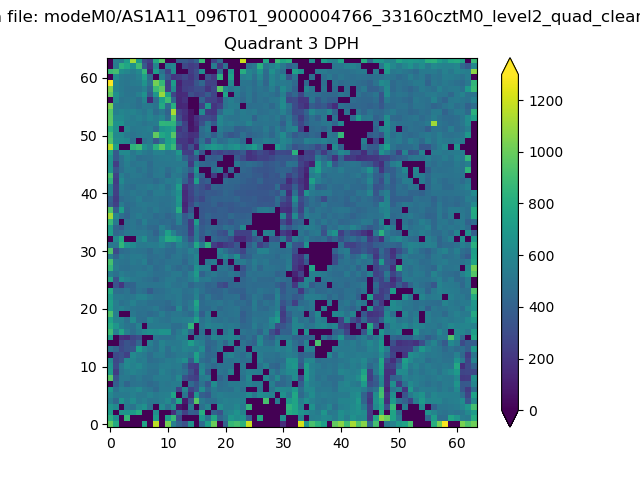 |
 |
Quadrant C |
| Plot type | Count rate plots | Images |
|---|---|---|
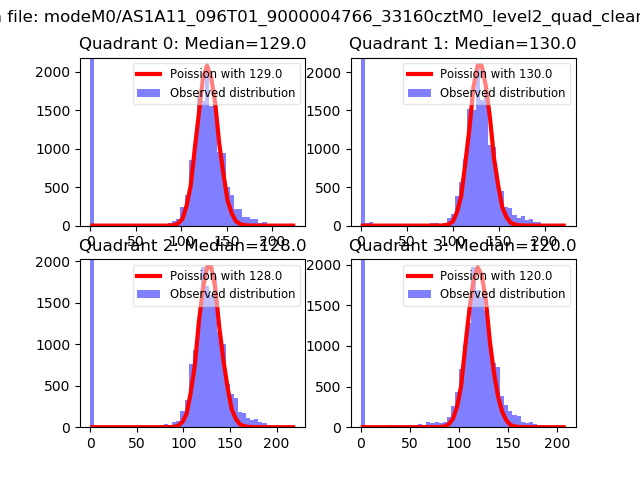
| Comparison with Poisson distribution Blue bars denote a histogram of data divided into 1 sec bins. Red curve is a Poisson curve with rate = median count rate of data. |
 |
 |
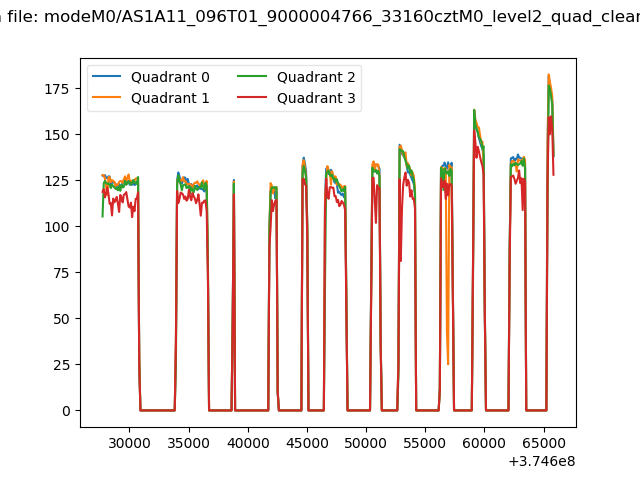
| Quadrant-wise count rates Data is divided into 100 sec bins |
 |
|
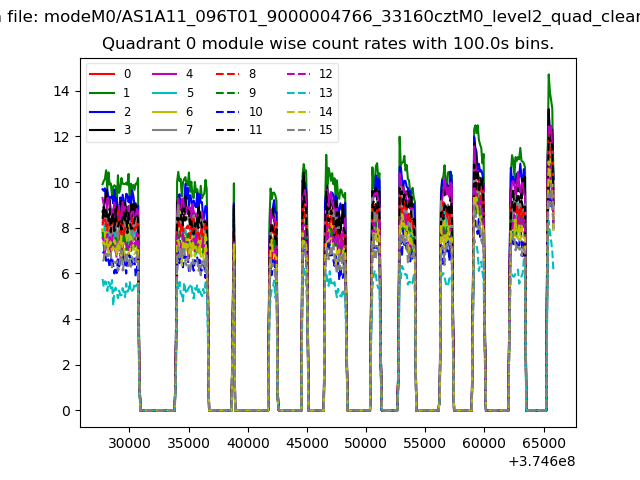
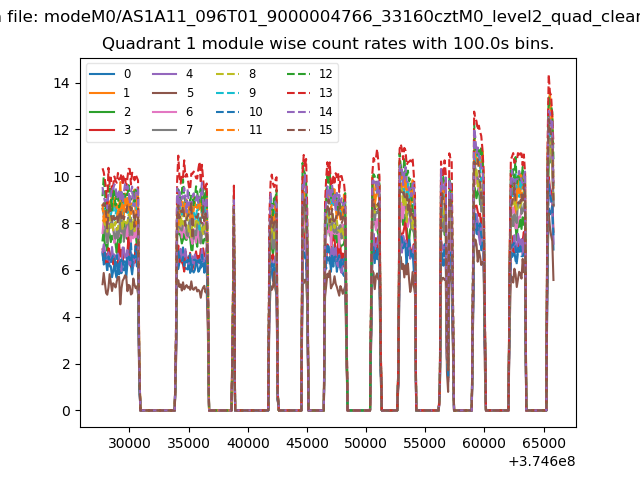
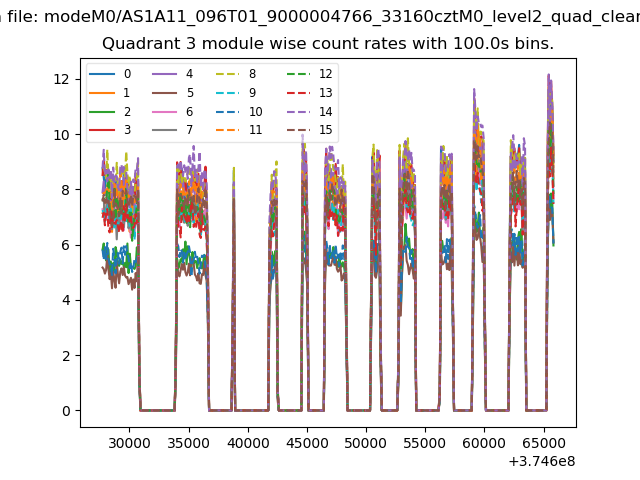
| Module-wise count rates for Quadrant A Data is divided into 100 sec bins |
 |
 |
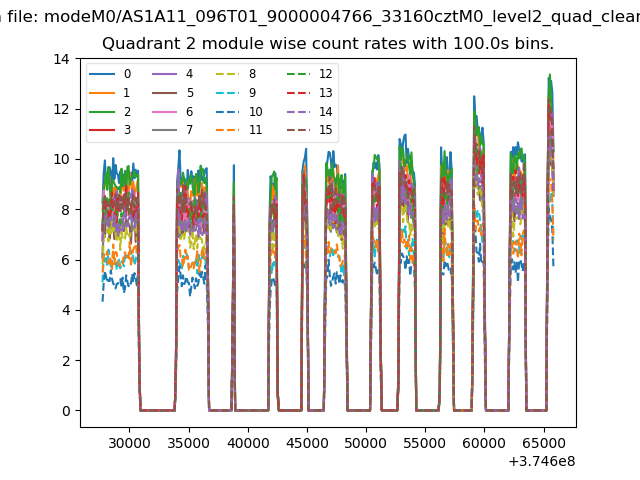
| Module-wise count rates for Quadrant B Data is divided into 100 sec bins |
 |
 |
| Module-wise count rates for Quadrant C Data is divided into 100 sec bins |
 |
 |
| Module-wise count rates for Quadrant D Data is divided into 100 sec bins |
 |
 |
| Parameter | Plot |
|---|---|
| CZT HV Monitor | 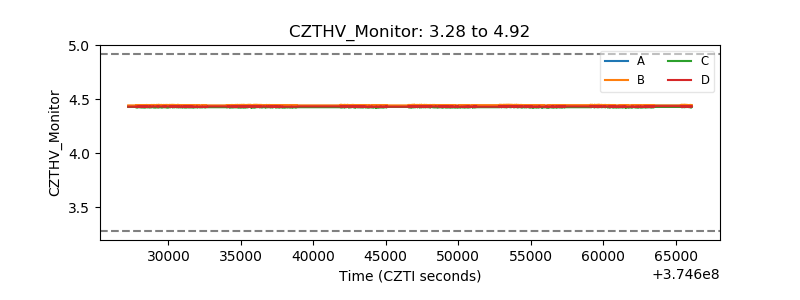 |
| D_VDD | 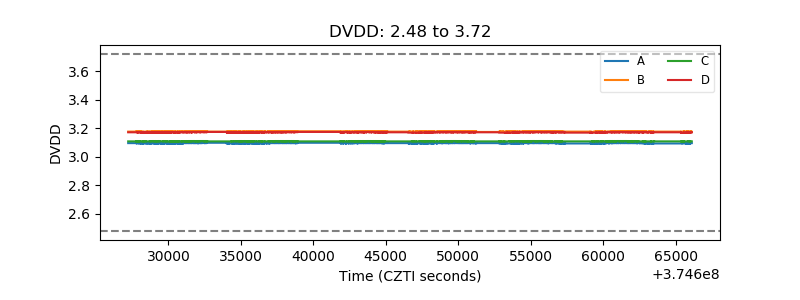 |
| Temperature 1 | 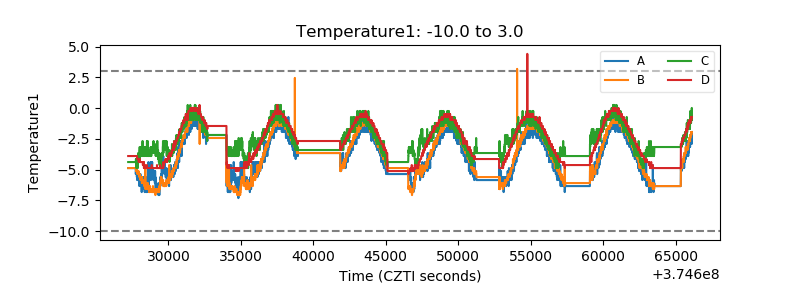 |
| Veto HV Monitor |  |
| Veto LLD | 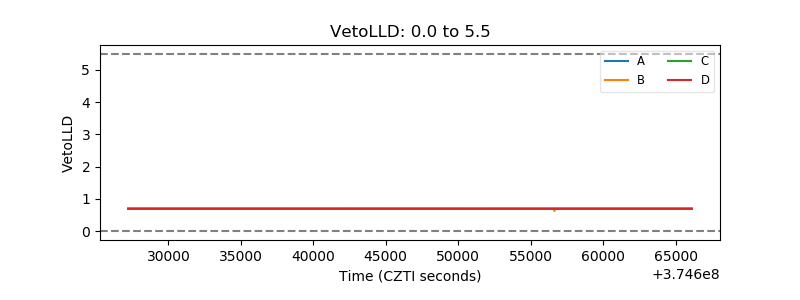 |
| Alpha Counter | 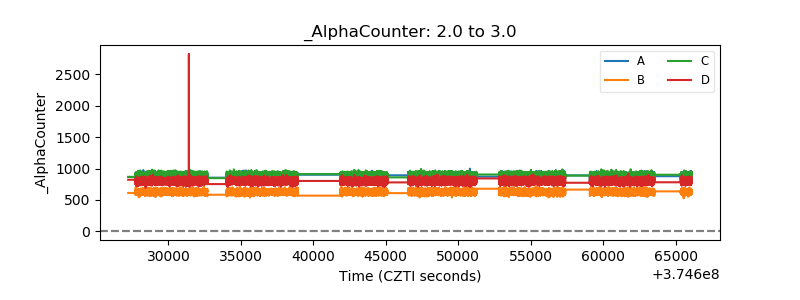 |
| _CPM_Rate |  |
| CZT Counter | 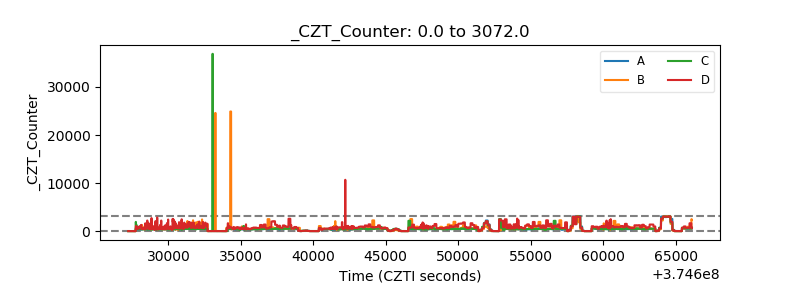 |
| +2.5 Volts monitor | 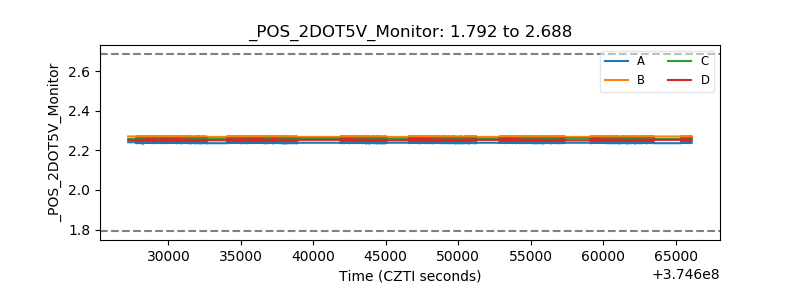 |
| +5 Volts monitor |  |
| _ROLL_ROT | 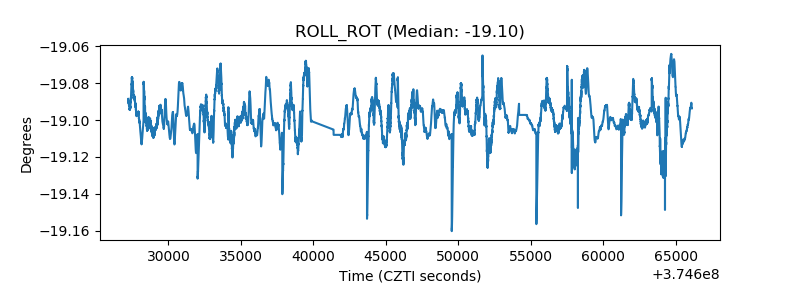 |
| _Roll_DEC | 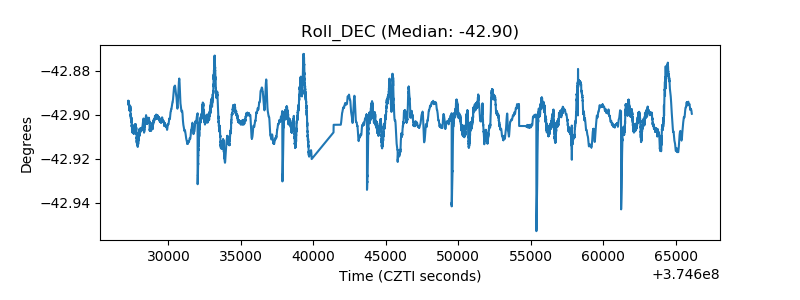 |
| _Roll_RA | 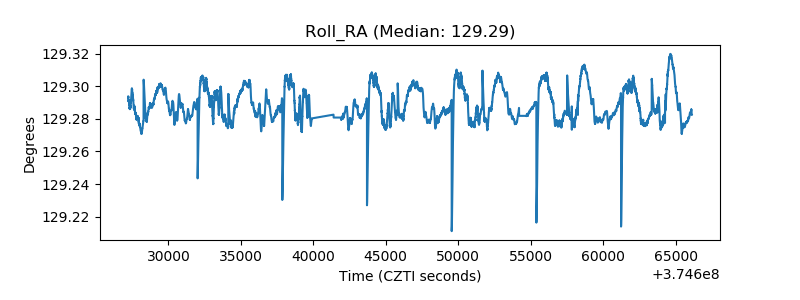 |
| Veto Counter | 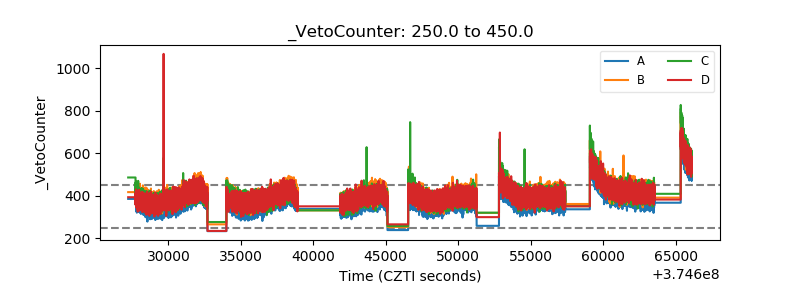 |