| Param | Original file | Final file |
|---|---|---|
| Filename | modeM0/AS1A11_096T01_9000004766_33337cztM0_level2.evt | modeM0/AS1A11_096T01_9000004766_33337cztM0_level2_quad_clean.evt |
| Size (bytes) | 34,899,840 | 5,304,960 |
| Size | 33.3 MB | 5.1 MB |
| Events in quadrant A | 166,039 | 39,065 |
| Events in quadrant B | 266,693 | 31,653 |
| Events in quadrant C | 181,376 | 35,966 |
| Events in quadrant D | 421,109 | 26,337 |
| Mode SS | |||
|---|---|---|---|
| Quadrant | BADHDUFLAG | Total packets | Discarded packets |
| A | 0 | 22 | 14 |
| B | 0 | 22 | 16 |
| C | 0 | 22 | 16 |
| D | 0 | 22 | 12 |
| Mode M0 | |||
|---|---|---|---|
| Quadrant | BADHDUFLAG | Total packets | Discarded packets |
| A | 0 | 2123 | 1454 |
| B | 0 | 3506 | 2531 |
| C | 0 | 2542 | 1794 |
| D | 0 | 4840 | 3413 |
| Mode M9 | |||
|---|---|---|---|
| Quadrant | BADHDUFLAG | Total packets | Discarded packets |
| A | 0 | 21 | 12 |
| B | 0 | 21 | 11 |
| C | 0 | 21 | 15 |
| D | 0 | 21 | 15 |
| Quadrant | Total seconds | Saturated seconds | Saturation percentage |
|---|---|---|---|
| A | 285 | 0 | 0.000000% |
| B | 261 | 50 | 19.157088% |
| C | 263 | 8 | 3.041825% |
| D | 250 | 108 | 43.200000% |
Noise dominated data is calculated using 1-second bins in cleaned event files. If a bin has >2000 counts, and if more than 50% of those come from <1% of pixels, then it is considered to be noise-dominated and hence unusable.
| Quadrant | # 1 sec bins | Bins with >0 counts | Bins with >2000 counts | High rate bins dominated by noise | Noise dominated (total time) | Noise dominated (detector-on time) | Marked lightcurve |
|---|---|---|---|---|---|---|---|
| A | 3029 | 330 | 0 | 0 | 0.00% | 0.00% | 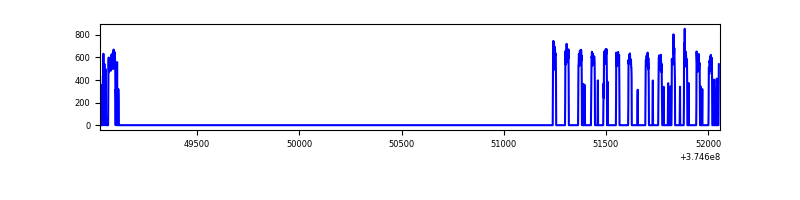 |
| B | 3032 | 288 | 28 | 28 | 0.92% | 9.72% | 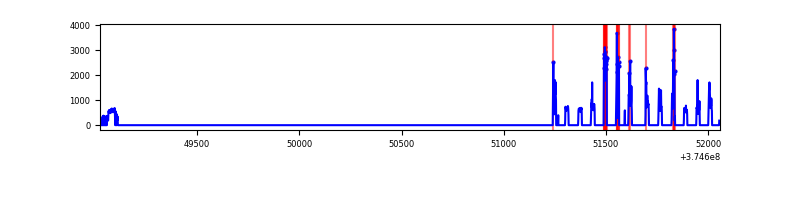 |
| C | 3011 | 288 | 6 | 6 | 0.20% | 2.08% | 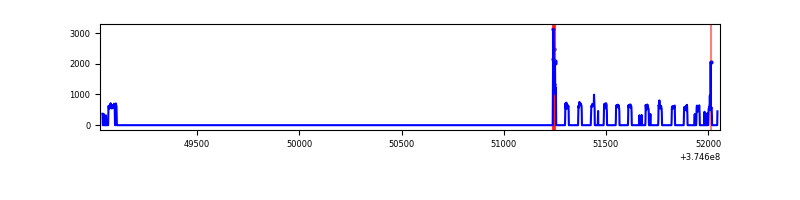 |
| D | 3011 | 269 | 81 | 81 | 2.69% | 30.11% | 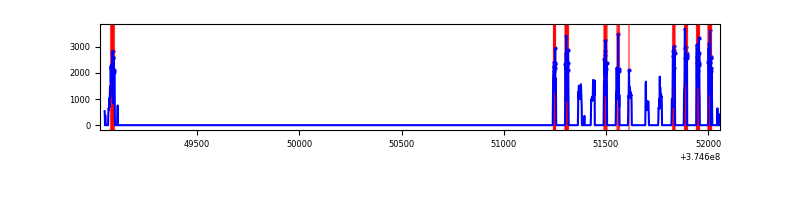 |
Top three noisy pixels from each quadrant. If the there are fewer than three noisy pixels in the level2.evt file, extra rows are filled as -1
| Pixel properties | Quadrant properties | ||||||
|---|---|---|---|---|---|---|---|
| Quadrant | DetID | PixID | Counts | Sigma | Mean | Median | Sigma |
| A | 10 | 83 | 723 | 64.56 | 42 | 41 | 10.6 |
| A | 0 | 254 | 684 | 60.87 | 42 | 41 | 10.6 |
| A | 15 | 169 | 593 | 52.25 | 42 | 41 | 10.6 |
| B | 0 | 219 | 82078 | 9418.03 | 34 | 33 | 8.7 |
| B | 5 | 172 | 42439 | 4867.83 | 34 | 33 | 8.7 |
| B | 4 | 170 | 3953 | 449.98 | 34 | 33 | 8.7 |
| C | 0 | 10 | 21054 | 2023.95 | 36 | 36 | 10.4 |
| C | 15 | 214 | 13358 | 1282.85 | 36 | 36 | 10.4 |
| C | 1 | 23 | 2743 | 260.67 | 36 | 36 | 10.4 |
| D | 12 | 233 | 100081 | 10866.3 | 29 | 28 | 9.2 |
| D | 8 | 195 | 67246 | 7300.24 | 29 | 28 | 9.2 |
| D | 12 | 218 | 50326 | 5462.64 | 29 | 28 | 9.2 |
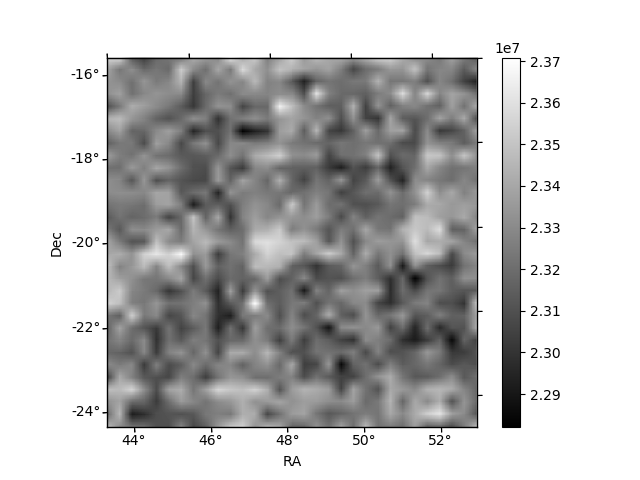
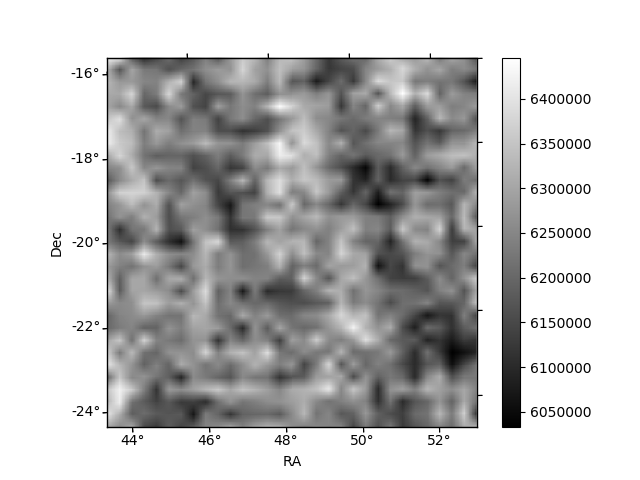
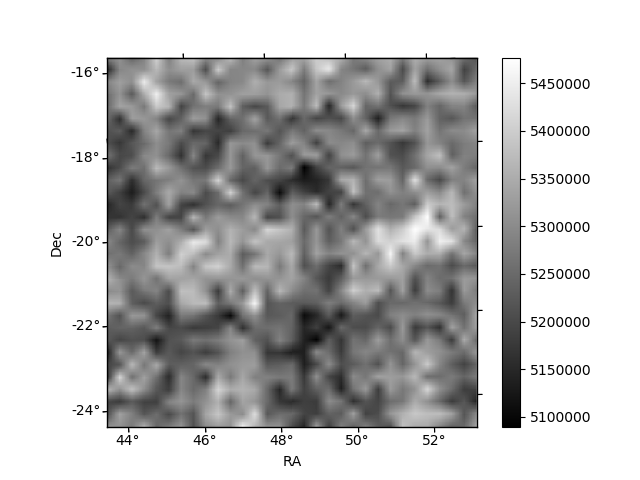
Histogram calculated using DETX and DETY for each event in the final _common_clean file
| Quadrant A | 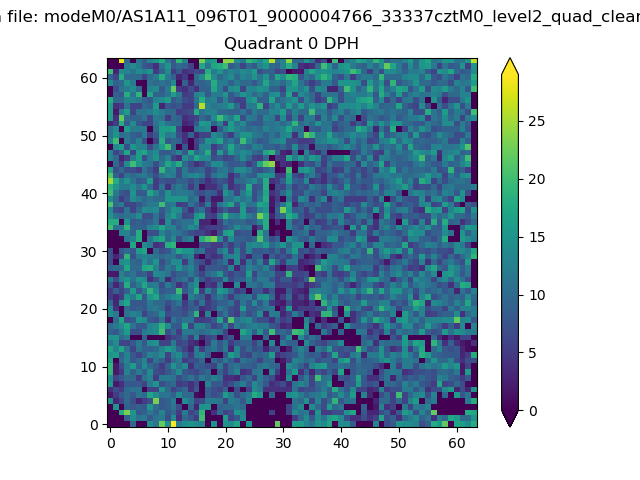 |
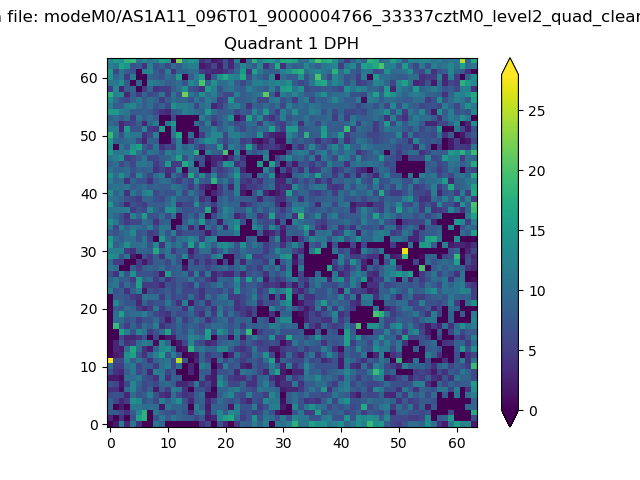 |
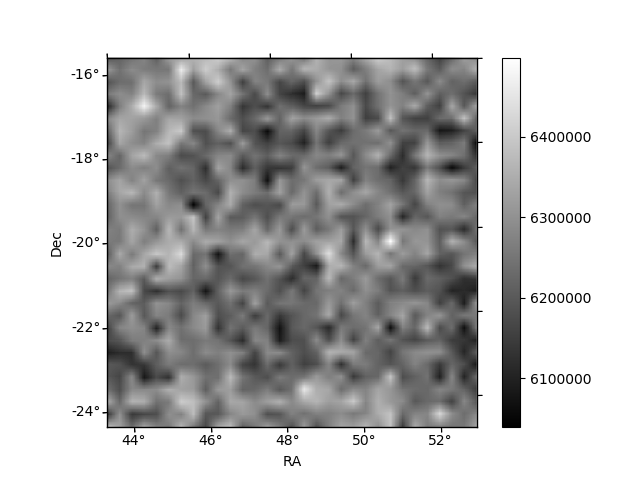
Quadrant B |
|---|---|---|---|
| Quadrant D | 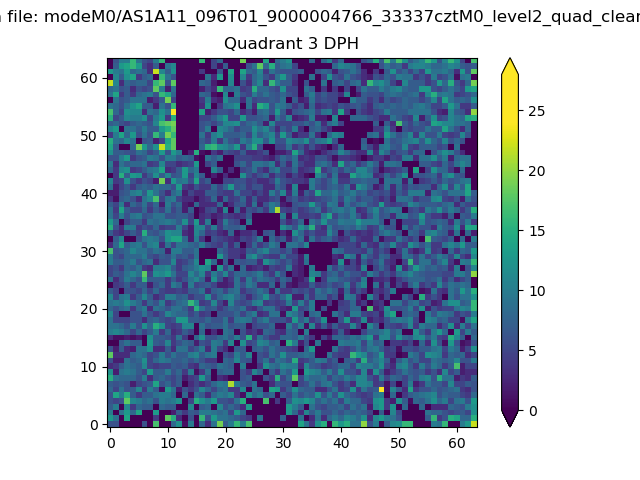 |
 |
Quadrant C |
| Plot type | Count rate plots | Images |
|---|---|---|
| Comparison with Poisson distribution Blue bars denote a histogram of data divided into 1 sec bins. Red curve is a Poisson curve with rate = median count rate of data. |
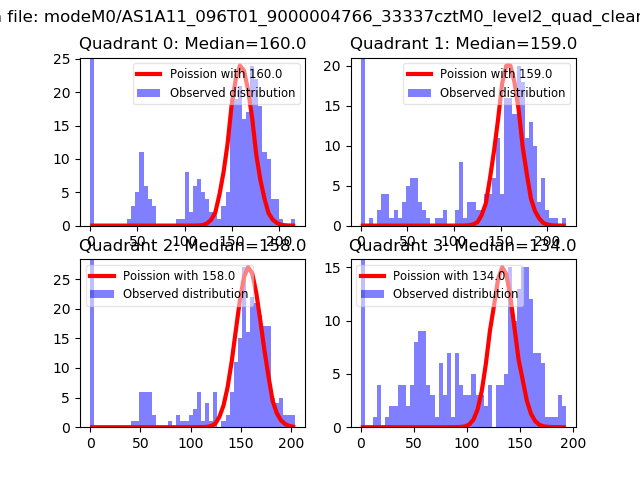 |
 |
| Quadrant-wise count rates Data is divided into 100 sec bins |
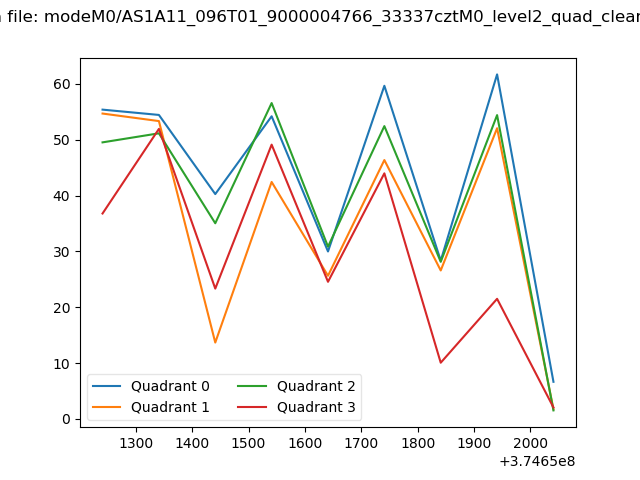 |
|
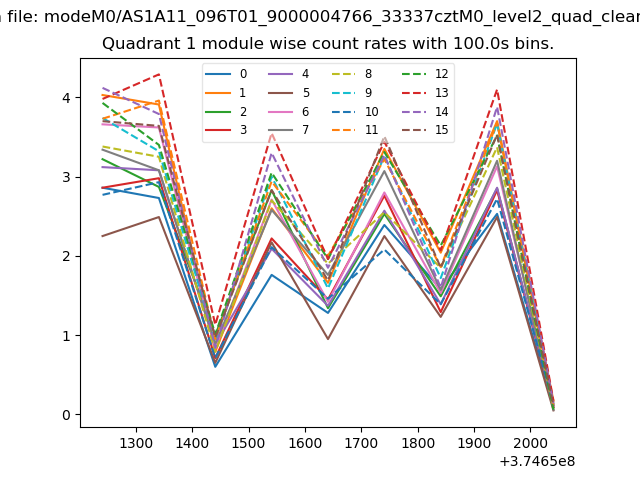
| Module-wise count rates for Quadrant A Data is divided into 100 sec bins |
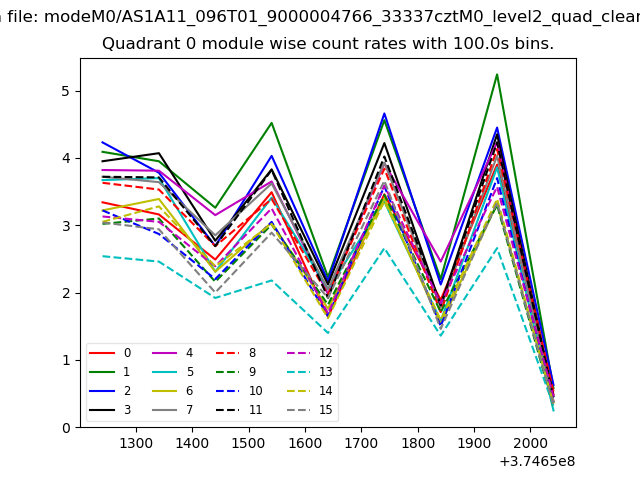 |
 |
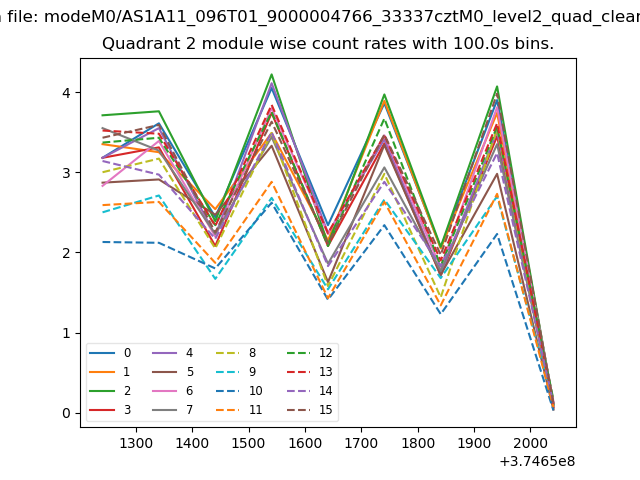
| Module-wise count rates for Quadrant B Data is divided into 100 sec bins |
 |
 |
| Module-wise count rates for Quadrant C Data is divided into 100 sec bins |
 |
 |
| Module-wise count rates for Quadrant D Data is divided into 100 sec bins |
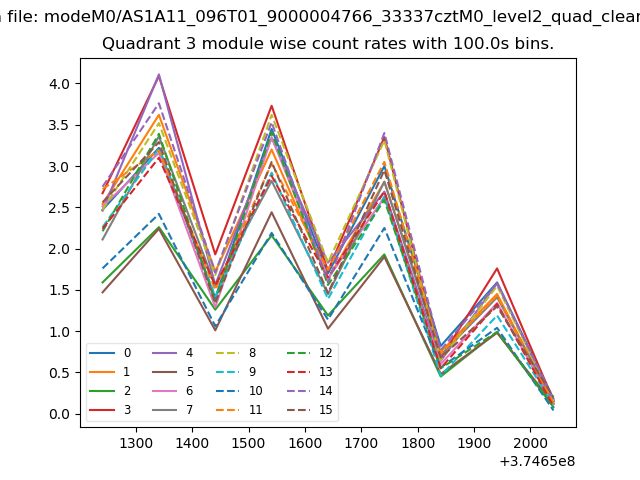 |
 |
| Parameter | Plot |
|---|---|
| CZT HV Monitor | 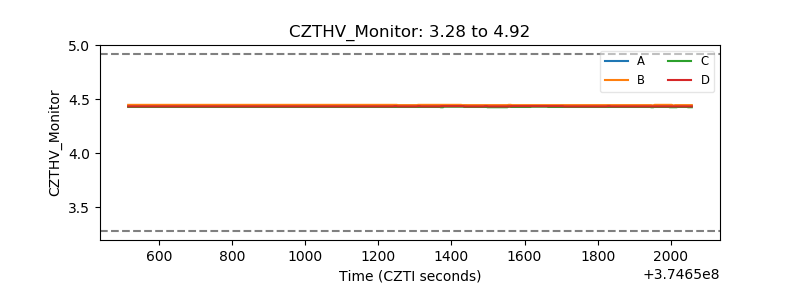 |
| D_VDD | 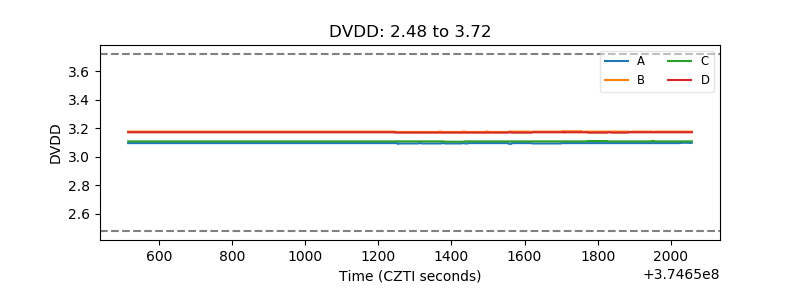 |
| Temperature 1 |  |
| Veto HV Monitor | 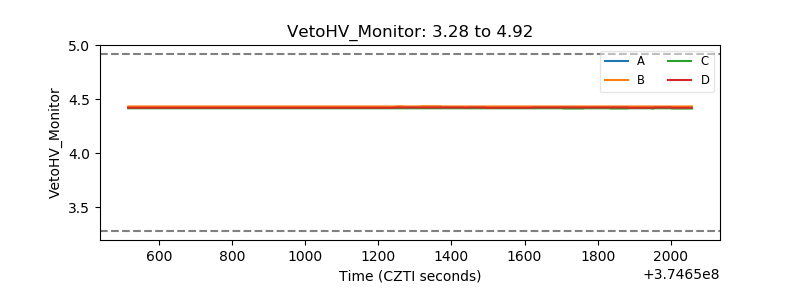 |
| Veto LLD | 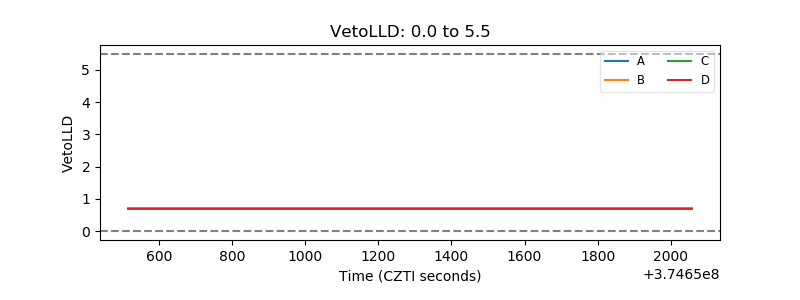 |
| Alpha Counter |  |
| _CPM_Rate | 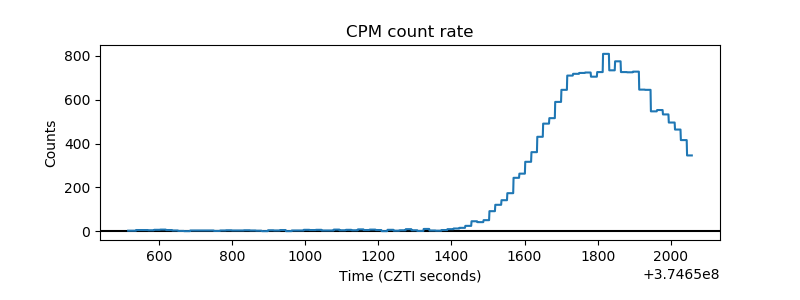 |
| CZT Counter |  |
| +2.5 Volts monitor |  |
| +5 Volts monitor | 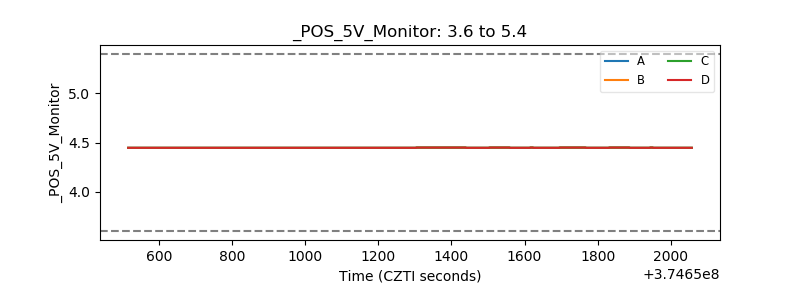 |
| _ROLL_ROT | 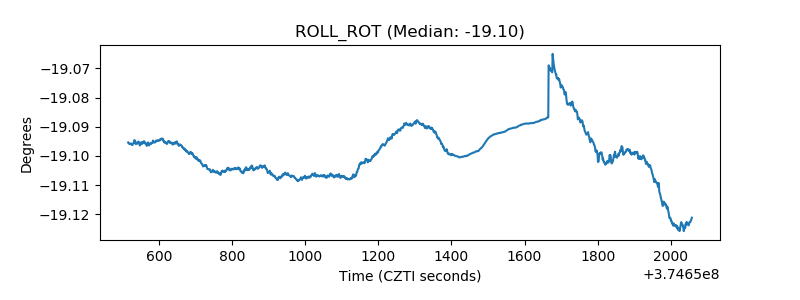 |
| _Roll_DEC | 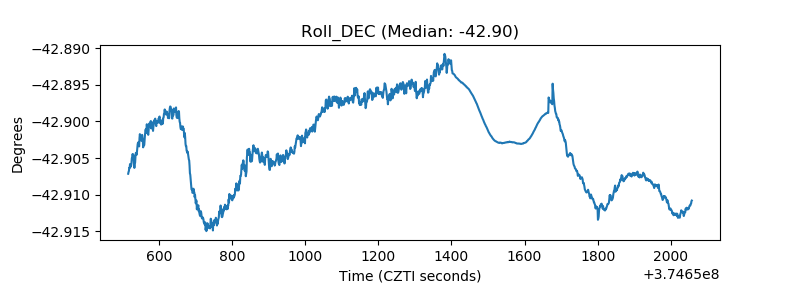 |
| _Roll_RA |  |
| Veto Counter | 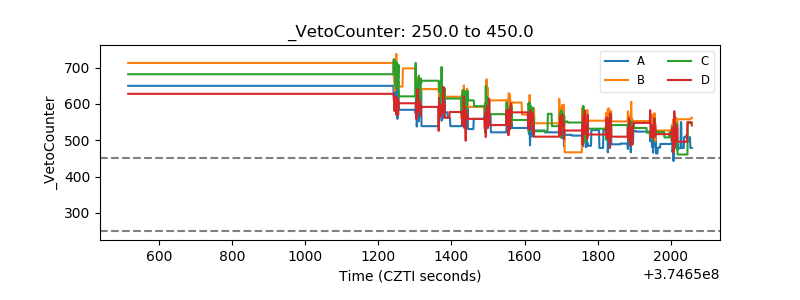 |