| Param | Original file | Final file |
|---|---|---|
| Filename | modeM0/AS1A11_080T02_9000004768cztM0_level2.fits | modeM0/AS1A11_080T02_9000004768cztM0_level2_quad_clean.evt |
| Size (bytes) | 1,282,158,720 | 1,231,911,360 |
| Size | 1.2 GB | 1.1 GB |
| Events in quadrant A | 8,081,678 | 7,522,158 |
| Events in quadrant B | 7,352,824 | 7,232,398 |
| Events in quadrant C | 7,796,924 | 7,158,671 |
| Events in quadrant D | 6,525,868 | 6,327,963 |
| Mode M9 | |||
|---|---|---|---|
| Quadrant | BADHDUFLAG | Total packets | Discarded packets |
| A | 0 | 511 | 0 |
| B | 0 | 511 | 0 |
| C | 0 | 511 | 0 |
| D | 0 | 512 | 0 |
| Mode SS | |||
|---|---|---|---|
| Quadrant | BADHDUFLAG | Total packets | Discarded packets |
| A | 0 | 2700 | 0 |
| B | 0 | 2700 | 0 |
| C | 0 | 2700 | 0 |
| D | 0 | 2700 | 0 |
| Mode M0 | |||
|---|---|---|---|
| Quadrant | BADHDUFLAG | Total packets | Discarded packets |
| A | 0 | 268800 | 0 |
| B | 0 | 375532 | 0 |
| C | 0 | 290488 | 0 |
| D | 0 | 473334 | 0 |
| Quadrant | Total seconds | Saturated seconds | Saturation percentage |
|---|---|---|---|
| A | 132348 | 168 | 0.126938% |
| B | 132349 | 9431 | 7.125857% |
| C | 132349 | 1930 | 1.458266% |
| D | 132352 | 7574 | 5.722618% |
Noise dominated data is calculated using 1-second bins in cleaned event files. If a bin has >2000 counts, and if more than 50% of those come from <1% of pixels, then it is considered to be noise-dominated and hence unusable.
| Quadrant | # 1 sec bins | Bins with >0 counts | Bins with >2000 counts | High rate bins dominated by noise | Noise dominated (total time) | Noise dominated (detector-on time) | Marked lightcurve |
|---|---|---|---|---|---|---|---|
| A | 188376 | 132358 | 0 | 0 | 0.00% | 0.00% |  |
| B | 188376 | 132243 | 0 | 0 | 0.00% | 0.00% |  |
| C | 188376 | 132328 | 0 | 0 | 0.00% | 0.00% |  |
| D | 188376 | 132248 | 0 | 0 | 0.00% | 0.00% |  |
Top three noisy pixels from each quadrant. If the there are fewer than three noisy pixels in the level2.evt file, extra rows are filled as -1
| Pixel properties | Quadrant properties | ||||||
|---|---|---|---|---|---|---|---|
| Quadrant | DetID | PixID | Counts | Sigma | Mean | Median | Sigma |
| A | 9 | 19 | 6592 | 8.92 | 2112 | 1990 | 515.8 |
| A | 7 | 110 | 6510 | 8.76 | 2112 | 1990 | 515.8 |
| A | 0 | 29 | 6356 | 8.46 | 2112 | 1990 | 515.8 |
| B | 2 | 9 | 6385 | 11.86 | 1956 | 1871 | 380.5 |
| B | 3 | 80 | 5730 | 10.14 | 1956 | 1871 | 380.5 |
| B | 2 | 8 | 5292 | 8.99 | 1956 | 1871 | 380.5 |
| C | 1 | 81 | 6565 | 8.96 | 2064 | 1946 | 515.7 |
| C | 1 | 80 | 6345 | 8.53 | 2064 | 1946 | 515.7 |
| C | 1 | 65 | 5317 | 6.54 | 2064 | 1946 | 515.7 |
| D | 10 | 113 | 4799 | 6.2 | 1875 | 1715 | 497.3 |
| D | 7 | 3 | 4772 | 6.15 | 1875 | 1715 | 497.3 |
| D | 4 | 160 | 4743 | 6.09 | 1875 | 1715 | 497.3 |
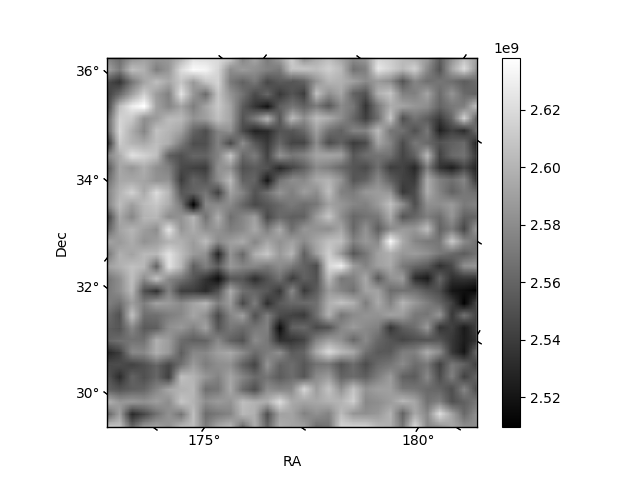
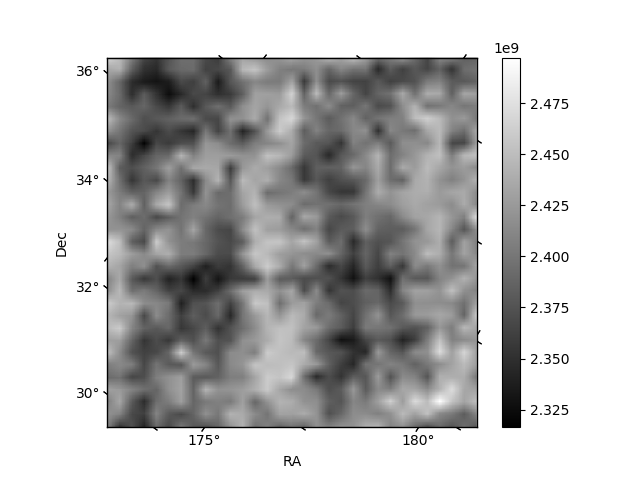
Histogram calculated using DETX and DETY for each event in the final _common_clean file
| Quadrant A |  |
 |
Quadrant B |
|---|---|---|---|
| Quadrant D |  |
 |
Quadrant C |
| Plot type | Count rate plots | Images |
|---|---|---|
| Comparison with Poisson distribution Blue bars denote a histogram of data divided into 1 sec bins. Red curve is a Poisson curve with rate = median count rate of data. |
 |
 |
| Quadrant-wise count rates Data is divided into 100 sec bins |
 |
|
| Module-wise count rates for Quadrant A Data is divided into 100 sec bins |
 |
 |
| Module-wise count rates for Quadrant B Data is divided into 100 sec bins |
 |
 |
| Module-wise count rates for Quadrant C Data is divided into 100 sec bins |
 |
 |
| Module-wise count rates for Quadrant D Data is divided into 100 sec bins |
 |
 |
| Parameter | Plot |
|---|---|
| CZT HV Monitor |  |
| D_VDD | 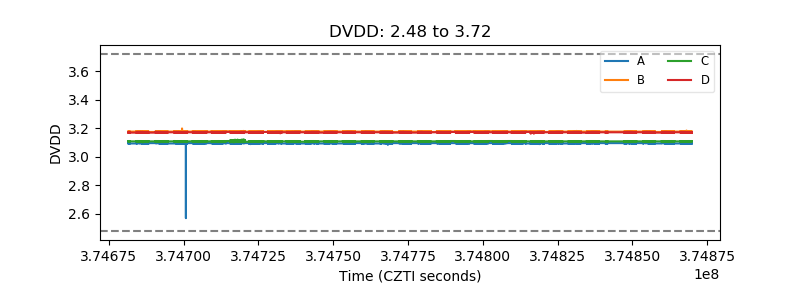 |
| Temperature 1 |  |
| Veto HV Monitor |  |
| Veto LLD |  |
| Alpha Counter |  |
| _CPM_Rate |  |
| CZT Counter |  |
| +2.5 Volts monitor |  |
| +5 Volts monitor |  |
| _ROLL_ROT |  |
| _Roll_DEC |  |
| _Roll_RA | 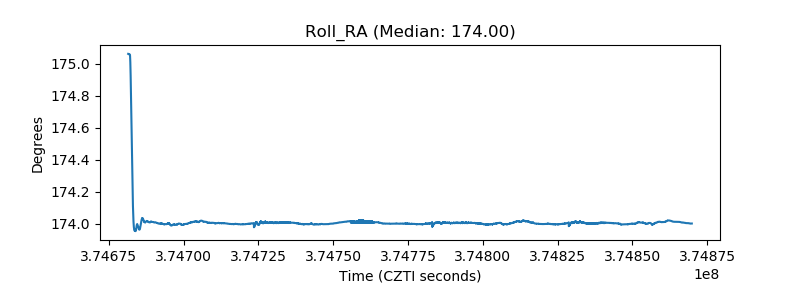 |
| Veto Counter |  |