| Param | Original file | Final file |
|---|---|---|
| Filename | modeM0/AS1A11_080T02_9000004768_33166cztM0_level2.evt | modeM0/AS1A11_080T02_9000004768_33166cztM0_level2_quad_clean.evt |
| Size (bytes) | 455,353,920 | 70,937,280 |
| Size | 434.3 MB | 67.7 MB |
| Events in quadrant A | 2,500,628 | 450,108 |
| Events in quadrant B | 3,382,151 | 450,163 |
| Events in quadrant C | 2,699,857 | 445,896 |
| Events in quadrant D | 4,843,538 | 425,927 |
| Mode M9 | |||
|---|---|---|---|
| Quadrant | BADHDUFLAG | Total packets | Discarded packets |
| A | 0 | 17 | 0 |
| B | 0 | 17 | 0 |
| C | 0 | 17 | 0 |
| D | 0 | 17 | 0 |
| Mode SS | |||
|---|---|---|---|
| Quadrant | BADHDUFLAG | Total packets | Discarded packets |
| A | 0 | 110 | 0 |
| B | 0 | 110 | 0 |
| C | 0 | 110 | 0 |
| D | 0 | 110 | 0 |
| Mode M0 | |||
|---|---|---|---|
| Quadrant | BADHDUFLAG | Total packets | Discarded packets |
| A | 0 | 10854 | 3 |
| B | 0 | 13536 | 2 |
| C | 0 | 11485 | 2 |
| D | 0 | 18362 | 2 |
| Quadrant | Total seconds | Saturated seconds | Saturation percentage |
|---|---|---|---|
| A | 5364 | 5 | 0.093214% |
| B | 5364 | 236 | 4.399702% |
| C | 5364 | 63 | 1.174497% |
| D | 5364 | 271 | 5.052200% |
Noise dominated data is calculated using 1-second bins in cleaned event files. If a bin has >2000 counts, and if more than 50% of those come from <1% of pixels, then it is considered to be noise-dominated and hence unusable.
| Quadrant | # 1 sec bins | Bins with >0 counts | Bins with >2000 counts | High rate bins dominated by noise | Noise dominated (total time) | Noise dominated (detector-on time) | Marked lightcurve |
|---|---|---|---|---|---|---|---|
| A | 7066 | 5365 | 0 | 0 | 0.00% | 0.00% | 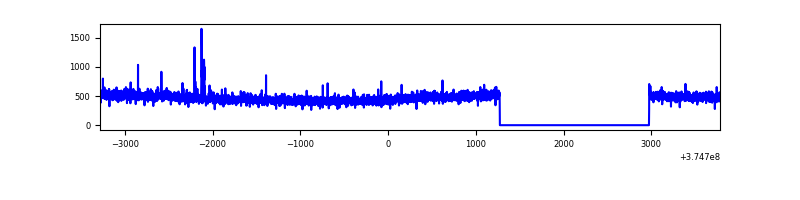 |
| B | 7066 | 5365 | 126 | 126 | 1.78% | 2.35% | 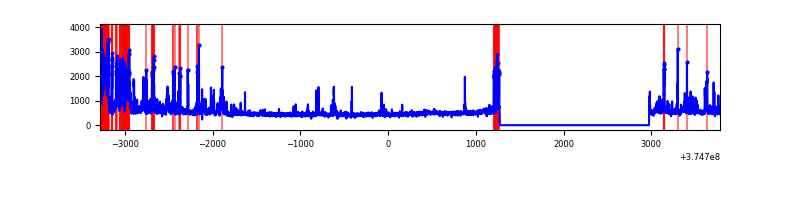 |
| C | 7066 | 5365 | 41 | 41 | 0.58% | 0.76% | 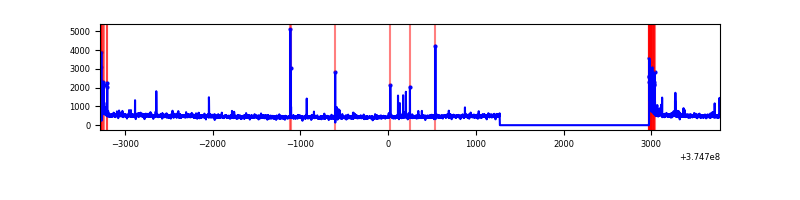 |
| D | 7066 | 5365 | 210 | 210 | 2.97% | 3.91% | 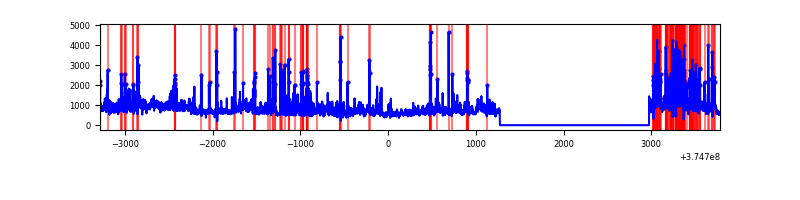 |
Top three noisy pixels from each quadrant. If the there are fewer than three noisy pixels in the level2.evt file, extra rows are filled as -1
| Pixel properties | Quadrant properties | ||||||
|---|---|---|---|---|---|---|---|
| Quadrant | DetID | PixID | Counts | Sigma | Mean | Median | Sigma |
| A | 14 | 235 | 21880 | 165.74 | 637 | 625 | 128.2 |
| A | 13 | 6 | 10236 | 74.94 | 637 | 625 | 128.2 |
| A | 13 | 254 | 9719 | 70.91 | 637 | 625 | 128.2 |
| B | 5 | 172 | 443794 | 3708.77 | 627 | 613 | 119.5 |
| B | 0 | 219 | 206472 | 1722.74 | 627 | 613 | 119.5 |
| B | 0 | 197 | 61712 | 511.31 | 627 | 613 | 119.5 |
| C | 0 | 10 | 170740 | 1200.45 | 614 | 619 | 141.7 |
| C | 1 | 241 | 39806 | 276.52 | 614 | 619 | 141.7 |
| C | 14 | 67 | 38988 | 270.75 | 614 | 619 | 141.7 |
| D | 8 | 195 | 1010882 | 6827.61 | 602 | 588 | 148.0 |
| D | 10 | 203 | 419882 | 2833.6 | 602 | 588 | 148.0 |
| D | 1 | 47 | 416012 | 2807.45 | 602 | 588 | 148.0 |
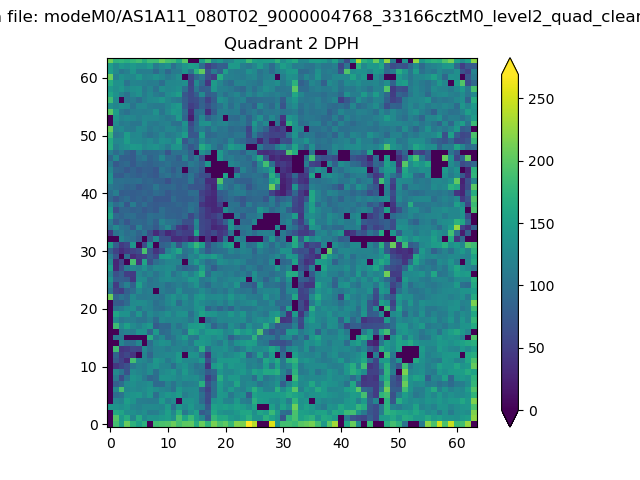
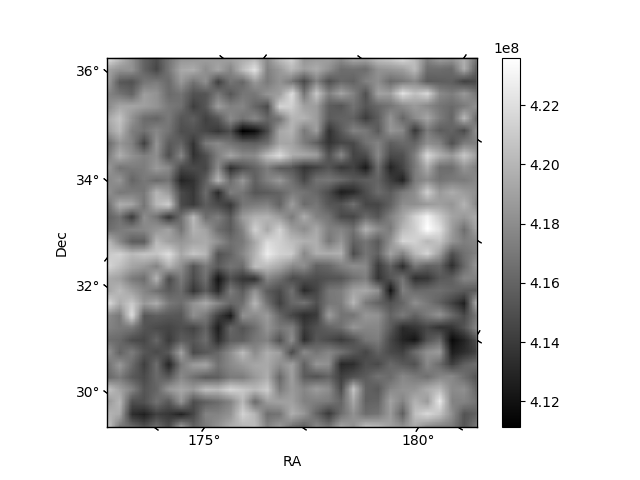
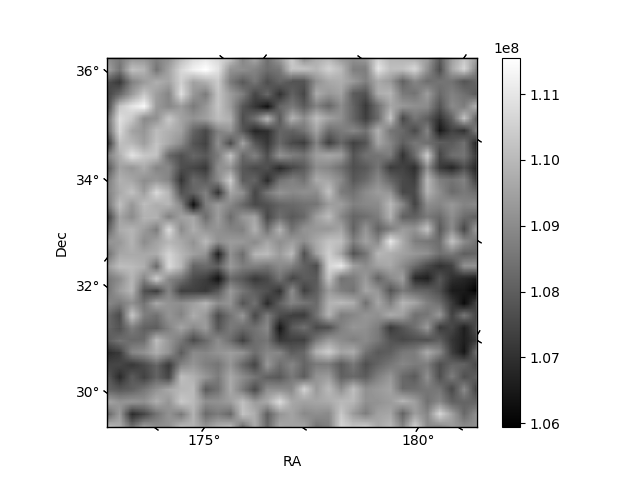
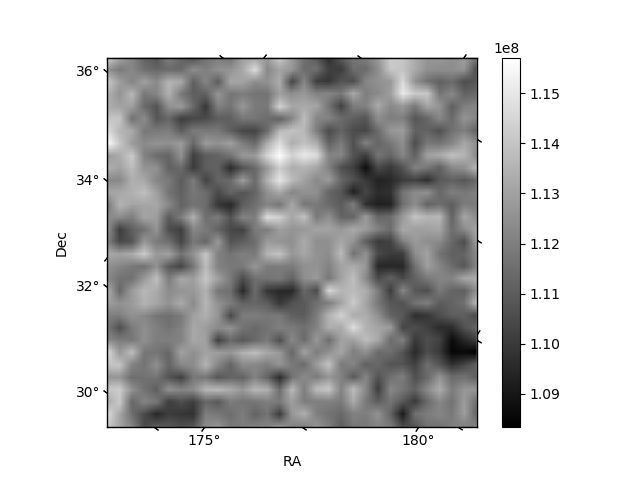
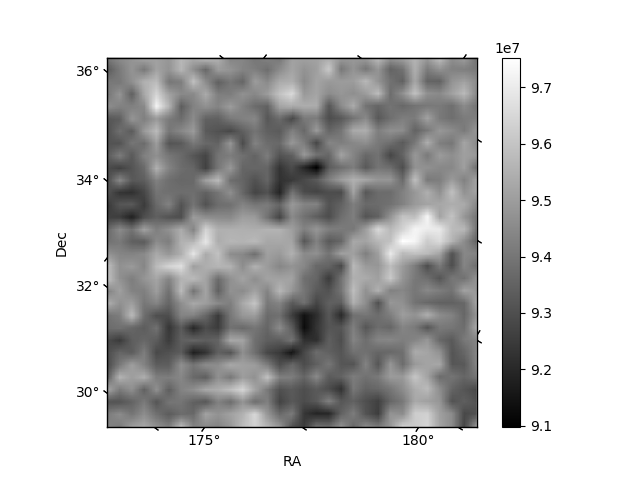
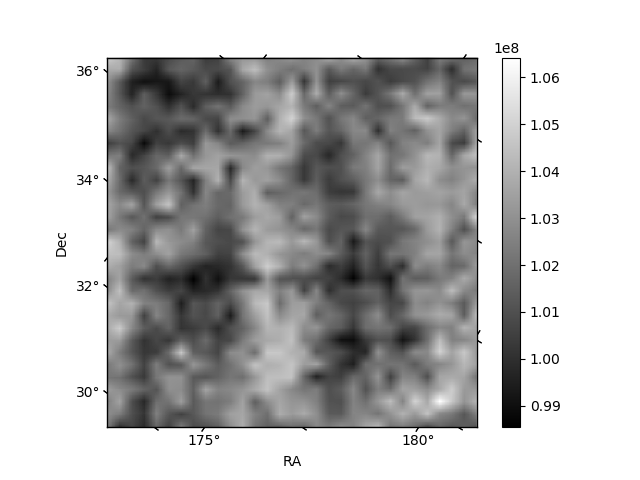
Histogram calculated using DETX and DETY for each event in the final _common_clean file
| Quadrant A | 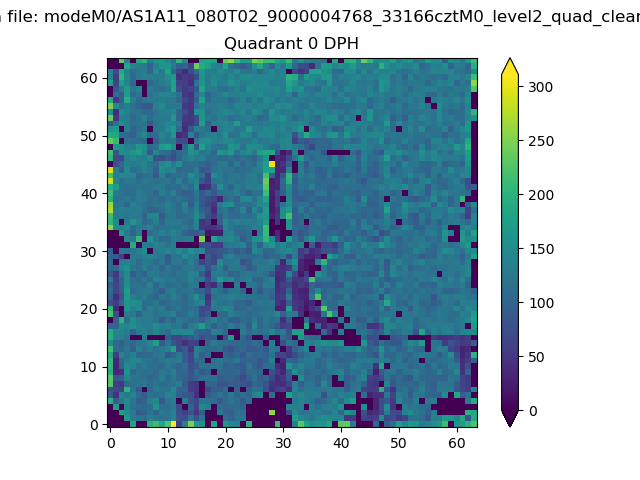 |
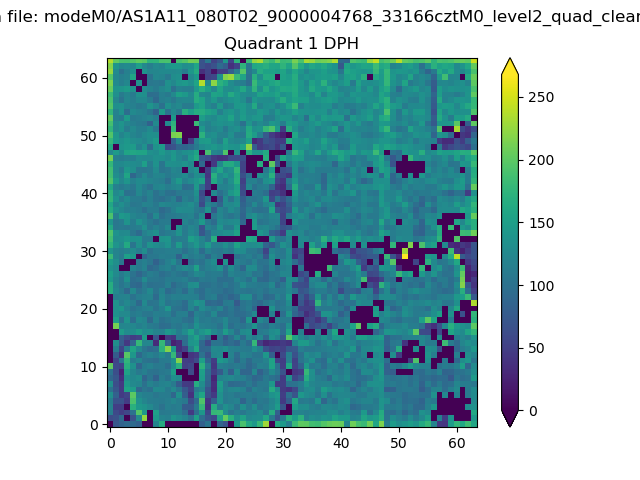 |
Quadrant B |
|---|---|---|---|
| Quadrant D | 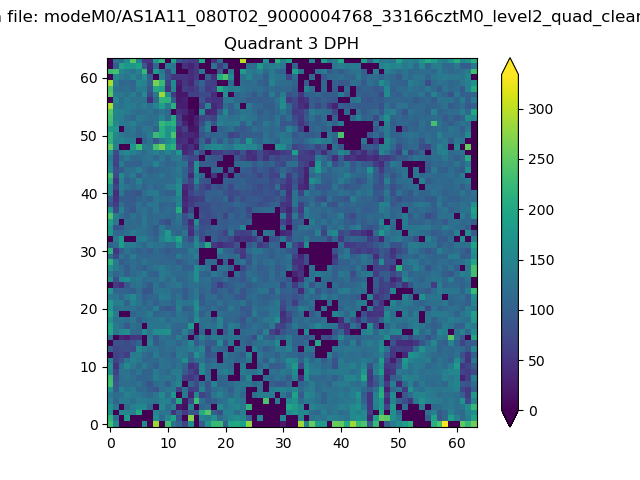 |
 |
Quadrant C |
| Plot type | Count rate plots | Images |
|---|---|---|
| Comparison with Poisson distribution Blue bars denote a histogram of data divided into 1 sec bins. Red curve is a Poisson curve with rate = median count rate of data. |
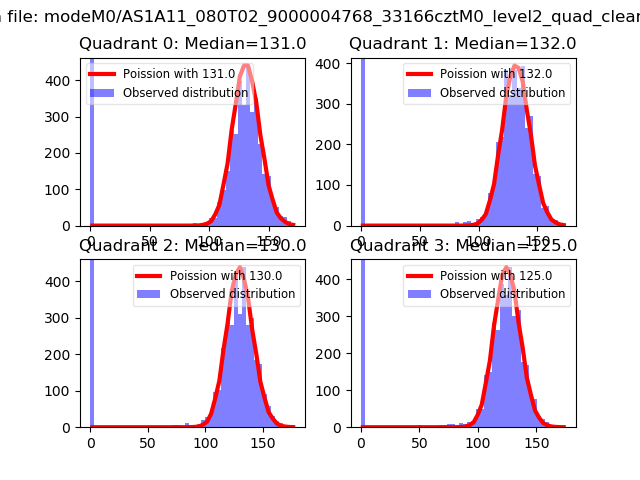 |
 |
| Quadrant-wise count rates Data is divided into 100 sec bins |
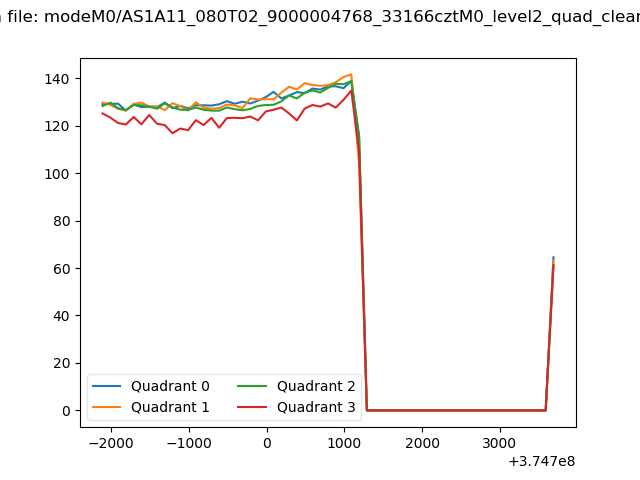 |
|
| Module-wise count rates for Quadrant A Data is divided into 100 sec bins |
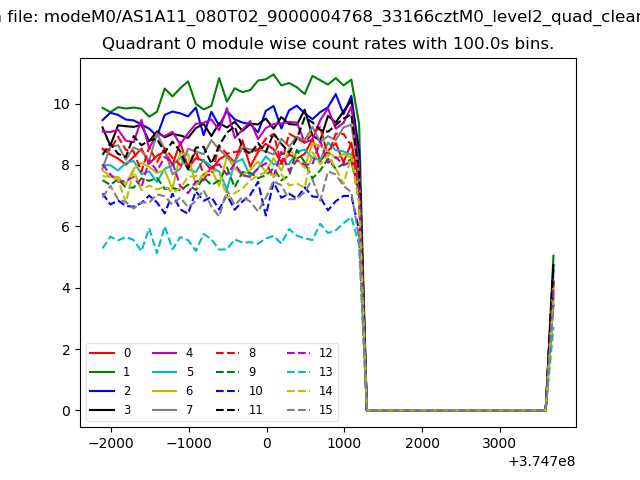 |
 |
| Module-wise count rates for Quadrant B Data is divided into 100 sec bins |
 |
 |
| Module-wise count rates for Quadrant C Data is divided into 100 sec bins |
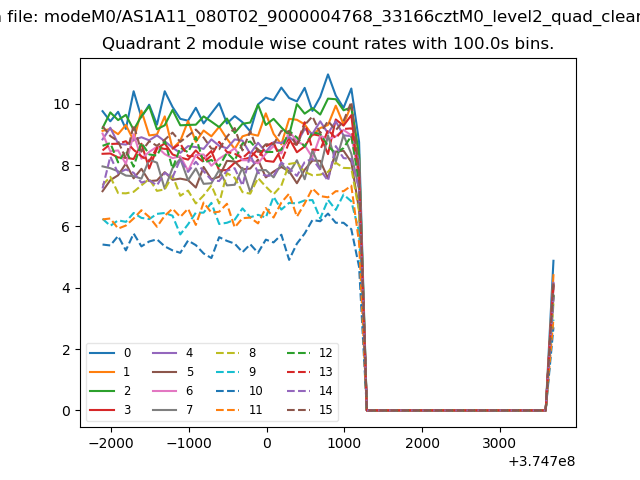 |
 |
| Module-wise count rates for Quadrant D Data is divided into 100 sec bins |
 |
 |
| Parameter | Plot |
|---|---|
| CZT HV Monitor |  |
| D_VDD | 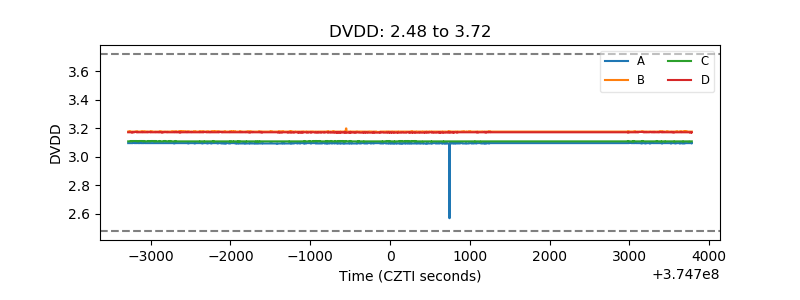 |
| Temperature 1 |  |
| Veto HV Monitor | 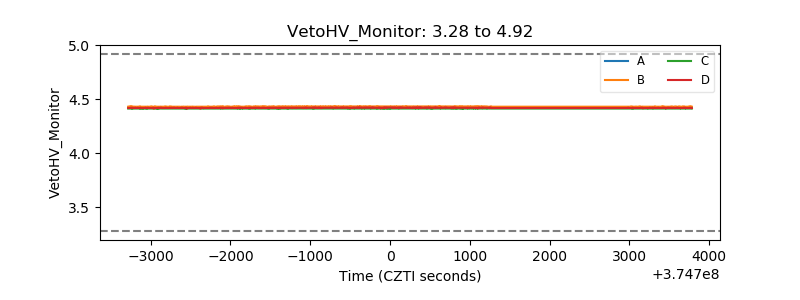 |
| Veto LLD |  |
| Alpha Counter | 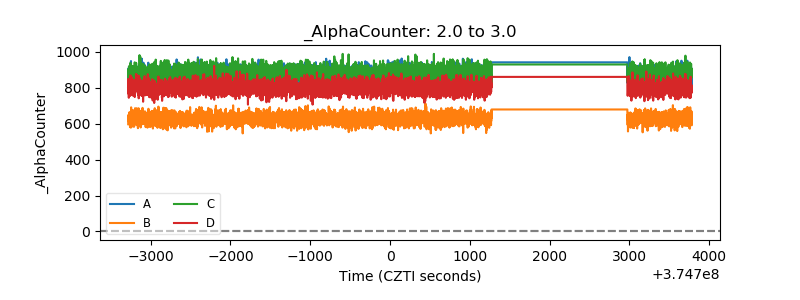 |
| _CPM_Rate | 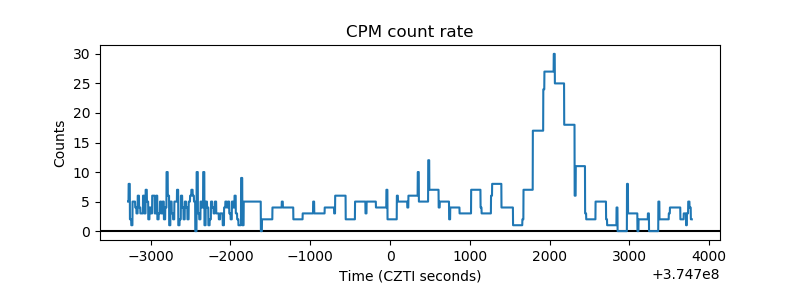 |
| CZT Counter | 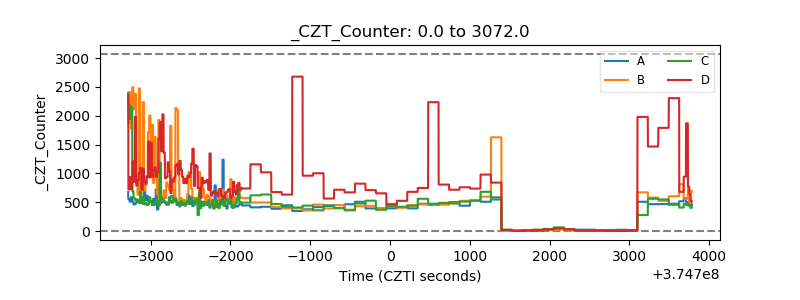 |
| +2.5 Volts monitor |  |
| +5 Volts monitor | 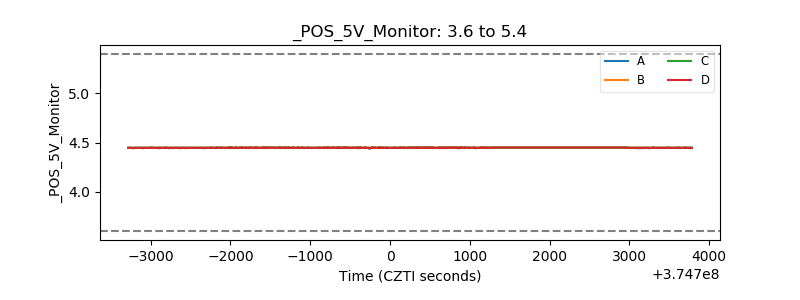 |
| _ROLL_ROT | 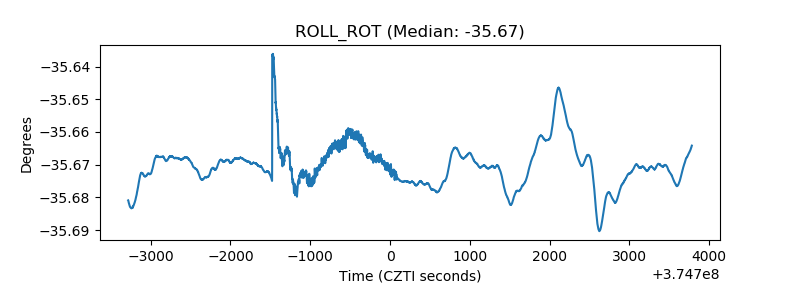 |
| _Roll_DEC | 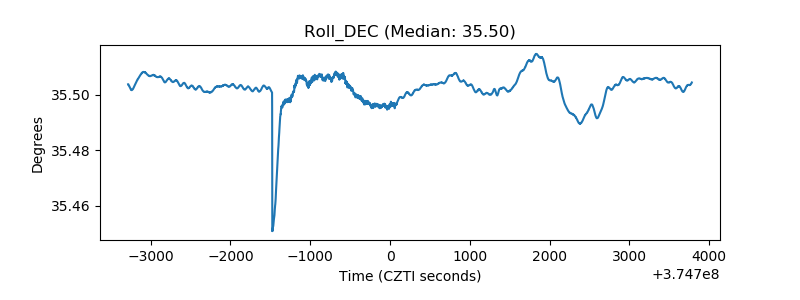 |
| _Roll_RA | 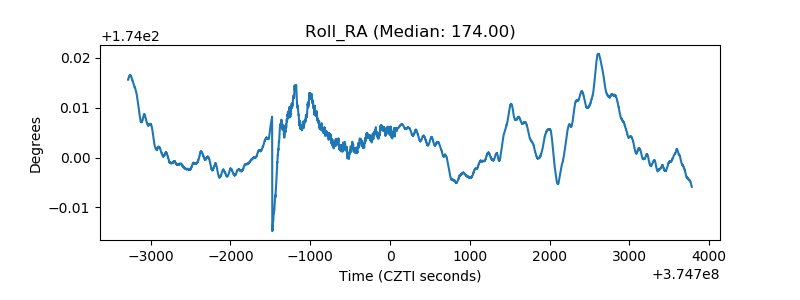 |
| Veto Counter | 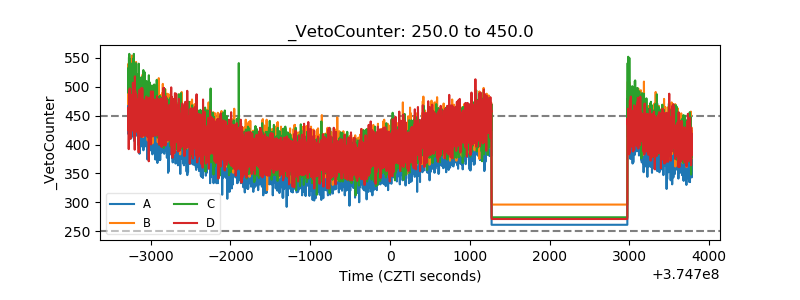 |