| Param | Original file | Final file |
|---|---|---|
| Filename | modeM0/AS1A11_080T02_9000004768_33167cztM0_level2.evt | modeM0/AS1A11_080T02_9000004768_33167cztM0_level2_quad_clean.evt |
| Size (bytes) | 477,613,440 | 86,791,680 |
| Size | 455.5 MB | 82.8 MB |
| Events in quadrant A | 2,666,773 | 565,875 |
| Events in quadrant B | 3,511,819 | 560,544 |
| Events in quadrant C | 2,930,693 | 560,961 |
| Events in quadrant D | 4,959,022 | 533,029 |
| Mode M9 | |||
|---|---|---|---|
| Quadrant | BADHDUFLAG | Total packets | Discarded packets |
| A | 0 | 19 | 0 |
| B | 0 | 19 | 0 |
| C | 0 | 19 | 0 |
| D | 0 | 20 | 0 |
| Mode SS | |||
|---|---|---|---|
| Quadrant | BADHDUFLAG | Total packets | Discarded packets |
| A | 0 | 118 | 0 |
| B | 0 | 118 | 0 |
| C | 0 | 118 | 0 |
| D | 0 | 118 | 0 |
| Mode M0 | |||
|---|---|---|---|
| Quadrant | BADHDUFLAG | Total packets | Discarded packets |
| A | 0 | 11756 | 3 |
| B | 0 | 14361 | 2 |
| C | 0 | 12594 | 2 |
| D | 0 | 18910 | 2 |
| Quadrant | Total seconds | Saturated seconds | Saturation percentage |
|---|---|---|---|
| A | 5841 | 4 | 0.068481% |
| B | 5841 | 215 | 3.680877% |
| C | 5841 | 106 | 1.814758% |
| D | 5841 | 313 | 5.358671% |
Noise dominated data is calculated using 1-second bins in cleaned event files. If a bin has >2000 counts, and if more than 50% of those come from <1% of pixels, then it is considered to be noise-dominated and hence unusable.
| Quadrant | # 1 sec bins | Bins with >0 counts | Bins with >2000 counts | High rate bins dominated by noise | Noise dominated (total time) | Noise dominated (detector-on time) | Marked lightcurve |
|---|---|---|---|---|---|---|---|
| A | 7242 | 5842 | 0 | 0 | 0.00% | 0.00% | 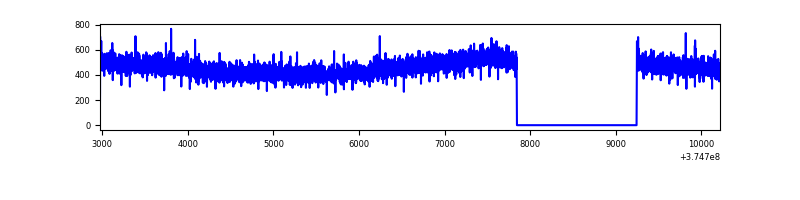 |
| B | 7242 | 5842 | 117 | 117 | 1.62% | 2.00% | 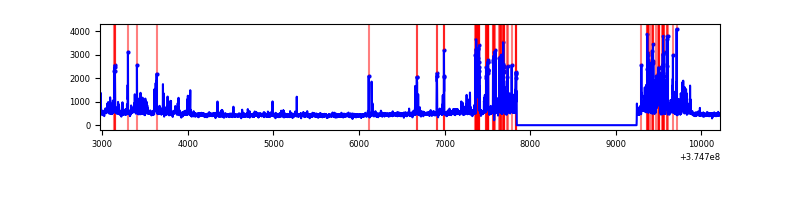 |
| C | 7242 | 5842 | 71 | 71 | 0.98% | 1.22% | 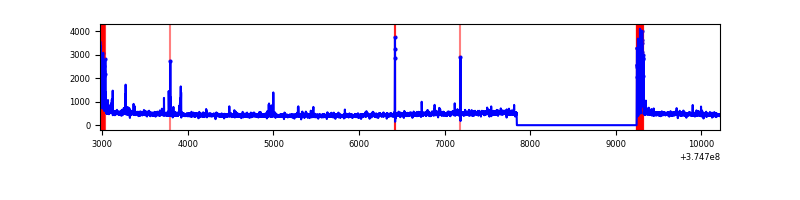 |
| D | 7242 | 5842 | 223 | 223 | 3.08% | 3.82% | 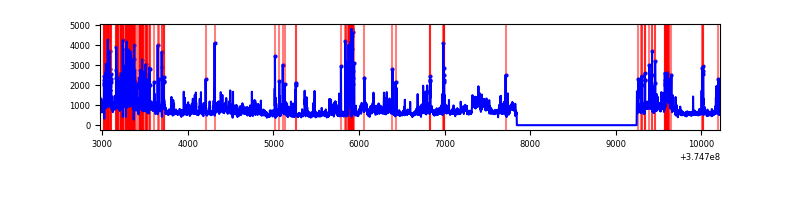 |
Top three noisy pixels from each quadrant. If the there are fewer than three noisy pixels in the level2.evt file, extra rows are filled as -1
| Pixel properties | Quadrant properties | ||||||
|---|---|---|---|---|---|---|---|
| Quadrant | DetID | PixID | Counts | Sigma | Mean | Median | Sigma |
| A | 13 | 6 | 11602 | 78.78 | 686 | 671 | 138.7 |
| A | 13 | 254 | 9790 | 65.72 | 686 | 671 | 138.7 |
| A | 3 | 137 | 6535 | 42.26 | 686 | 671 | 138.7 |
| B | 5 | 172 | 521568 | 4030.63 | 674 | 656 | 129.2 |
| B | 0 | 197 | 141883 | 1092.76 | 674 | 656 | 129.2 |
| B | 0 | 190 | 58793 | 449.84 | 674 | 656 | 129.2 |
| C | 0 | 10 | 249300 | 1617.52 | 660 | 665 | 153.7 |
| C | 1 | 241 | 34040 | 217.12 | 660 | 665 | 153.7 |
| C | 14 | 67 | 27300 | 173.28 | 660 | 665 | 153.7 |
| D | 8 | 195 | 902430 | 5457.85 | 648 | 633 | 165.2 |
| D | 1 | 47 | 411901 | 2489.08 | 648 | 633 | 165.2 |
| D | 10 | 203 | 355947 | 2150.43 | 648 | 633 | 165.2 |
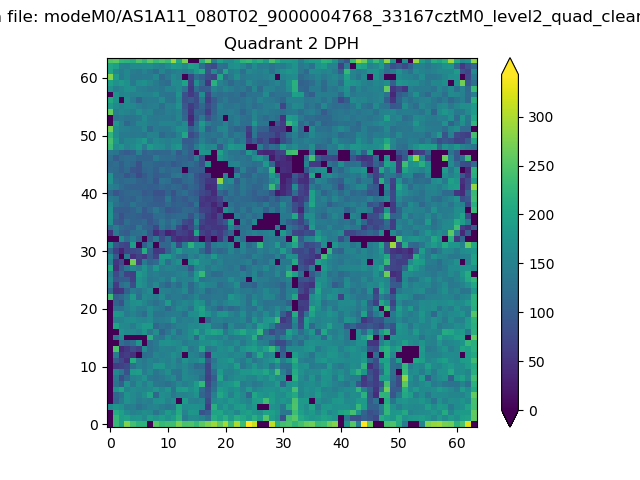
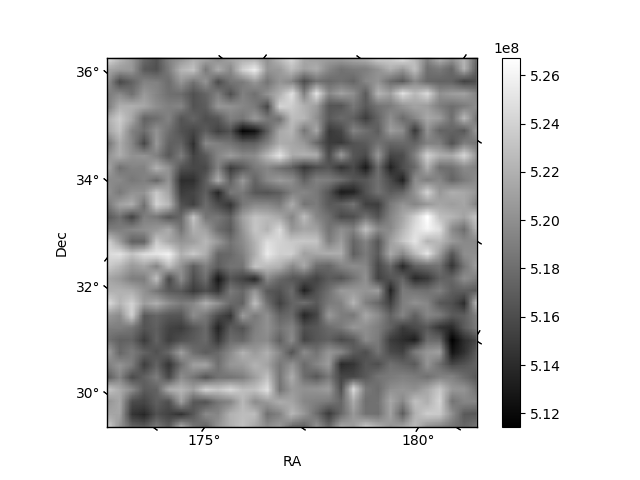
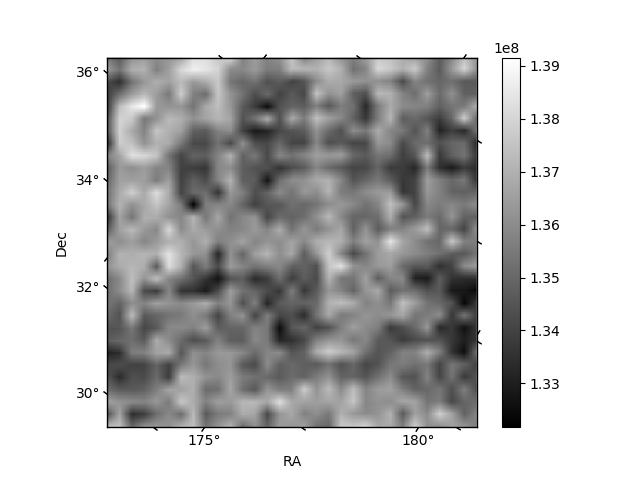
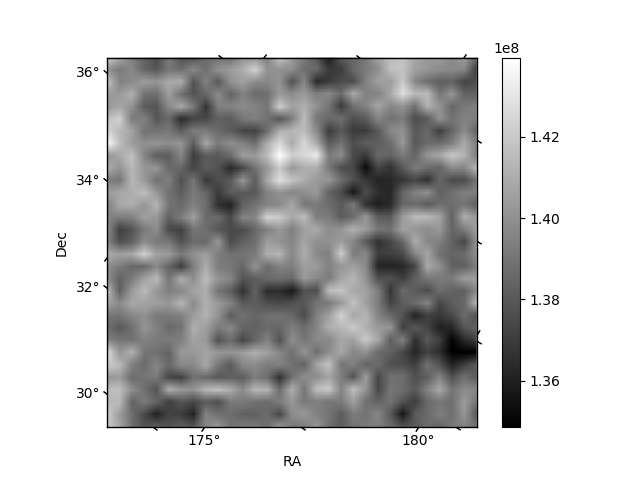
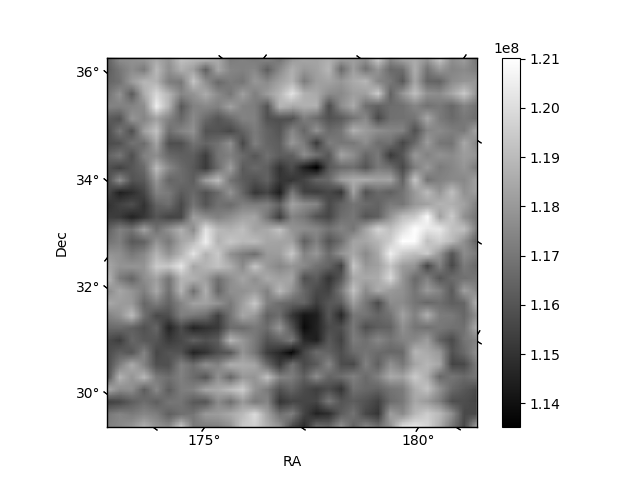
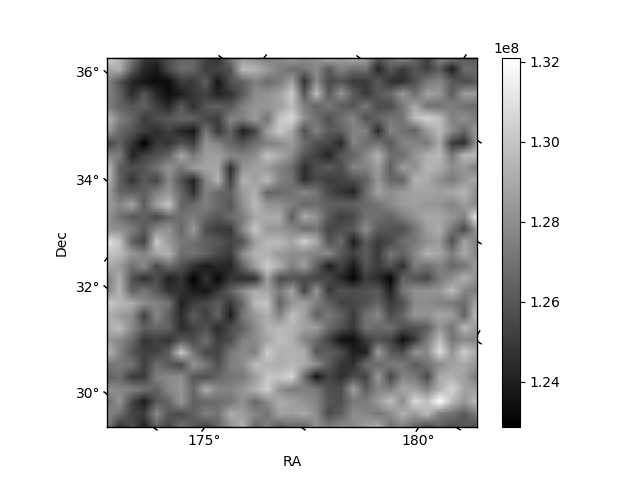
Histogram calculated using DETX and DETY for each event in the final _common_clean file
| Quadrant A | 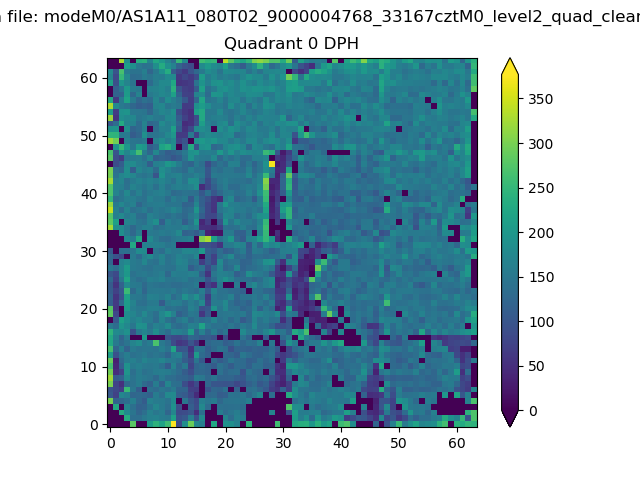 |
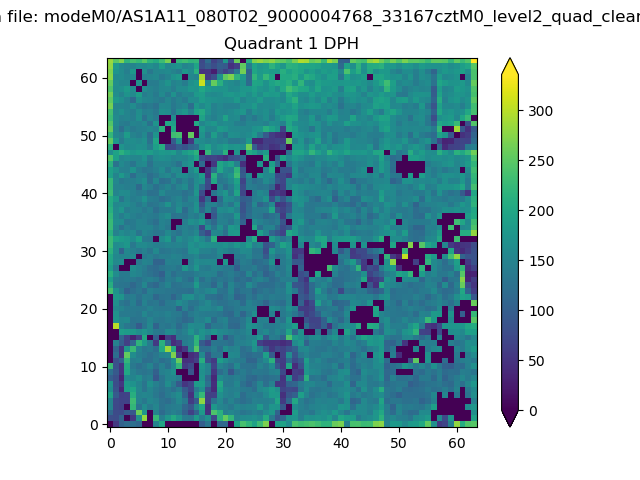 |
Quadrant B |
|---|---|---|---|
| Quadrant D | 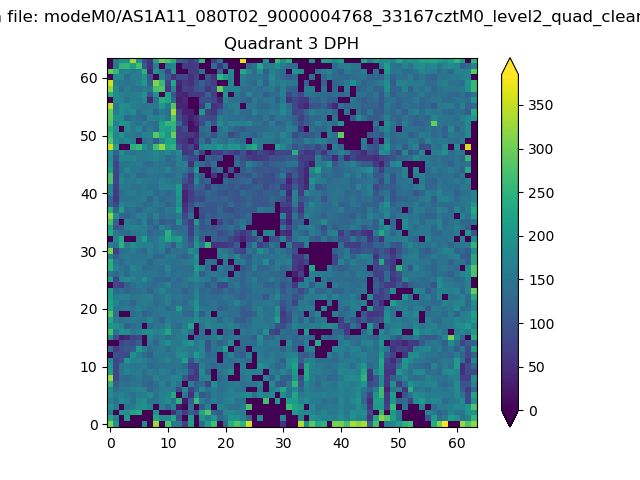 |
 |
Quadrant C |
| Plot type | Count rate plots | Images |
|---|---|---|
| Comparison with Poisson distribution Blue bars denote a histogram of data divided into 1 sec bins. Red curve is a Poisson curve with rate = median count rate of data. |
 |
 |
| Quadrant-wise count rates Data is divided into 100 sec bins |
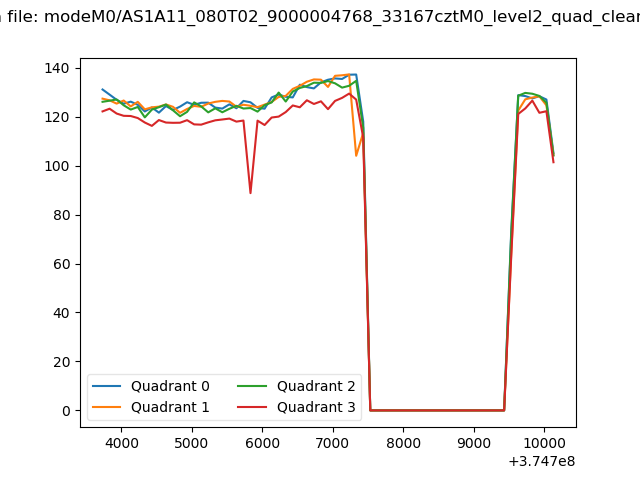 |
|
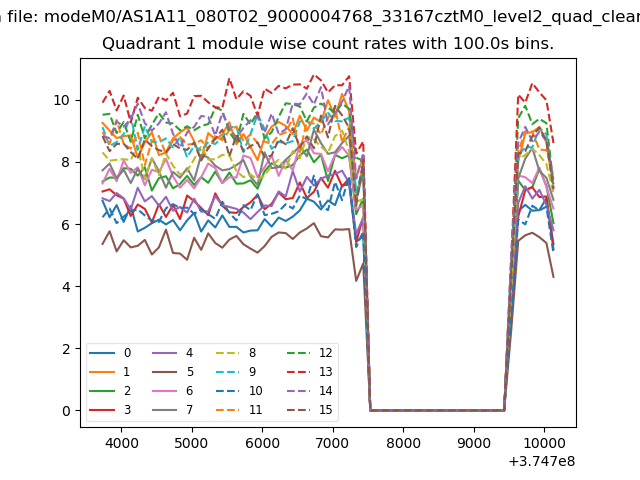
| Module-wise count rates for Quadrant A Data is divided into 100 sec bins |
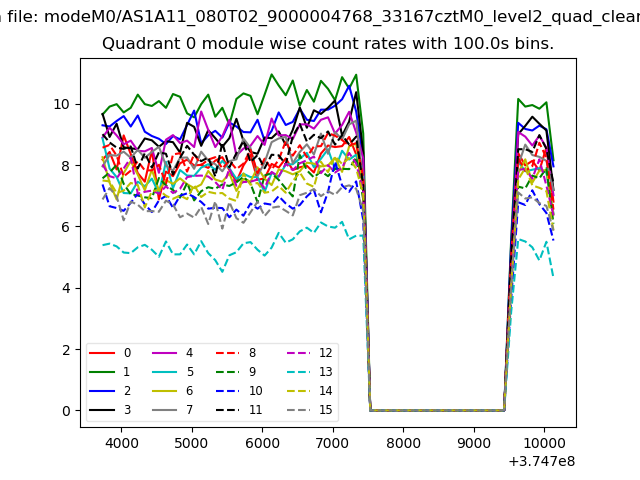 |
 |
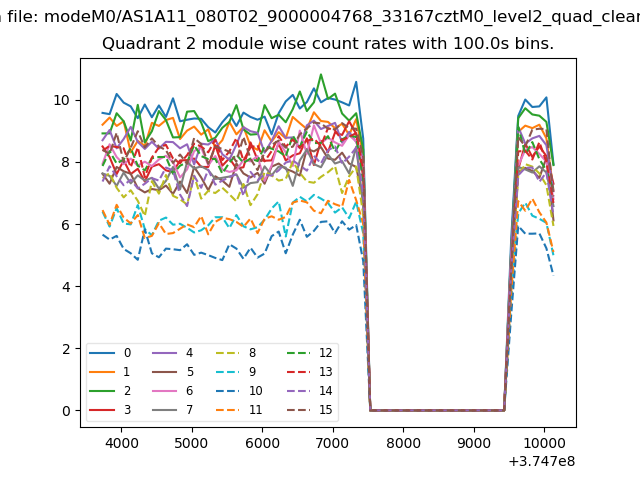
| Module-wise count rates for Quadrant B Data is divided into 100 sec bins |
 |
 |
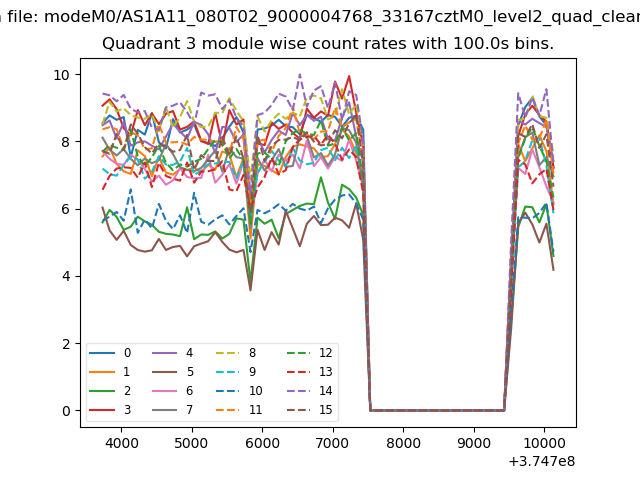
| Module-wise count rates for Quadrant C Data is divided into 100 sec bins |
 |
 |
| Module-wise count rates for Quadrant D Data is divided into 100 sec bins |
 |
 |
| Parameter | Plot |
|---|---|
| CZT HV Monitor | 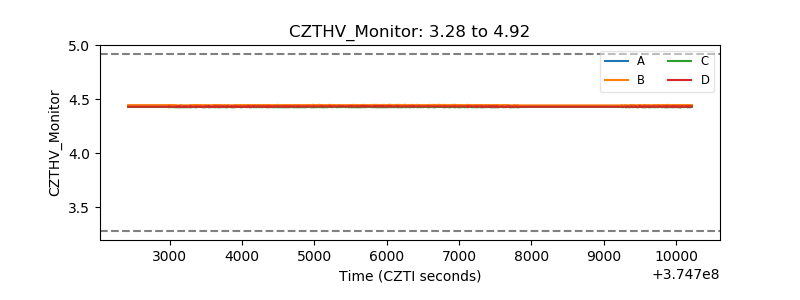 |
| D_VDD | 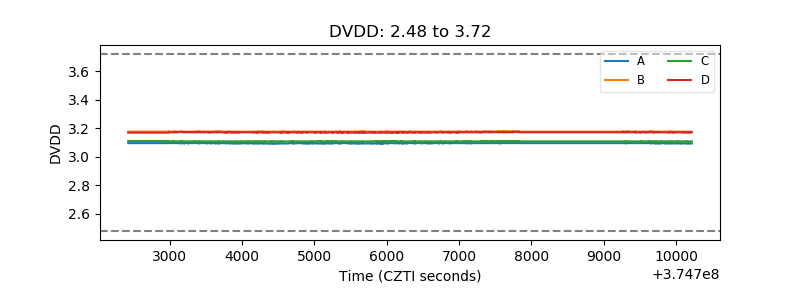 |
| Temperature 1 |  |
| Veto HV Monitor | 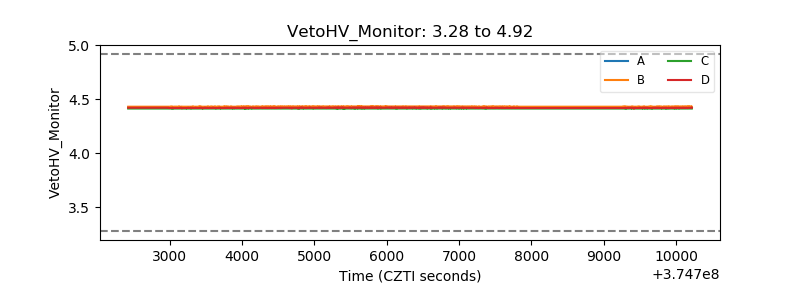 |
| Veto LLD | 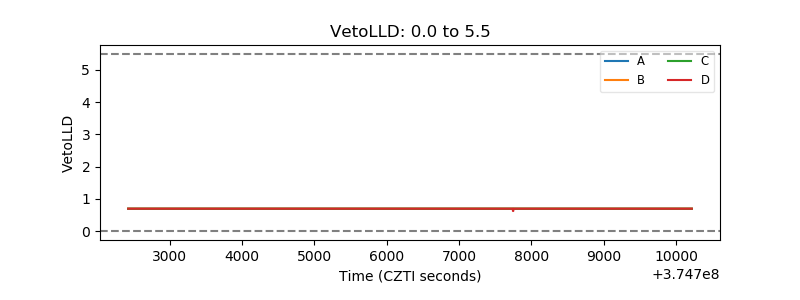 |
| Alpha Counter | 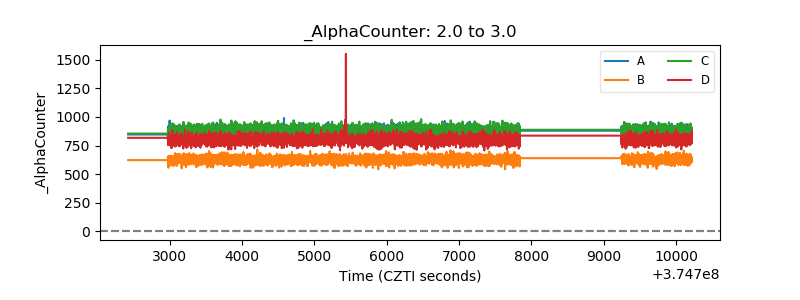 |
| _CPM_Rate | 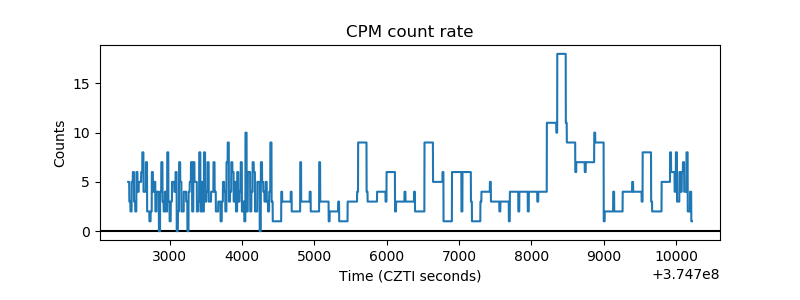 |
| CZT Counter | 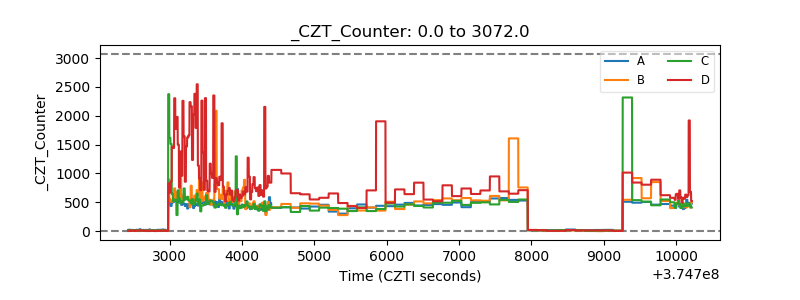 |
| +2.5 Volts monitor |  |
| +5 Volts monitor |  |
| _ROLL_ROT | 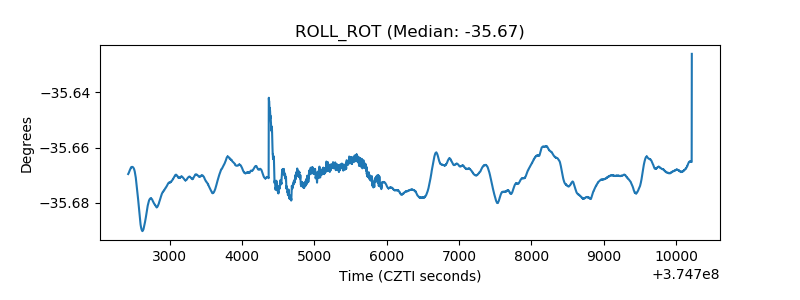 |
| _Roll_DEC | 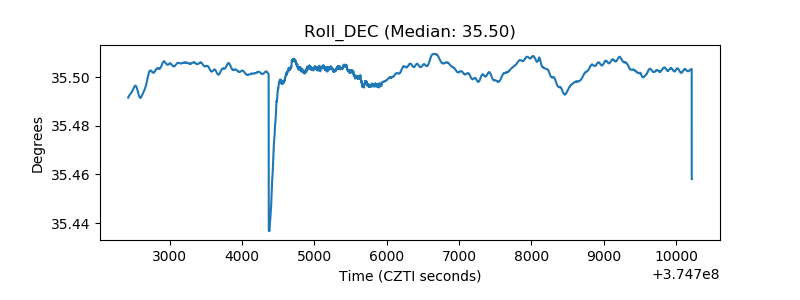 |
| _Roll_RA | 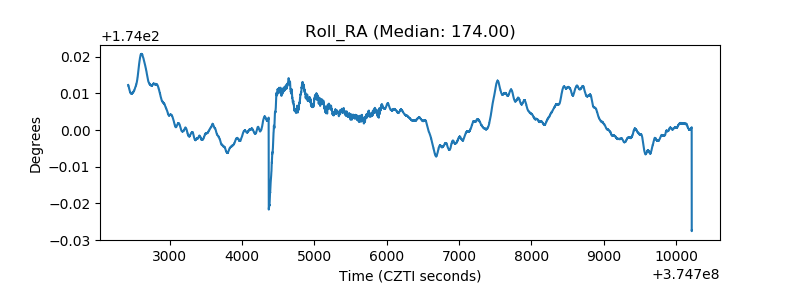 |
| Veto Counter | 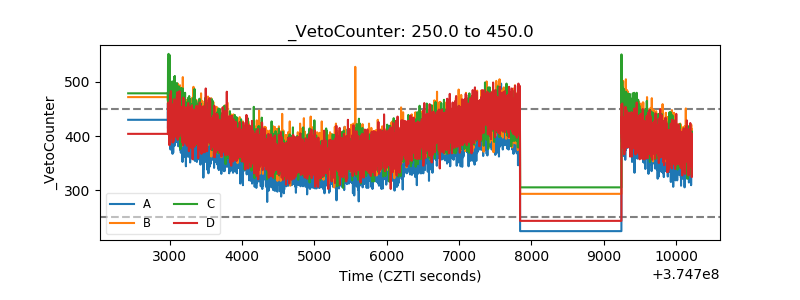 |