| Param | Original file | Final file |
|---|---|---|
| Filename | modeM0/AS1A11_080T02_9000004768_33171cztM0_level2.evt | modeM0/AS1A11_080T02_9000004768_33171cztM0_level2_quad_clean.evt |
| Size (bytes) | 1,260,538,560 | 205,974,720 |
| Size | 1.2 GB | 196.4 MB |
| Events in quadrant A | 6,989,397 | 1,321,086 |
| Events in quadrant B | 9,486,421 | 1,321,148 |
| Events in quadrant C | 7,476,633 | 1,300,159 |
| Events in quadrant D | 13,175,428 | 1,224,652 |
| Mode M9 | |||
|---|---|---|---|
| Quadrant | BADHDUFLAG | Total packets | Discarded packets |
| A | 0 | 50 | 0 |
| B | 0 | 50 | 0 |
| C | 0 | 50 | 0 |
| D | 0 | 51 | 0 |
| Mode SS | |||
|---|---|---|---|
| Quadrant | BADHDUFLAG | Total packets | Discarded packets |
| A | 0 | 318 | 0 |
| B | 0 | 318 | 0 |
| C | 0 | 318 | 0 |
| D | 0 | 318 | 0 |
| Mode M0 | |||
|---|---|---|---|
| Quadrant | BADHDUFLAG | Total packets | Discarded packets |
| A | 0 | 31360 | 5 |
| B | 0 | 38934 | 4 |
| C | 0 | 32854 | 4 |
| D | 0 | 50166 | 4 |
| Quadrant | Total seconds | Saturated seconds | Saturation percentage |
|---|---|---|---|
| A | 15522 | 18 | 0.115964% |
| B | 15522 | 622 | 4.007216% |
| C | 15522 | 106 | 0.682902% |
| D | 15522 | 611 | 3.936348% |
Noise dominated data is calculated using 1-second bins in cleaned event files. If a bin has >2000 counts, and if more than 50% of those come from <1% of pixels, then it is considered to be noise-dominated and hence unusable.
| Quadrant | # 1 sec bins | Bins with >0 counts | Bins with >2000 counts | High rate bins dominated by noise | Noise dominated (total time) | Noise dominated (detector-on time) | Marked lightcurve |
|---|---|---|---|---|---|---|---|
| A | 19788 | 15525 | 0 | 0 | 0.00% | 0.00% | 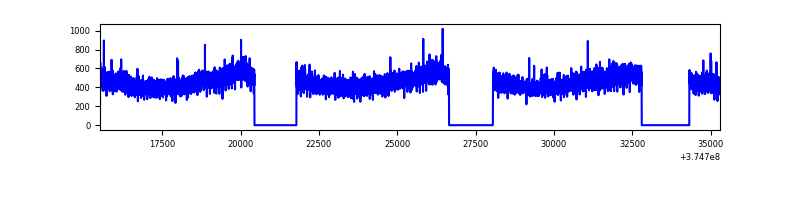 |
| B | 19788 | 15525 | 352 | 352 | 1.78% | 2.27% | 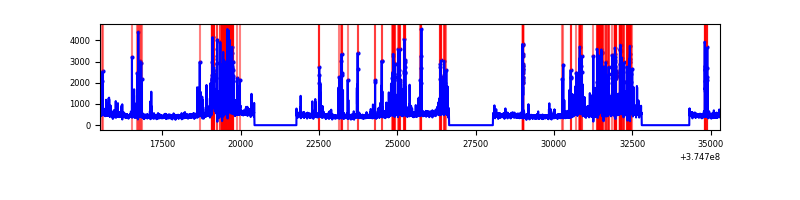 |
| C | 19788 | 15525 | 73 | 73 | 0.37% | 0.47% | 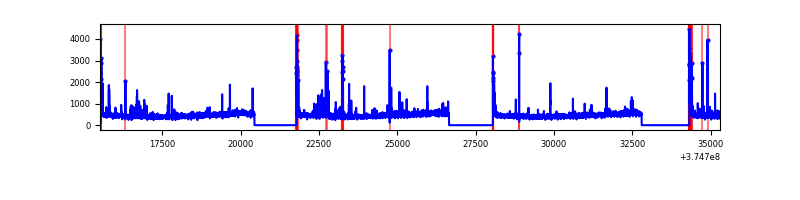 |
| D | 19788 | 15525 | 490 | 490 | 2.48% | 3.16% | 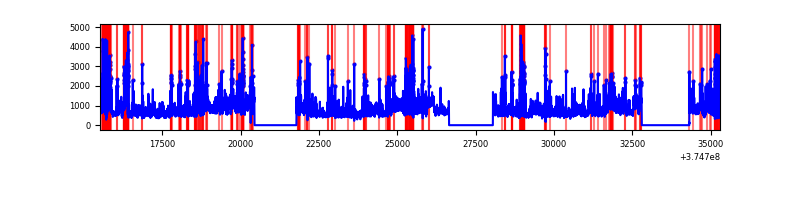 |
Top three noisy pixels from each quadrant. If the there are fewer than three noisy pixels in the level2.evt file, extra rows are filled as -1
| Pixel properties | Quadrant properties | ||||||
|---|---|---|---|---|---|---|---|
| Quadrant | DetID | PixID | Counts | Sigma | Mean | Median | Sigma |
| A | 13 | 254 | 26118 | 67.67 | 1801 | 1767 | 359.8 |
| A | 13 | 6 | 20425 | 51.85 | 1801 | 1767 | 359.8 |
| A | 3 | 137 | 17041 | 42.45 | 1801 | 1767 | 359.8 |
| B | 5 | 172 | 1966169 | 5833.99 | 1766 | 1719 | 336.7 |
| B | 0 | 219 | 196828 | 579.43 | 1766 | 1719 | 336.7 |
| B | 5 | 200 | 78956 | 229.38 | 1766 | 1719 | 336.7 |
| C | 0 | 10 | 291284 | 722.05 | 1735 | 1748 | 401.0 |
| C | 1 | 241 | 204430 | 505.45 | 1735 | 1748 | 401.0 |
| C | 14 | 67 | 88350 | 215.97 | 1735 | 1748 | 401.0 |
| D | 8 | 195 | 3062876 | 6730.42 | 1708 | 1665 | 454.8 |
| D | 2 | 250 | 1099878 | 2414.54 | 1708 | 1665 | 454.8 |
| D | 10 | 203 | 938538 | 2059.82 | 1708 | 1665 | 454.8 |
Histogram calculated using DETX and DETY for each event in the final _common_clean file
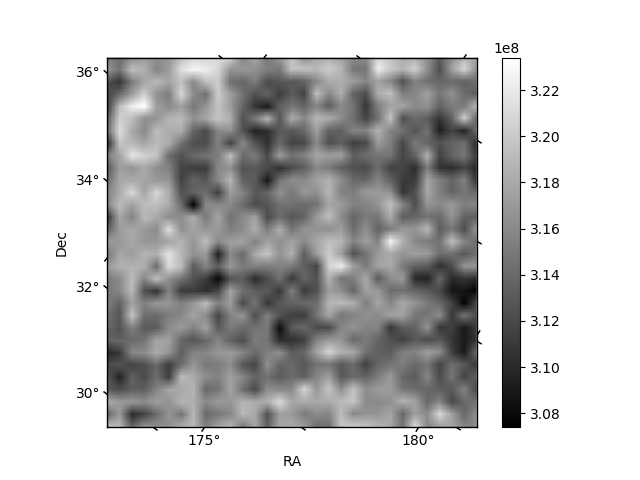
| Quadrant A | 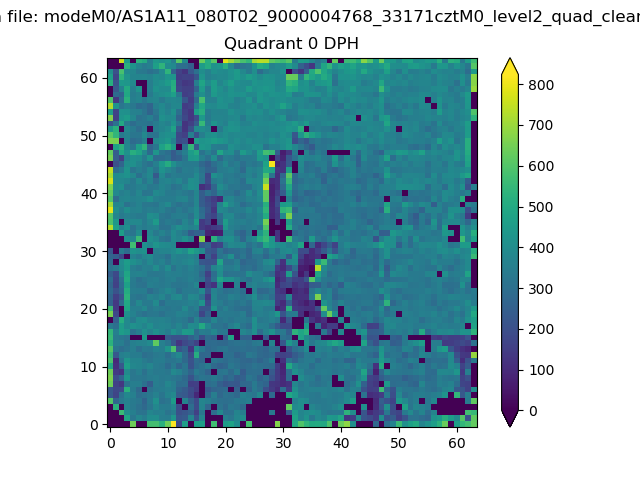 |
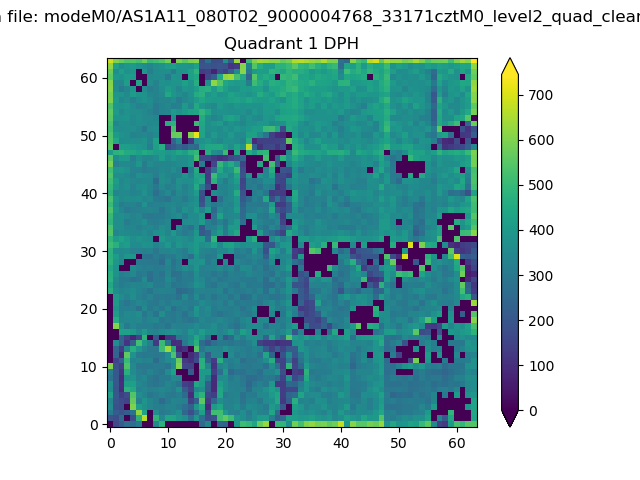 |
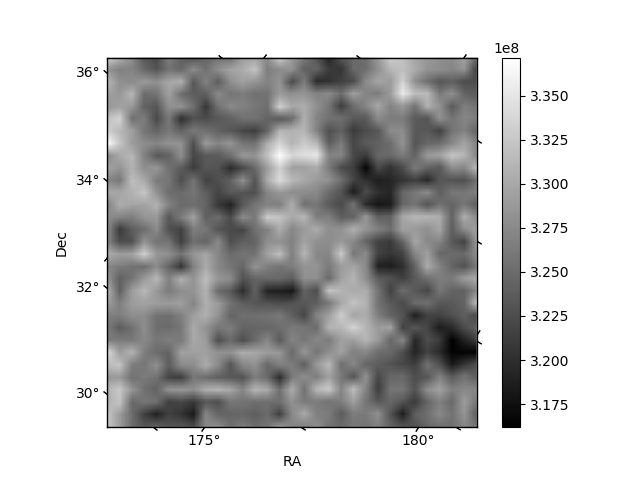
Quadrant B |
|---|---|---|---|
| Quadrant D | 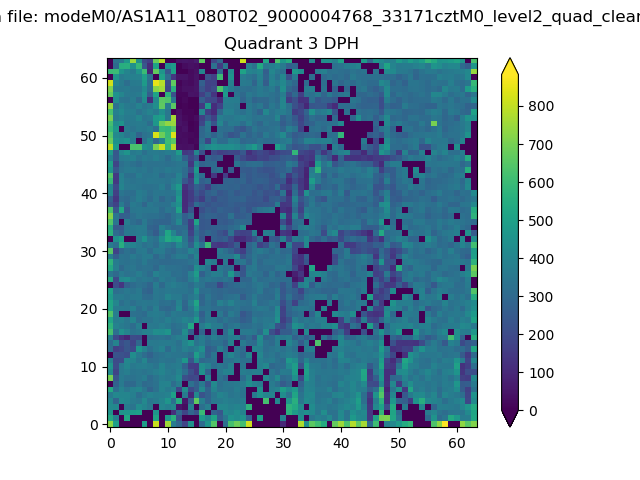 |
 |
Quadrant C |
| Plot type | Count rate plots | Images |
|---|---|---|
| Comparison with Poisson distribution Blue bars denote a histogram of data divided into 1 sec bins. Red curve is a Poisson curve with rate = median count rate of data. |
 |
 |
| Quadrant-wise count rates Data is divided into 100 sec bins |
 |
|
| Module-wise count rates for Quadrant A Data is divided into 100 sec bins |
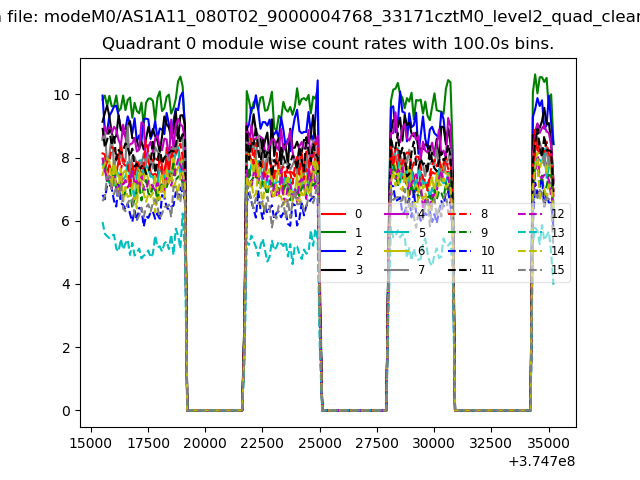 |
 |
| Module-wise count rates for Quadrant B Data is divided into 100 sec bins |
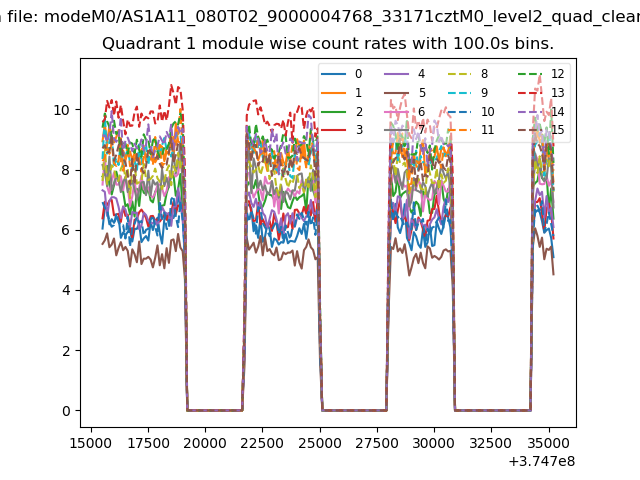 |
 |
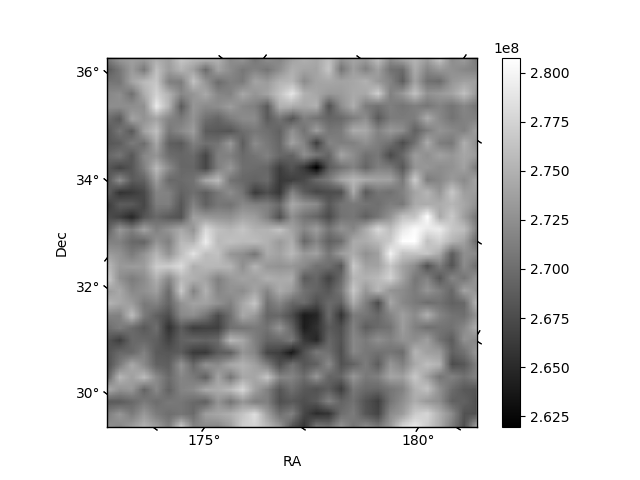
| Module-wise count rates for Quadrant C Data is divided into 100 sec bins |
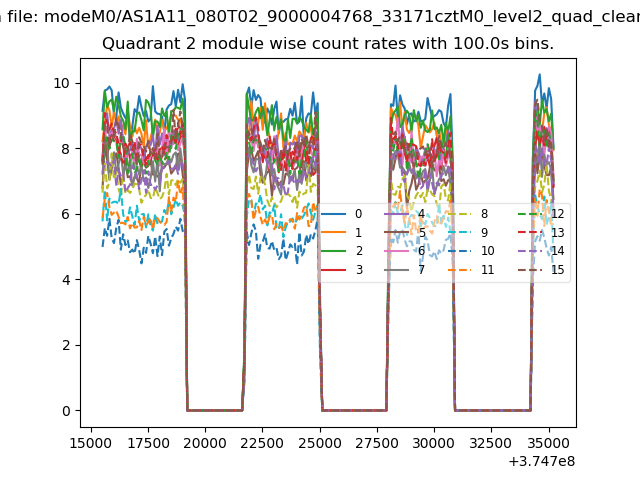 |
 |
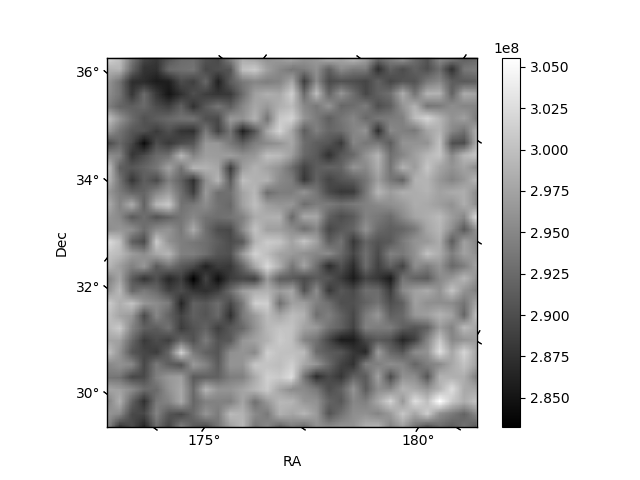
| Module-wise count rates for Quadrant D Data is divided into 100 sec bins |
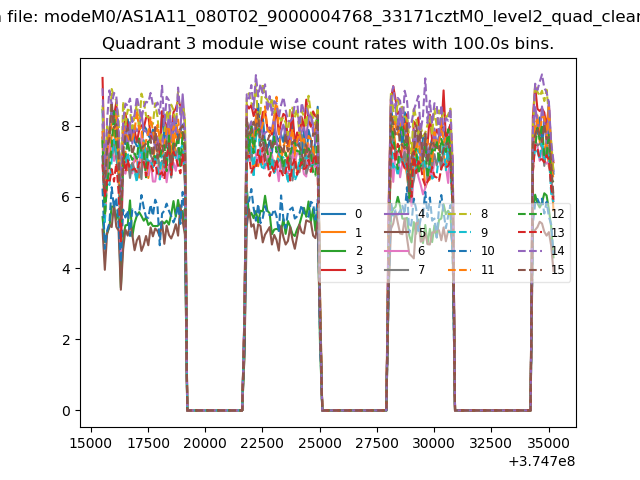 |
 |
| Parameter | Plot |
|---|---|
| CZT HV Monitor | 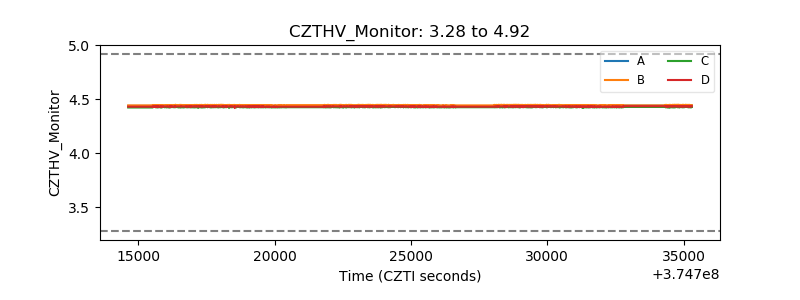 |
| D_VDD | 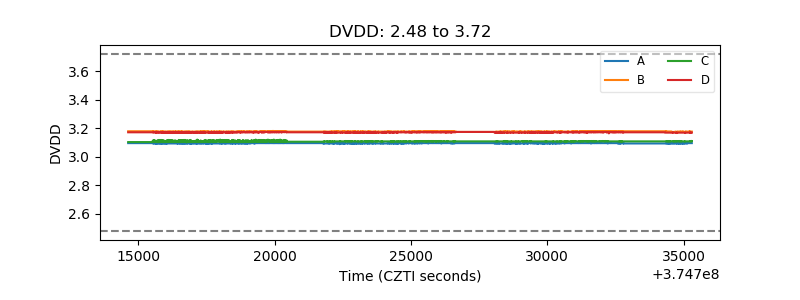 |
| Temperature 1 | 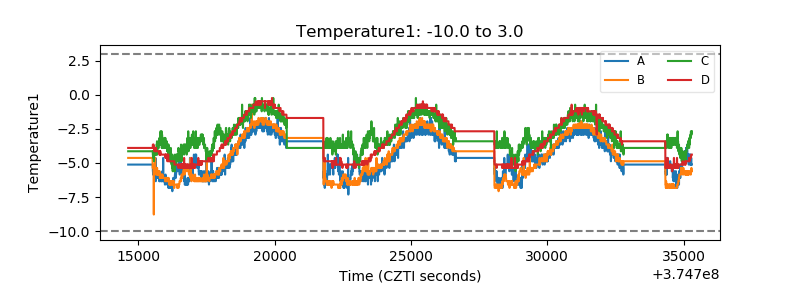 |
| Veto HV Monitor |  |
| Veto LLD | 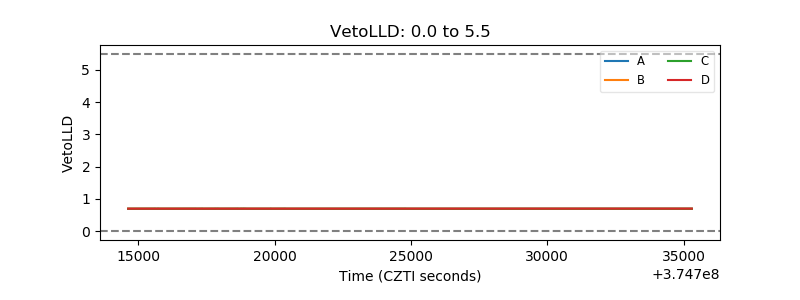 |
| Alpha Counter | 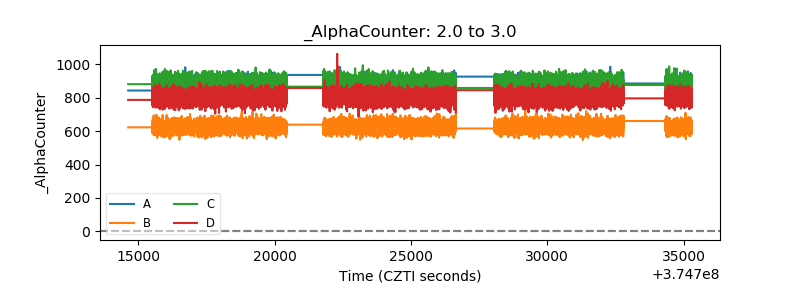 |
| _CPM_Rate | 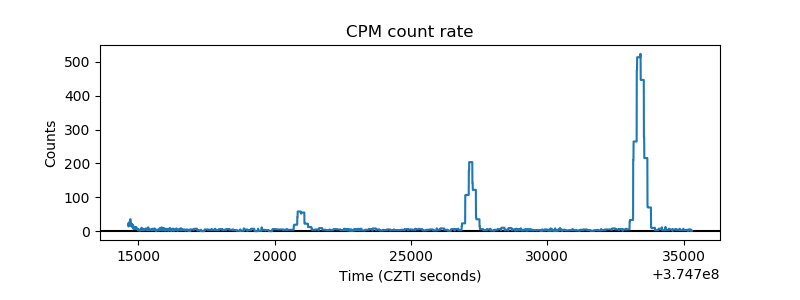 |
| CZT Counter | 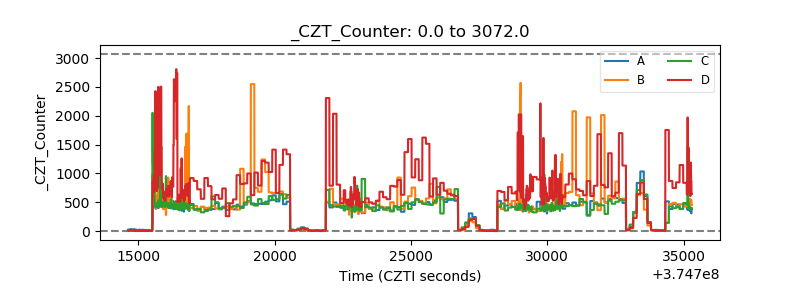 |
| +2.5 Volts monitor |  |
| +5 Volts monitor |  |
| _ROLL_ROT | 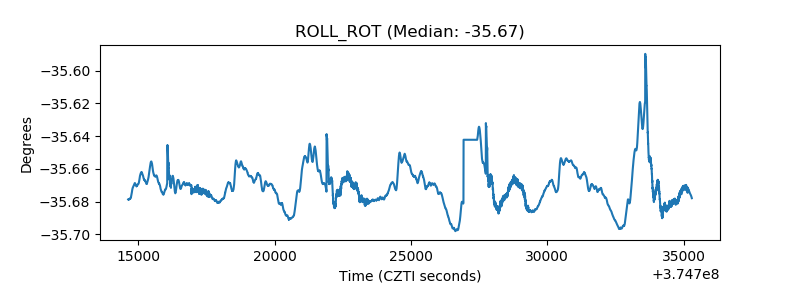 |
| _Roll_DEC | 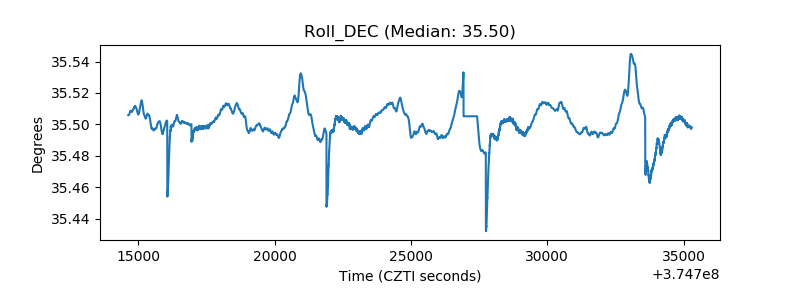 |
| _Roll_RA |  |
| Veto Counter | 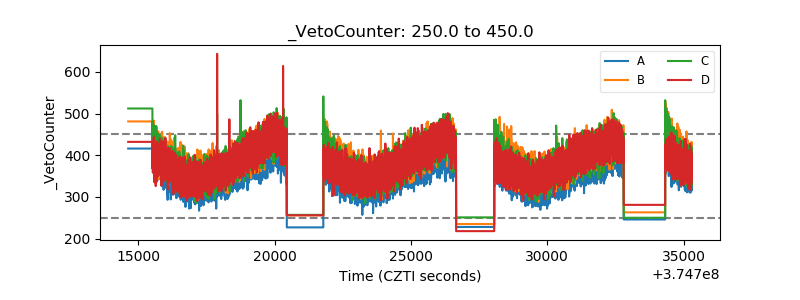 |