| Param | Original file | Final file |
|---|---|---|
| Filename | modeM0/AS1A11_080T02_9000004768_33172cztM0_level2.evt | modeM0/AS1A11_080T02_9000004768_33172cztM0_level2_quad_clean.evt |
| Size (bytes) | 454,469,760 | 66,507,840 |
| Size | 433.4 MB | 63.4 MB |
| Events in quadrant A | 2,429,647 | 416,496 |
| Events in quadrant B | 3,265,576 | 421,738 |
| Events in quadrant C | 2,531,151 | 413,347 |
| Events in quadrant D | 5,172,852 | 386,144 |
| Mode M9 | |||
|---|---|---|---|
| Quadrant | BADHDUFLAG | Total packets | Discarded packets |
| A | 0 | 16 | 0 |
| B | 0 | 16 | 0 |
| C | 0 | 16 | 0 |
| D | 0 | 16 | 0 |
| Mode SS | |||
|---|---|---|---|
| Quadrant | BADHDUFLAG | Total packets | Discarded packets |
| A | 0 | 110 | 0 |
| B | 0 | 110 | 0 |
| C | 0 | 110 | 0 |
| D | 0 | 110 | 0 |
| Mode M0 | |||
|---|---|---|---|
| Quadrant | BADHDUFLAG | Total packets | Discarded packets |
| A | 0 | 10778 | 2 |
| B | 0 | 13181 | 1 |
| C | 0 | 11118 | 1 |
| D | 0 | 19247 | 1 |
| Quadrant | Total seconds | Saturated seconds | Saturation percentage |
|---|---|---|---|
| A | 5367 | 4 | 0.074530% |
| B | 5367 | 172 | 3.204770% |
| C | 5367 | 27 | 0.503074% |
| D | 5367 | 238 | 4.434507% |
Noise dominated data is calculated using 1-second bins in cleaned event files. If a bin has >2000 counts, and if more than 50% of those come from <1% of pixels, then it is considered to be noise-dominated and hence unusable.
| Quadrant | # 1 sec bins | Bins with >0 counts | Bins with >2000 counts | High rate bins dominated by noise | Noise dominated (total time) | Noise dominated (detector-on time) | Marked lightcurve |
|---|---|---|---|---|---|---|---|
| A | 7010 | 5368 | 0 | 0 | 0.00% | 0.00% | 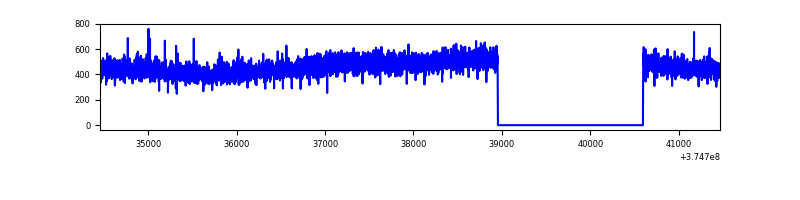 |
| B | 7010 | 5368 | 118 | 118 | 1.68% | 2.20% | 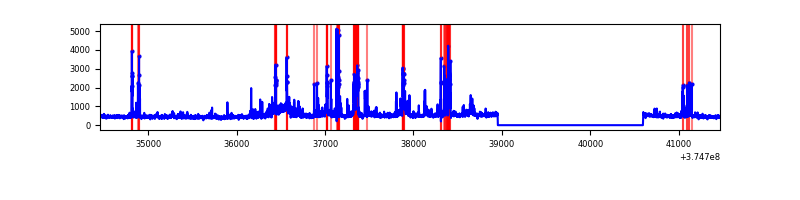 |
| C | 7010 | 5368 | 23 | 23 | 0.33% | 0.43% |  |
| D | 7010 | 5368 | 213 | 213 | 3.04% | 3.97% | 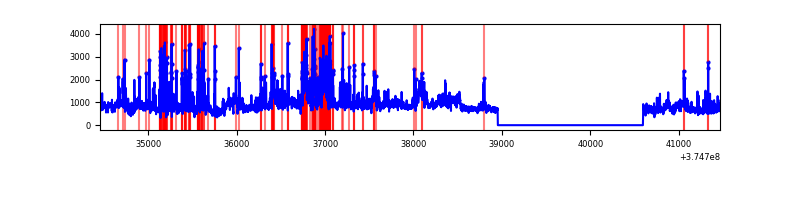 |
Top three noisy pixels from each quadrant. If the there are fewer than three noisy pixels in the level2.evt file, extra rows are filled as -1
| Pixel properties | Quadrant properties | ||||||
|---|---|---|---|---|---|---|---|
| Quadrant | DetID | PixID | Counts | Sigma | Mean | Median | Sigma |
| A | 13 | 254 | 9264 | 69.22 | 626 | 612 | 125.0 |
| A | 13 | 6 | 6746 | 49.08 | 626 | 612 | 125.0 |
| A | 3 | 137 | 5802 | 41.52 | 626 | 612 | 125.0 |
| B | 5 | 172 | 595968 | 5042.56 | 615 | 599 | 118.1 |
| B | 0 | 219 | 160214 | 1351.88 | 615 | 599 | 118.1 |
| B | 4 | 81 | 21257 | 174.97 | 615 | 599 | 118.1 |
| C | 0 | 10 | 76538 | 547.56 | 602 | 606 | 138.7 |
| C | 9 | 187 | 30562 | 216.02 | 602 | 606 | 138.7 |
| C | 14 | 67 | 30421 | 215.0 | 602 | 606 | 138.7 |
| D | 10 | 203 | 1021179 | 6456.71 | 595 | 581 | 158.1 |
| D | 8 | 195 | 796265 | 5033.81 | 595 | 581 | 158.1 |
| D | 1 | 47 | 483295 | 3053.84 | 595 | 581 | 158.1 |
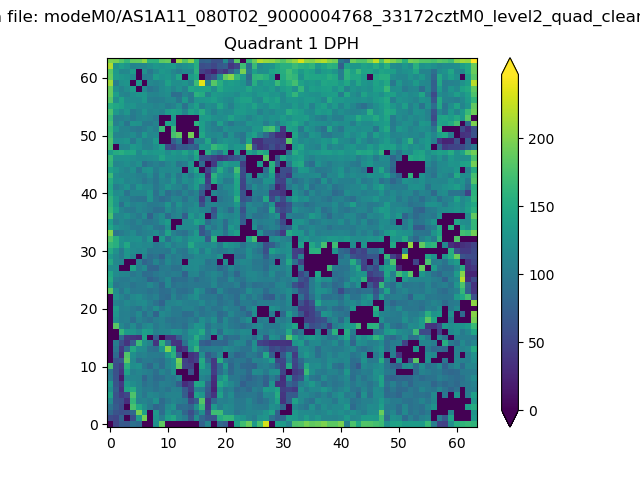
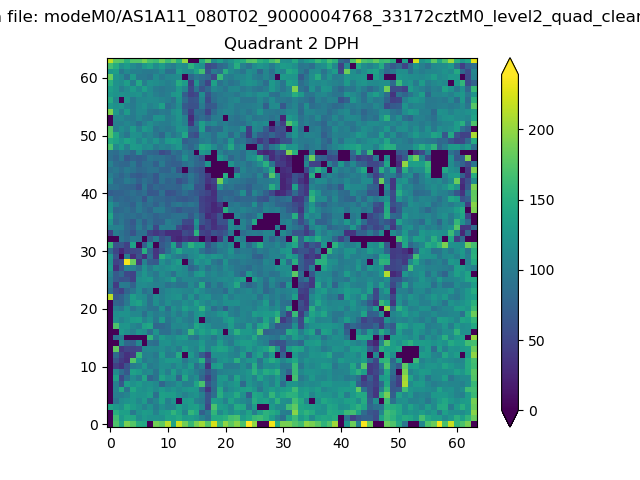
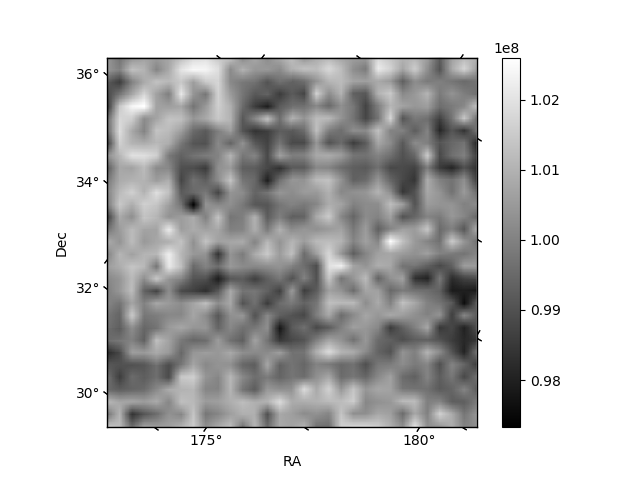
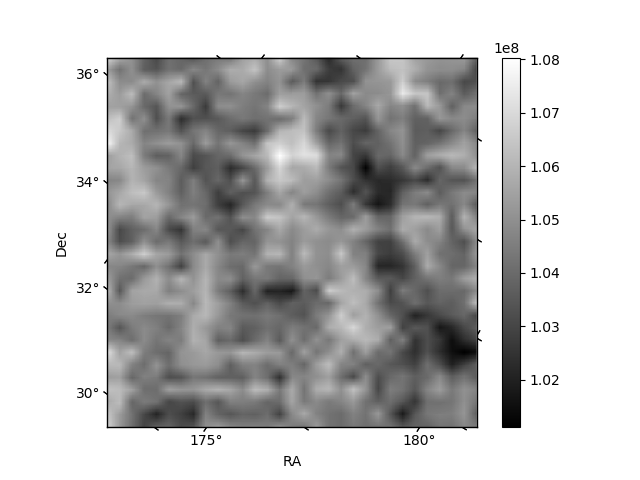
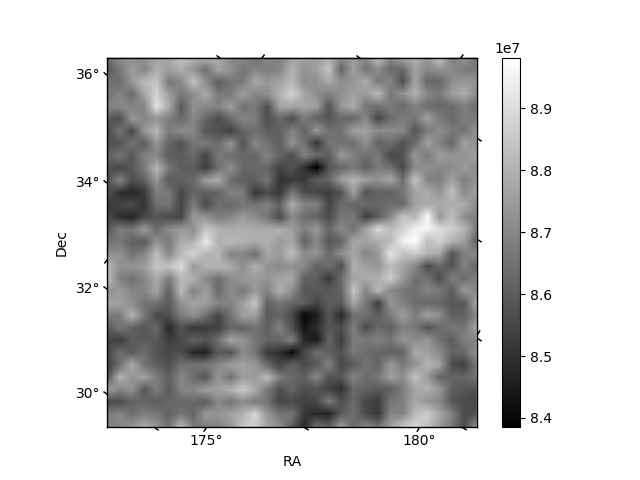
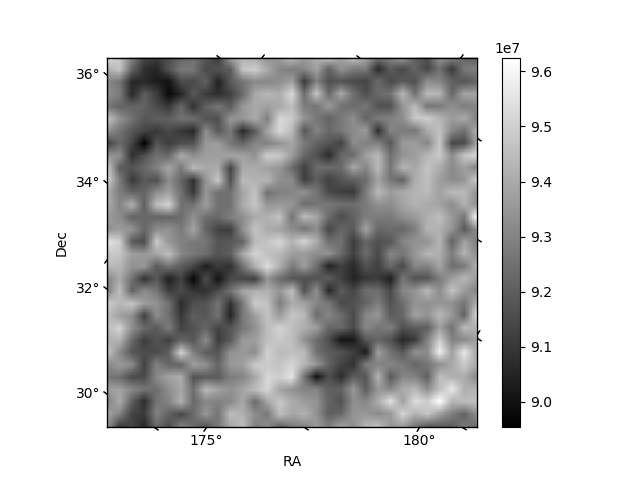
Histogram calculated using DETX and DETY for each event in the final _common_clean file
| Quadrant A |  |
 |
Quadrant B |
|---|---|---|---|
| Quadrant D | 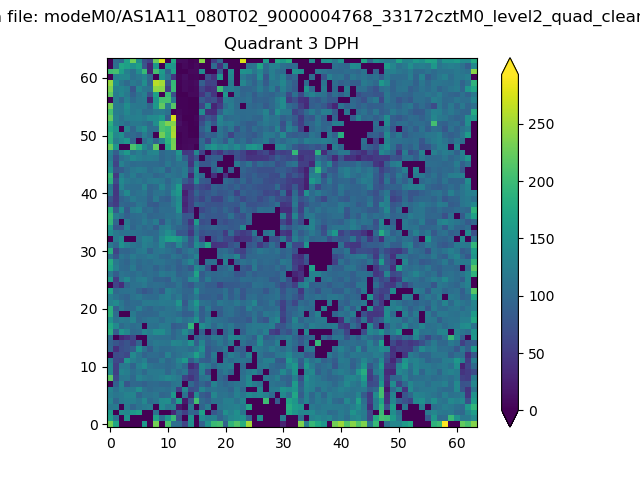 |
 |
Quadrant C |
| Plot type | Count rate plots | Images |
|---|---|---|
| Comparison with Poisson distribution Blue bars denote a histogram of data divided into 1 sec bins. Red curve is a Poisson curve with rate = median count rate of data. |
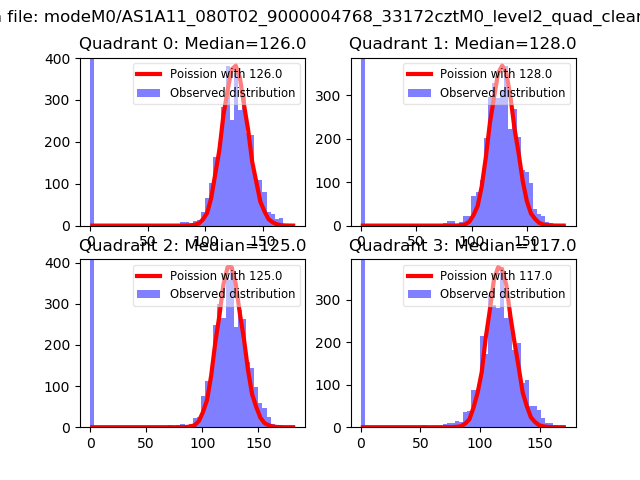 |
 |
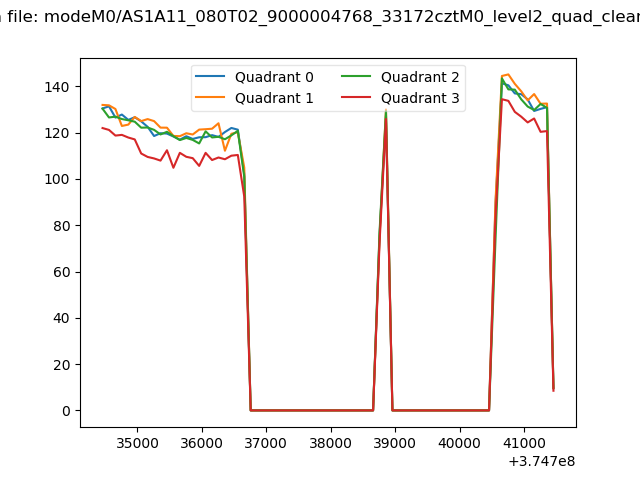
| Quadrant-wise count rates Data is divided into 100 sec bins |
 |
|
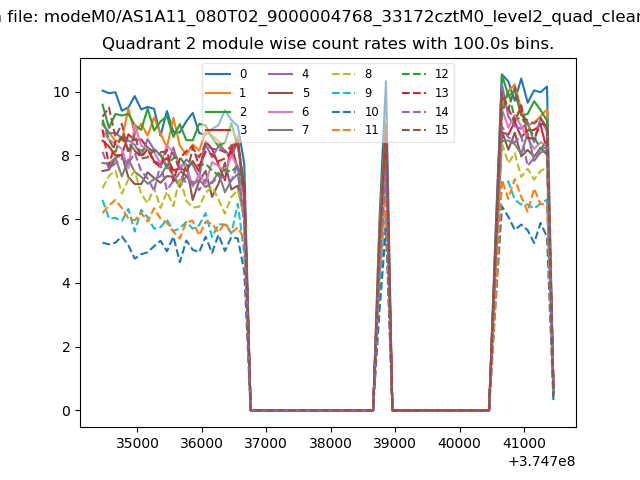
| Module-wise count rates for Quadrant A Data is divided into 100 sec bins |
 |
 |
| Module-wise count rates for Quadrant B Data is divided into 100 sec bins |
 |
 |
| Module-wise count rates for Quadrant C Data is divided into 100 sec bins |
 |
 |
| Module-wise count rates for Quadrant D Data is divided into 100 sec bins |
 |
 |
| Parameter | Plot |
|---|---|
| CZT HV Monitor |  |
| D_VDD | 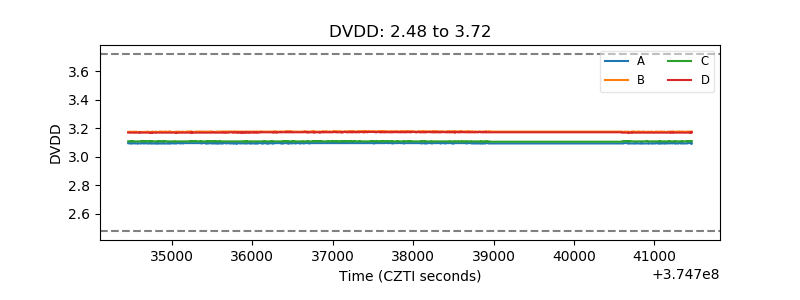 |
| Temperature 1 | 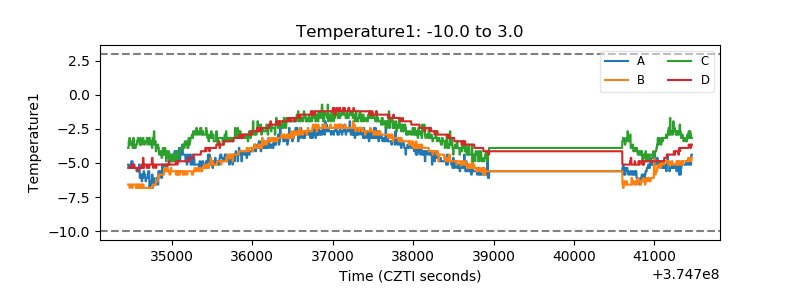 |
| Veto HV Monitor | 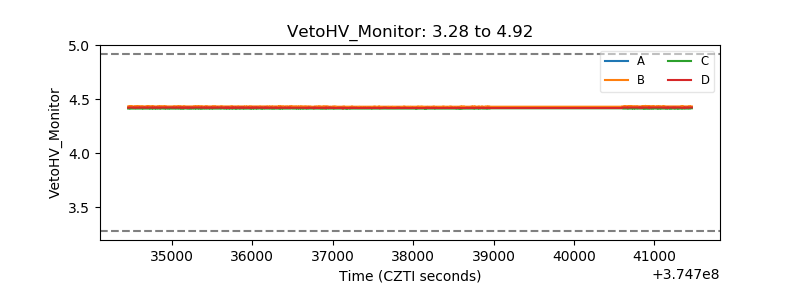 |
| Veto LLD |  |
| Alpha Counter |  |
| _CPM_Rate | 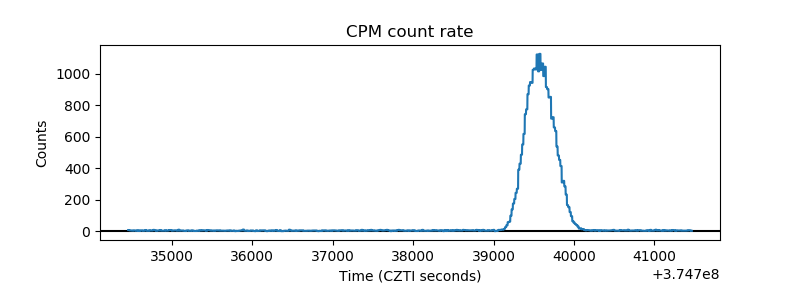 |
| CZT Counter | 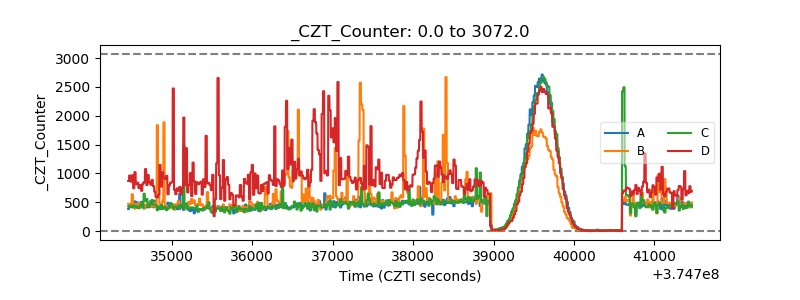 |
| +2.5 Volts monitor |  |
| +5 Volts monitor |  |
| _ROLL_ROT | 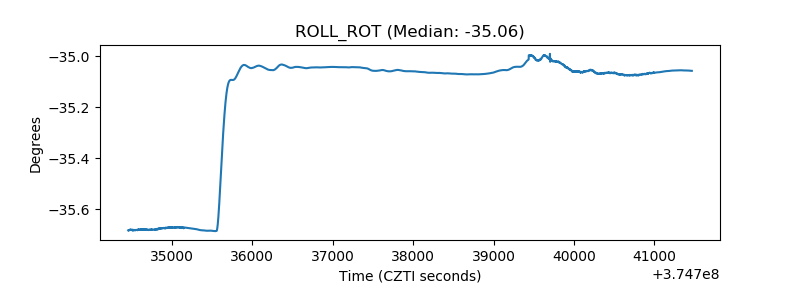 |
| _Roll_DEC | 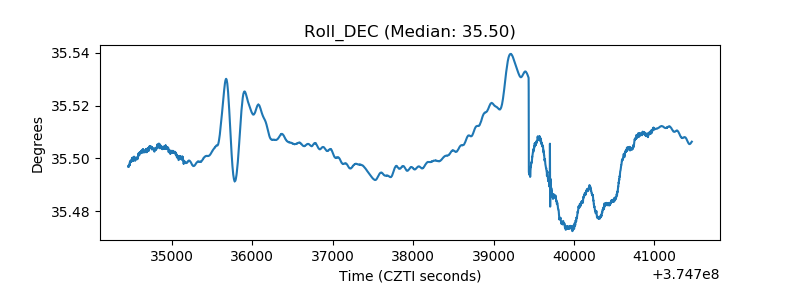 |
| _Roll_RA | 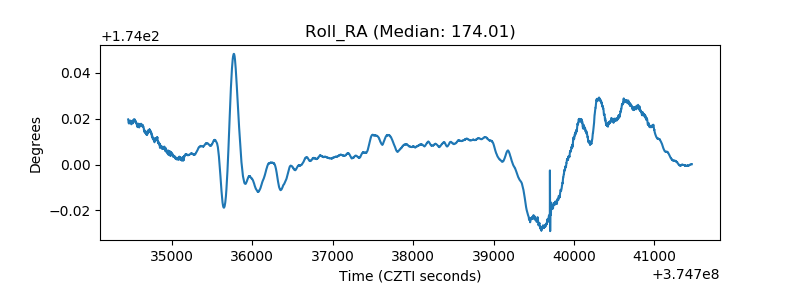 |
| Veto Counter | 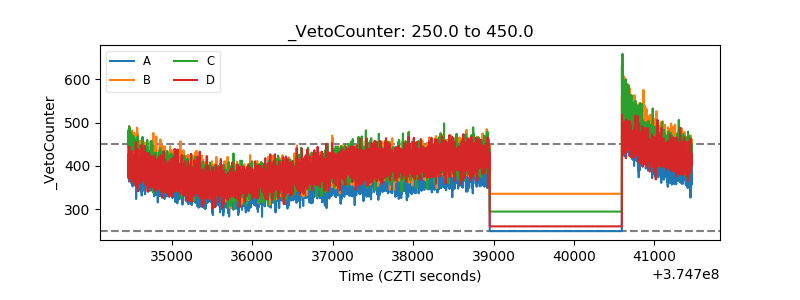 |