| Param | Original file | Final file |
|---|---|---|
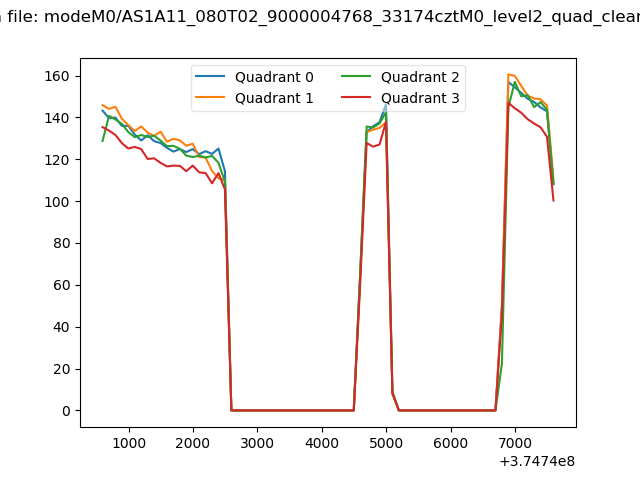
| Filename | modeM0/AS1A11_080T02_9000004768_33174cztM0_level2.evt | modeM0/AS1A11_080T02_9000004768_33174cztM0_level2_quad_clean.evt |
| Size (bytes) | 464,924,160 | 69,379,200 |
| Size | 443.4 MB | 66.2 MB |
| Events in quadrant A | 2,485,719 | 440,615 |
| Events in quadrant B | 3,585,711 | 443,488 |
| Events in quadrant C | 2,816,313 | 433,716 |
| Events in quadrant D | 4,832,221 | 410,933 |
| Mode M9 | |||
|---|---|---|---|
| Quadrant | BADHDUFLAG | Total packets | Discarded packets |
| A | 0 | 24 | 0 |
| B | 0 | 24 | 0 |
| C | 0 | 24 | 0 |
| D | 0 | 25 | 0 |
| Mode SS | |||
|---|---|---|---|
| Quadrant | BADHDUFLAG | Total packets | Discarded packets |
| A | 0 | 108 | 0 |
| B | 0 | 108 | 0 |
| C | 0 | 108 | 0 |
| D | 0 | 108 | 0 |
| Mode M0 | |||
|---|---|---|---|
| Quadrant | BADHDUFLAG | Total packets | Discarded packets |
| A | 0 | 10690 | 3 |
| B | 0 | 14040 | 2 |
| C | 0 | 11755 | 2 |
| D | 0 | 18417 | 2 |
| Quadrant | Total seconds | Saturated seconds | Saturation percentage |
|---|---|---|---|
| A | 5314 | 7 | 0.131728% |
| B | 5314 | 165 | 3.105006% |
| C | 5314 | 75 | 1.411366% |
| D | 5314 | 92 | 1.731276% |
Noise dominated data is calculated using 1-second bins in cleaned event files. If a bin has >2000 counts, and if more than 50% of those come from <1% of pixels, then it is considered to be noise-dominated and hence unusable.
| Quadrant | # 1 sec bins | Bins with >0 counts | Bins with >2000 counts | High rate bins dominated by noise | Noise dominated (total time) | Noise dominated (detector-on time) | Marked lightcurve |
|---|---|---|---|---|---|---|---|
| A | 7077 | 5315 | 0 | 0 | 0.00% | 0.00% | 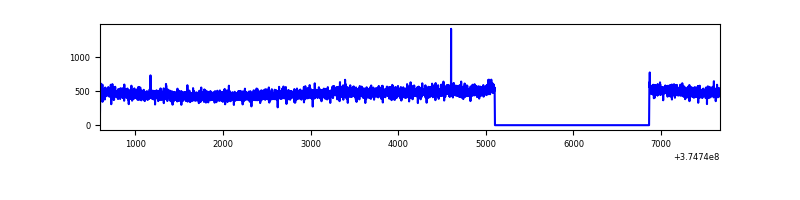 |
| B | 7077 | 5315 | 97 | 97 | 1.37% | 1.83% | 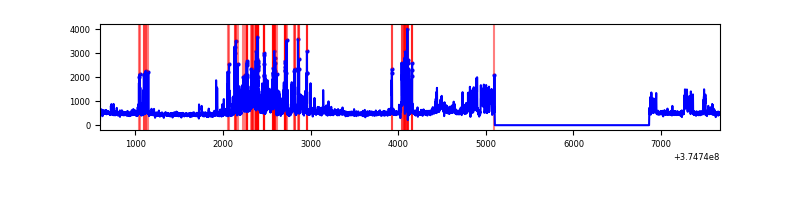 |
| C | 7077 | 5315 | 64 | 64 | 0.90% | 1.20% | 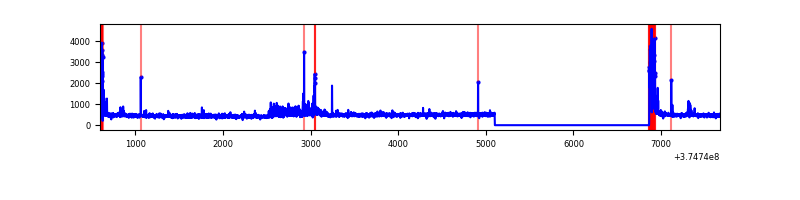 |
| D | 7077 | 5315 | 61 | 61 | 0.86% | 1.15% | 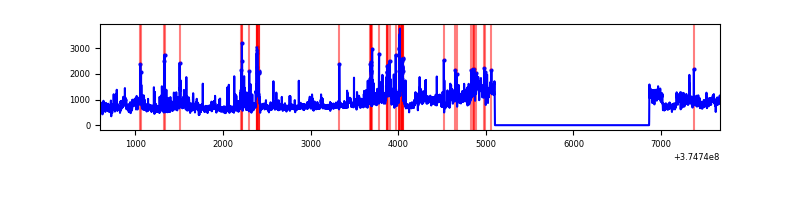 |
Top three noisy pixels from each quadrant. If the there are fewer than three noisy pixels in the level2.evt file, extra rows are filled as -1
| Pixel properties | Quadrant properties | ||||||
|---|---|---|---|---|---|---|---|
| Quadrant | DetID | PixID | Counts | Sigma | Mean | Median | Sigma |
| A | 13 | 254 | 9482 | 69.6 | 639 | 626 | 127.2 |
| A | 13 | 6 | 7723 | 55.77 | 639 | 626 | 127.2 |
| A | 3 | 137 | 5744 | 40.22 | 639 | 626 | 127.2 |
| B | 0 | 219 | 506146 | 4213.57 | 631 | 616 | 120.0 |
| B | 5 | 172 | 487700 | 4059.82 | 631 | 616 | 120.0 |
| B | 15 | 85 | 39183 | 321.45 | 631 | 616 | 120.0 |
| C | 0 | 10 | 235173 | 1665.94 | 614 | 619 | 140.8 |
| C | 9 | 187 | 112773 | 796.58 | 614 | 619 | 140.8 |
| C | 1 | 241 | 31714 | 220.85 | 614 | 619 | 140.8 |
| D | 10 | 203 | 977837 | 5934.38 | 614 | 599 | 164.7 |
| D | 8 | 195 | 917931 | 5570.6 | 614 | 599 | 164.7 |
| D | 2 | 250 | 159501 | 964.95 | 614 | 599 | 164.7 |
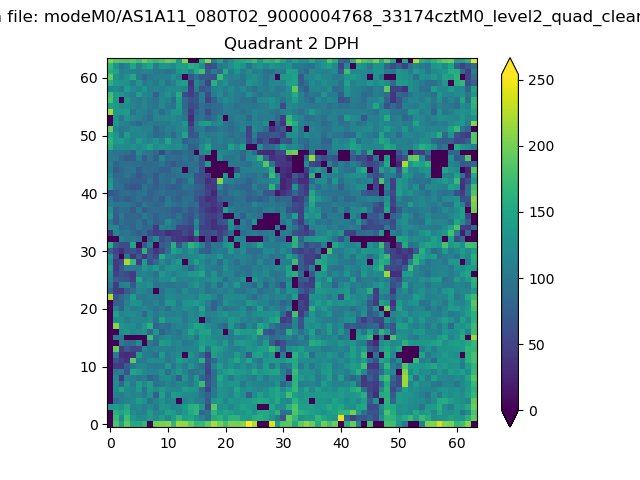
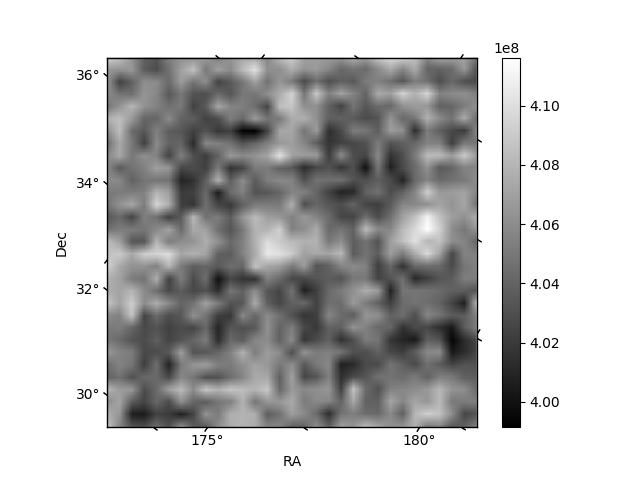
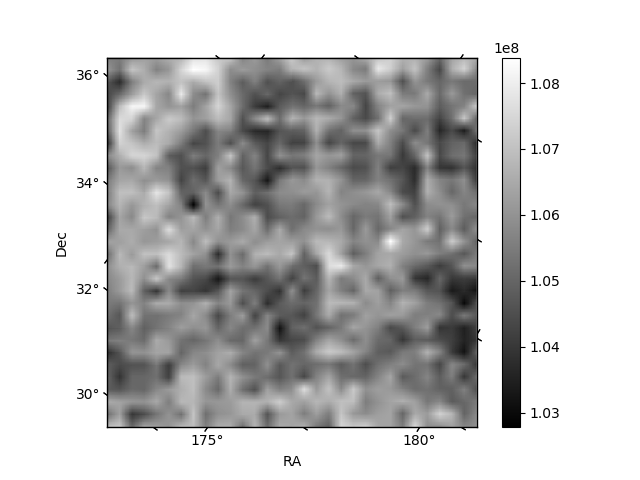
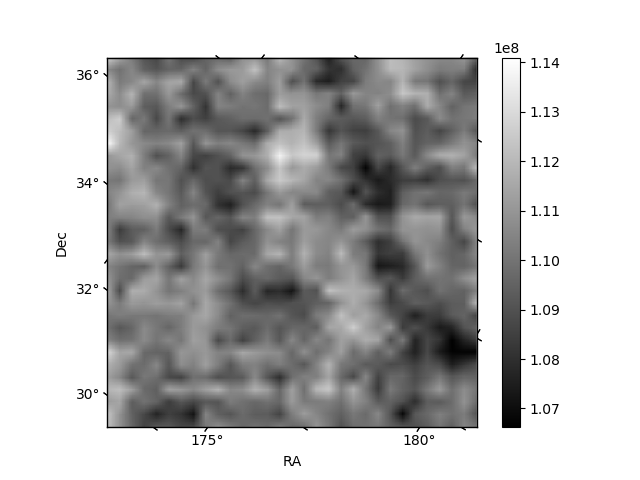
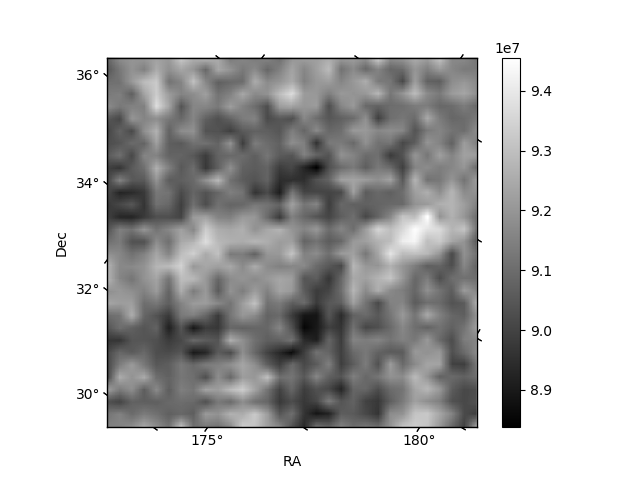
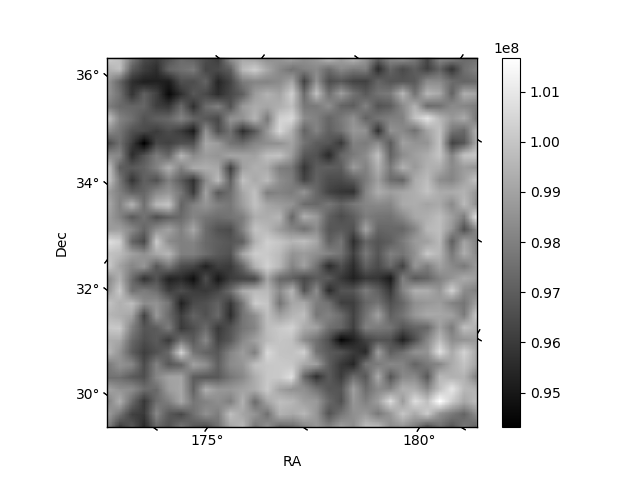
Histogram calculated using DETX and DETY for each event in the final _common_clean file
| Quadrant A | 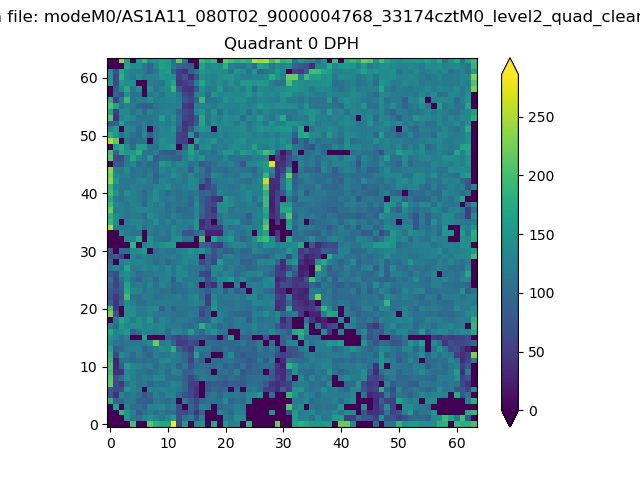 |
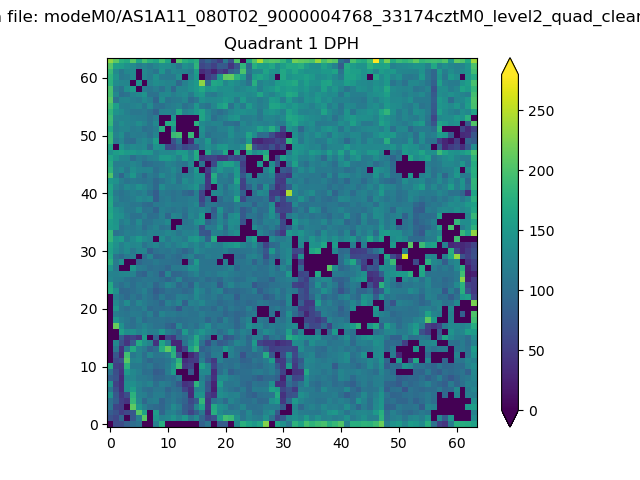 |
Quadrant B |
|---|---|---|---|
| Quadrant D | 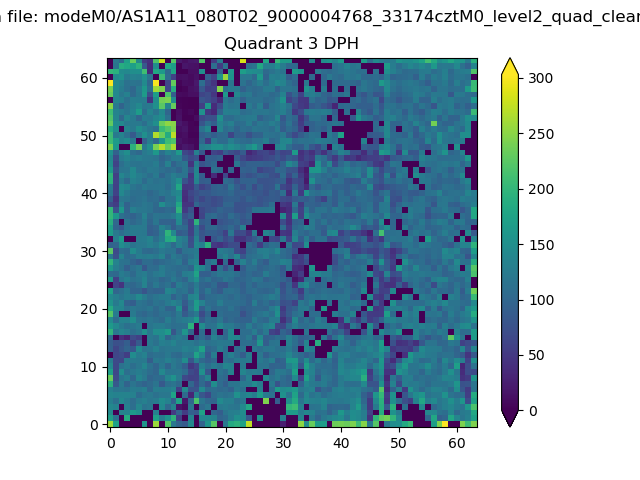 |
 |
Quadrant C |
| Plot type | Count rate plots | Images |
|---|---|---|
| Comparison with Poisson distribution Blue bars denote a histogram of data divided into 1 sec bins. Red curve is a Poisson curve with rate = median count rate of data. |
 |
 |
| Quadrant-wise count rates Data is divided into 100 sec bins |
 |
|
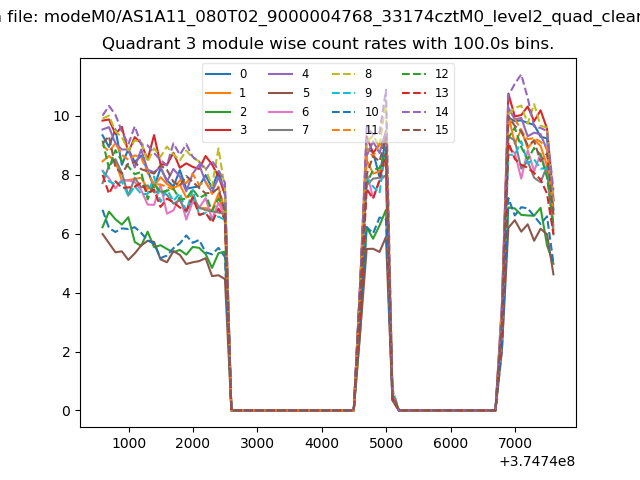
| Module-wise count rates for Quadrant A Data is divided into 100 sec bins |
 |
 |
| Module-wise count rates for Quadrant B Data is divided into 100 sec bins |
 |
 |
| Module-wise count rates for Quadrant C Data is divided into 100 sec bins |
 |
 |
| Module-wise count rates for Quadrant D Data is divided into 100 sec bins |
 |
 |
| Parameter | Plot |
|---|---|
| CZT HV Monitor |  |
| D_VDD | 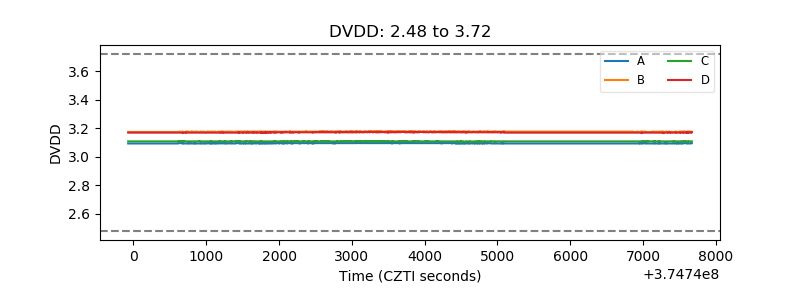 |
| Temperature 1 | 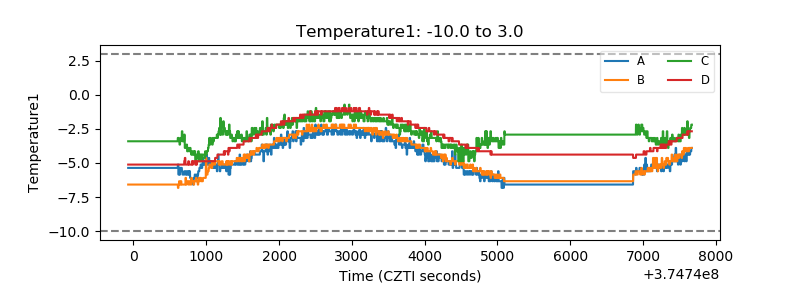 |
| Veto HV Monitor | 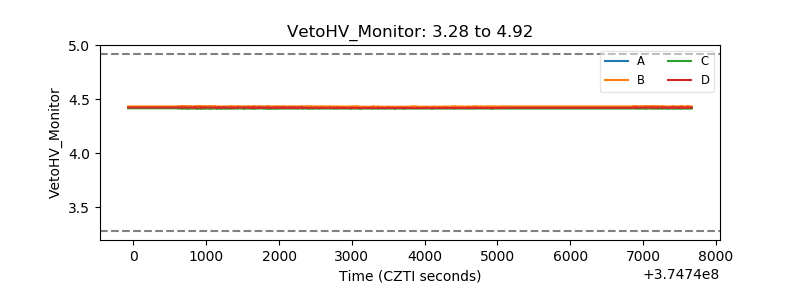 |
| Veto LLD | 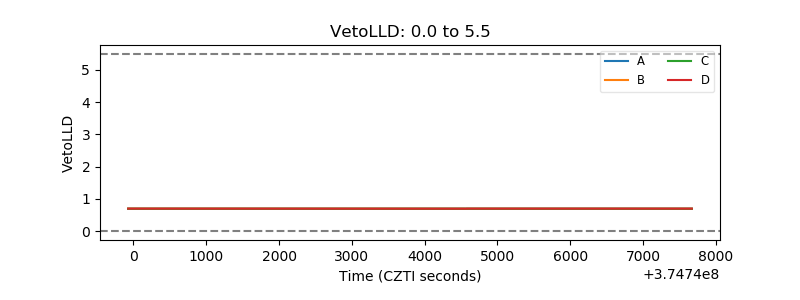 |
| Alpha Counter |  |
| _CPM_Rate | 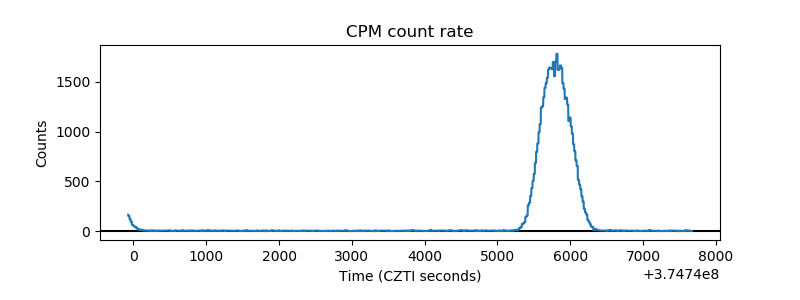 |
| CZT Counter | 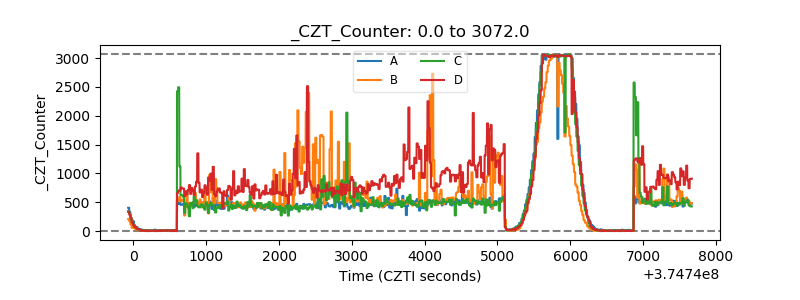 |
| +2.5 Volts monitor |  |
| +5 Volts monitor |  |
| _ROLL_ROT | 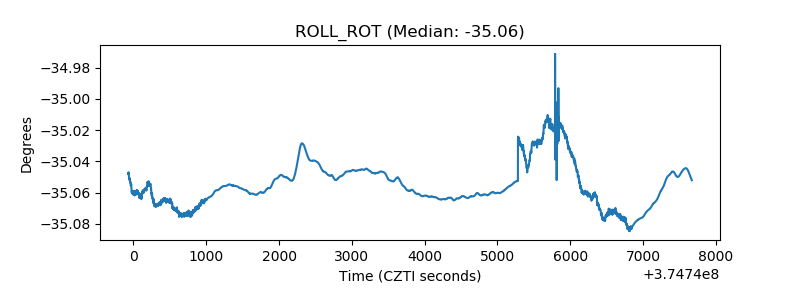 |
| _Roll_DEC | 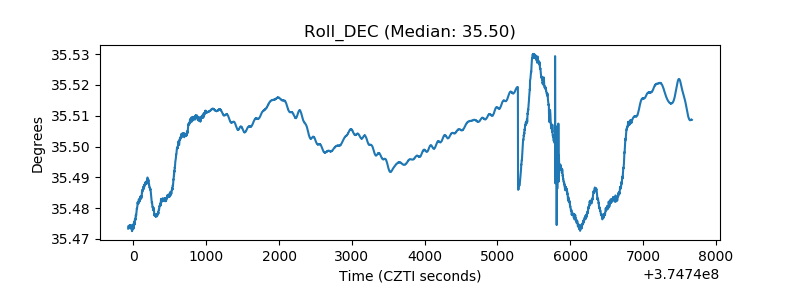 |
| _Roll_RA | 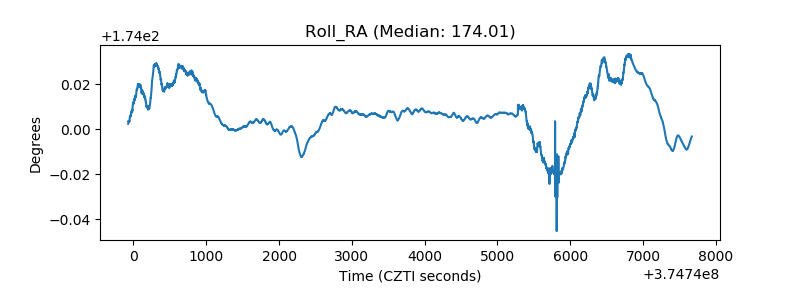 |
| Veto Counter | 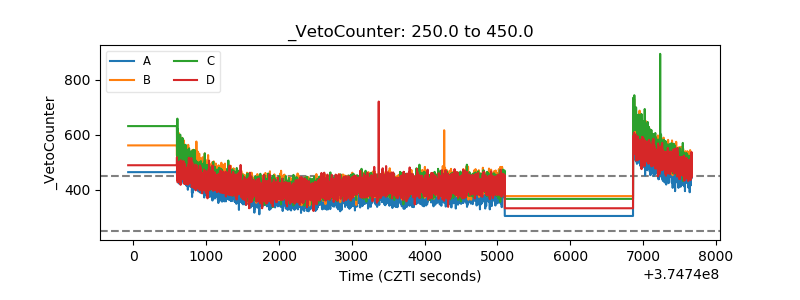 |