| Param | Original file | Final file |
|---|---|---|
| Filename | modeM0/AS1A11_080T02_9000004768_33175cztM0_level2.evt | modeM0/AS1A11_080T02_9000004768_33175cztM0_level2_quad_clean.evt |
| Size (bytes) | 486,581,760 | 70,338,240 |
| Size | 464.0 MB | 67.1 MB |
| Events in quadrant A | 2,671,830 | 453,590 |
| Events in quadrant B | 4,042,702 | 442,537 |
| Events in quadrant C | 2,930,577 | 448,079 |
| Events in quadrant D | 4,741,793 | 424,248 |
| Mode M9 | |||
|---|---|---|---|
| Quadrant | BADHDUFLAG | Total packets | Discarded packets |
| A | 0 | 23 | 0 |
| B | 0 | 23 | 0 |
| C | 0 | 23 | 0 |
| D | 0 | 24 | 0 |
| Mode SS | |||
|---|---|---|---|
| Quadrant | BADHDUFLAG | Total packets | Discarded packets |
| A | 0 | 104 | 0 |
| B | 0 | 104 | 0 |
| C | 0 | 104 | 0 |
| D | 0 | 104 | 0 |
| Mode M0 | |||
|---|---|---|---|
| Quadrant | BADHDUFLAG | Total packets | Discarded packets |
| A | 0 | 10937 | 3 |
| B | 0 | 15275 | 2 |
| C | 0 | 11764 | 2 |
| D | 0 | 17920 | 2 |
| Quadrant | Total seconds | Saturated seconds | Saturation percentage |
|---|---|---|---|
| A | 5159 | 40 | 0.775344% |
| B | 5159 | 311 | 6.028300% |
| C | 5159 | 111 | 2.151580% |
| D | 5159 | 263 | 5.097887% |
Noise dominated data is calculated using 1-second bins in cleaned event files. If a bin has >2000 counts, and if more than 50% of those come from <1% of pixels, then it is considered to be noise-dominated and hence unusable.
| Quadrant | # 1 sec bins | Bins with >0 counts | Bins with >2000 counts | High rate bins dominated by noise | Noise dominated (total time) | Noise dominated (detector-on time) | Marked lightcurve |
|---|---|---|---|---|---|---|---|
| A | 7071 | 5160 | 24 | 24 | 0.34% | 0.47% | 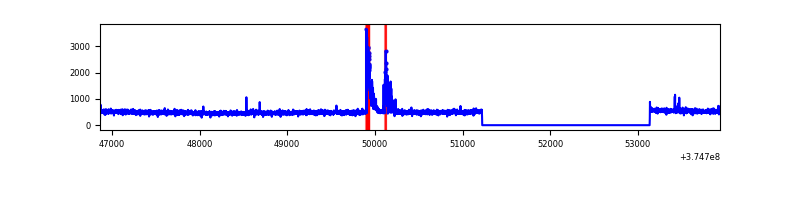 |
| B | 7071 | 5160 | 201 | 201 | 2.84% | 3.90% | 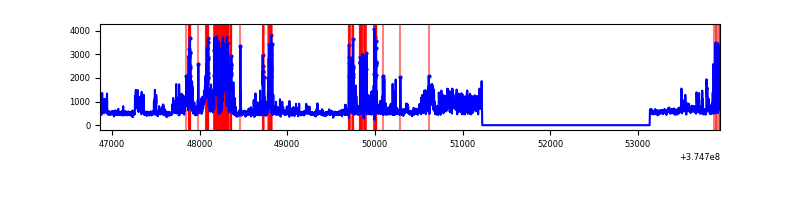 |
| C | 7071 | 5160 | 79 | 79 | 1.12% | 1.53% | 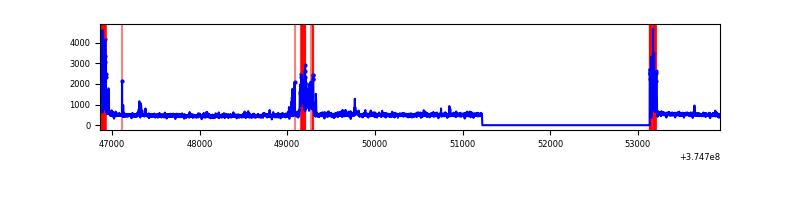 |
| D | 7071 | 5160 | 215 | 215 | 3.04% | 4.17% | 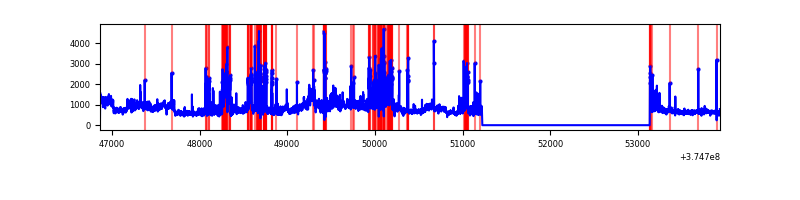 |
Top three noisy pixels from each quadrant. If the there are fewer than three noisy pixels in the level2.evt file, extra rows are filled as -1
| Pixel properties | Quadrant properties | ||||||
|---|---|---|---|---|---|---|---|
| Quadrant | DetID | PixID | Counts | Sigma | Mean | Median | Sigma |
| A | 14 | 234 | 154966 | 1198.33 | 648 | 637 | 128.8 |
| A | 13 | 254 | 9977 | 72.52 | 648 | 637 | 128.8 |
| A | 13 | 6 | 6983 | 49.28 | 648 | 637 | 128.8 |
| B | 5 | 172 | 745815 | 6398.28 | 625 | 609 | 116.5 |
| B | 0 | 219 | 675143 | 5791.49 | 625 | 609 | 116.5 |
| B | 0 | 190 | 69748 | 593.62 | 625 | 609 | 116.5 |
| C | 0 | 10 | 231253 | 1611.49 | 623 | 629 | 143.1 |
| C | 9 | 187 | 210217 | 1464.5 | 623 | 629 | 143.1 |
| C | 14 | 67 | 32781 | 224.66 | 623 | 629 | 143.1 |
| D | 8 | 195 | 762546 | 4643.97 | 621 | 606 | 164.1 |
| D | 10 | 203 | 452537 | 2754.49 | 621 | 606 | 164.1 |
| D | 7 | 223 | 398201 | 2423.31 | 621 | 606 | 164.1 |
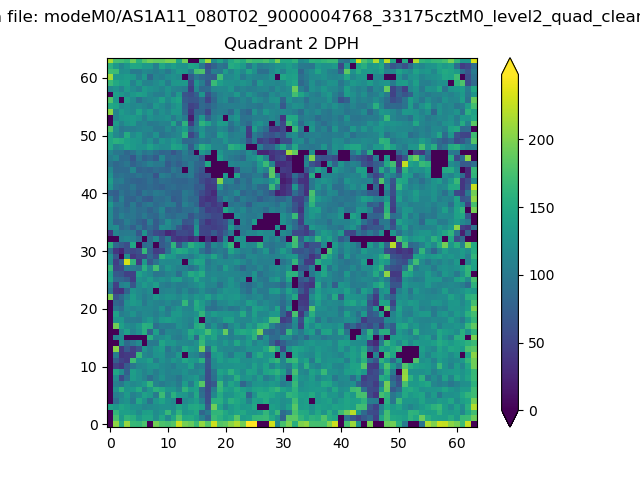
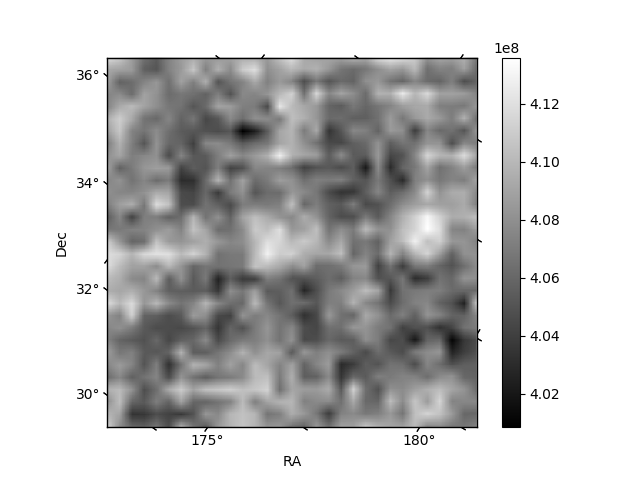
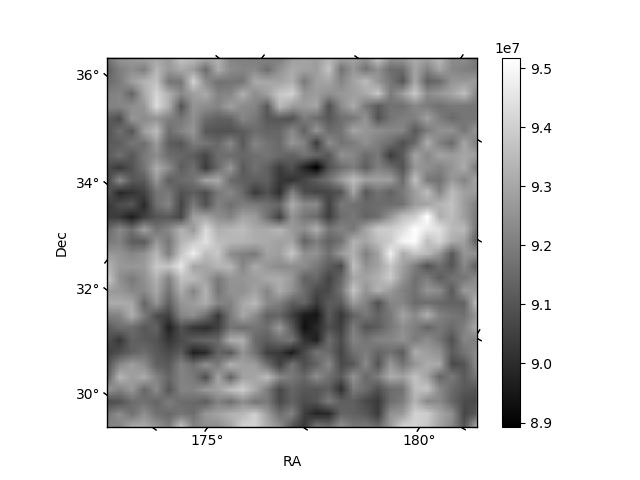
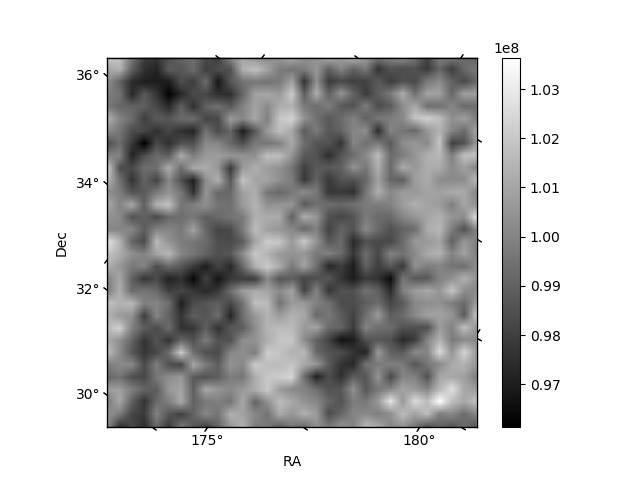
Histogram calculated using DETX and DETY for each event in the final _common_clean file
| Quadrant A | 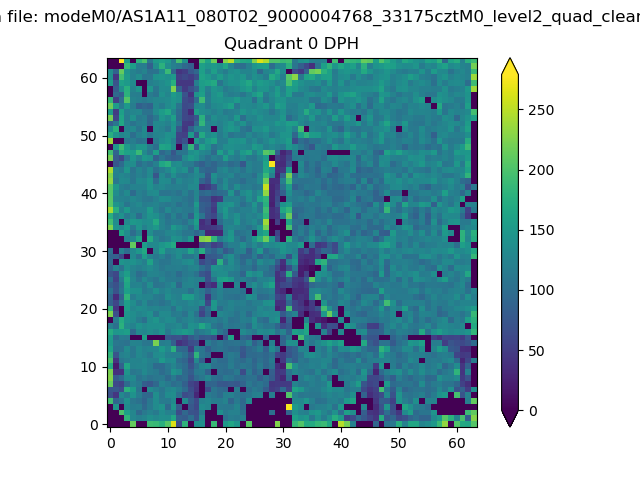 |
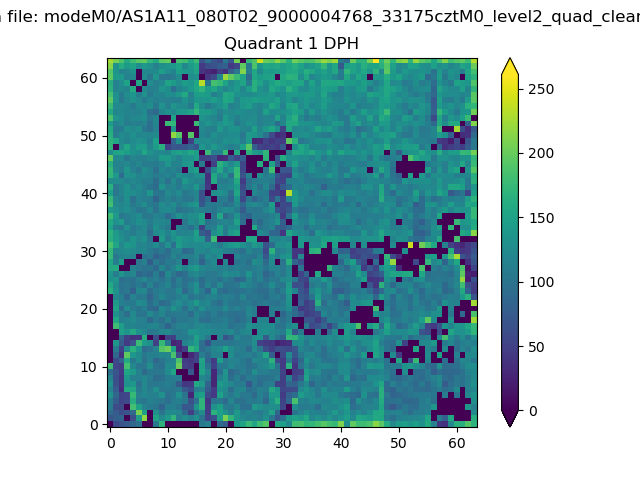 |
Quadrant B |
|---|---|---|---|
| Quadrant D | 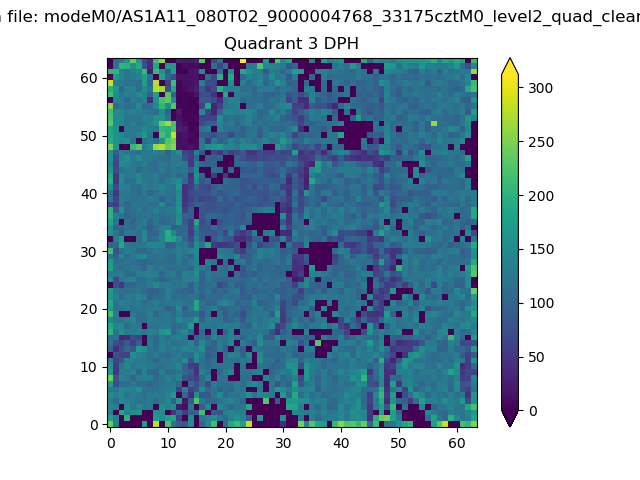 |
 |
Quadrant C |
| Plot type | Count rate plots | Images |
|---|---|---|
| Comparison with Poisson distribution Blue bars denote a histogram of data divided into 1 sec bins. Red curve is a Poisson curve with rate = median count rate of data. |
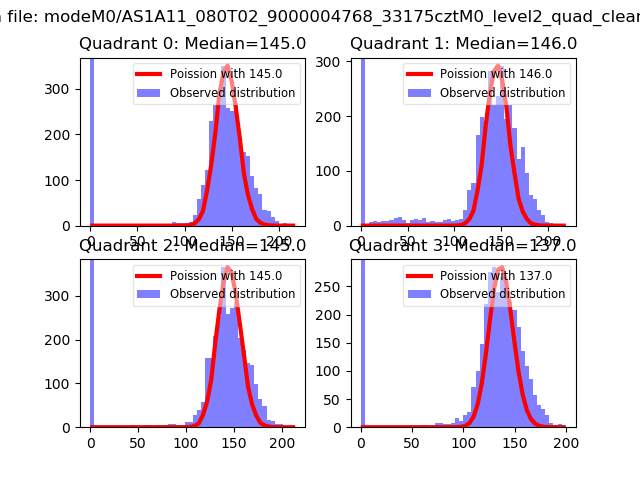 |
 |
| Quadrant-wise count rates Data is divided into 100 sec bins |
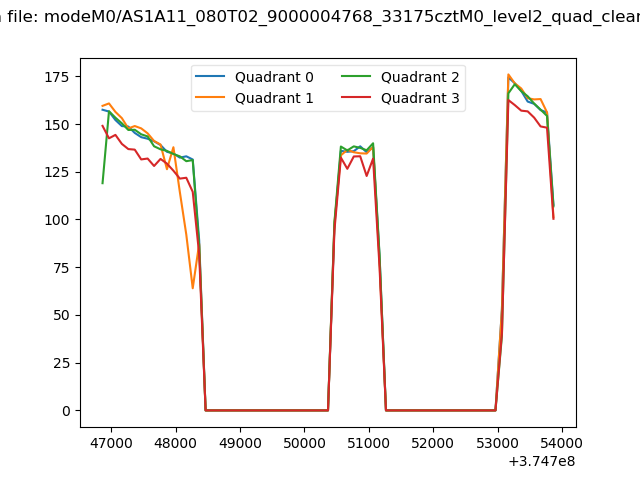 |
|
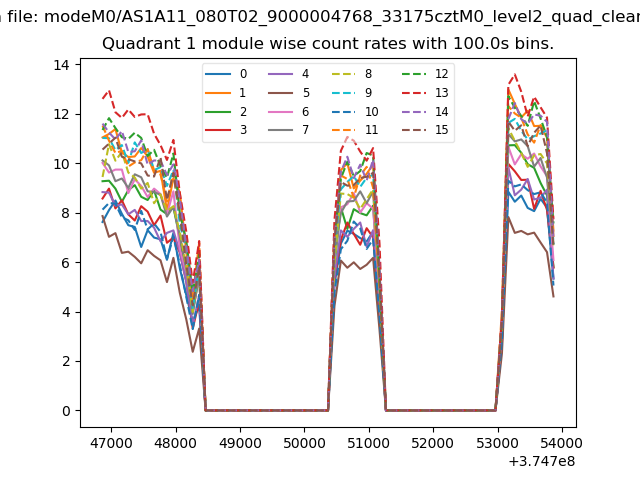
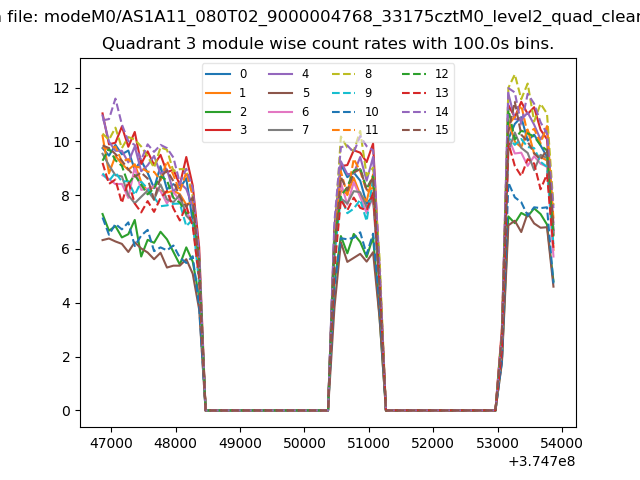
| Module-wise count rates for Quadrant A Data is divided into 100 sec bins |
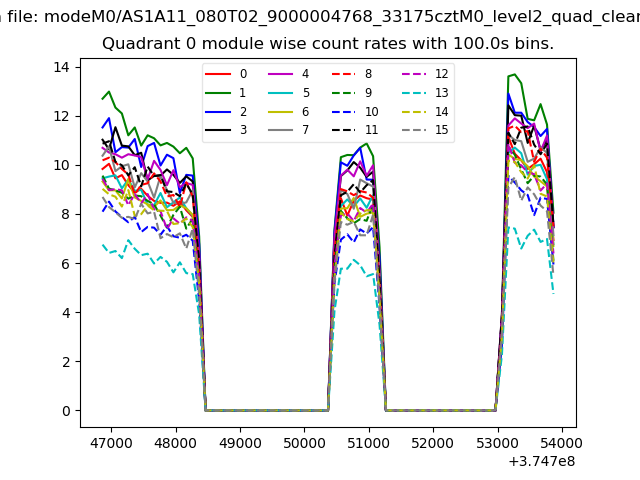 |
 |
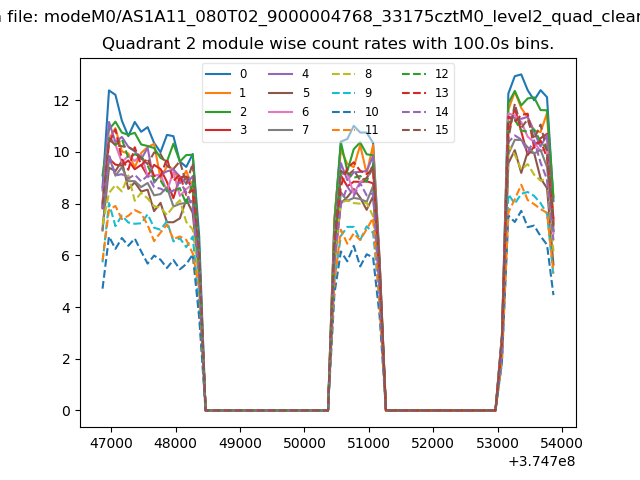
| Module-wise count rates for Quadrant B Data is divided into 100 sec bins |
 |
 |
| Module-wise count rates for Quadrant C Data is divided into 100 sec bins |
 |
 |
| Module-wise count rates for Quadrant D Data is divided into 100 sec bins |
 |
 |
| Parameter | Plot |
|---|---|
| CZT HV Monitor | 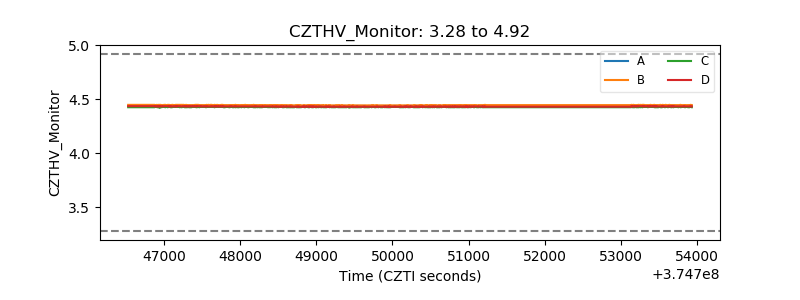 |
| D_VDD | 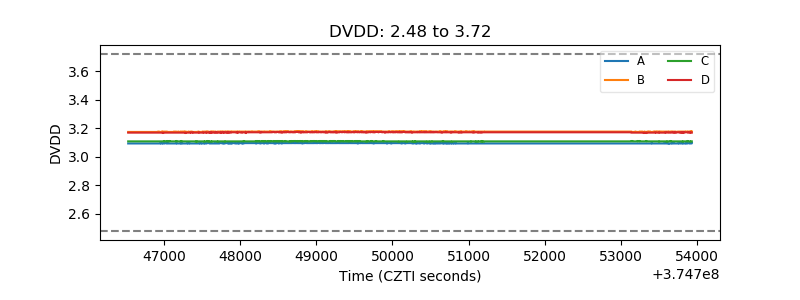 |
| Temperature 1 | 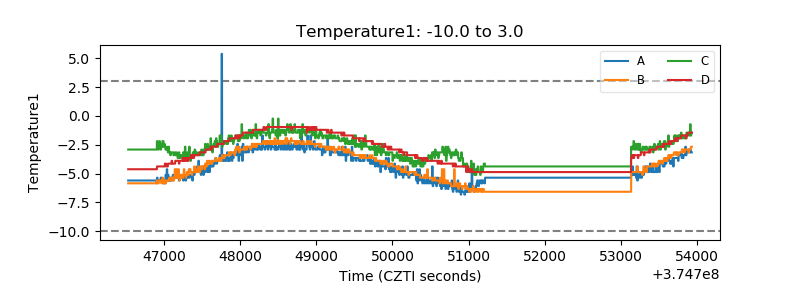 |
| Veto HV Monitor | 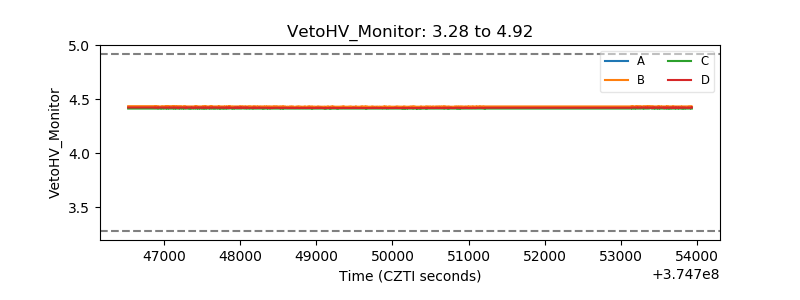 |
| Veto LLD | 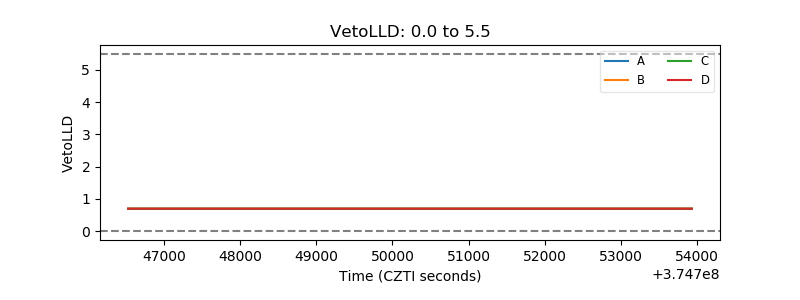 |
| Alpha Counter | 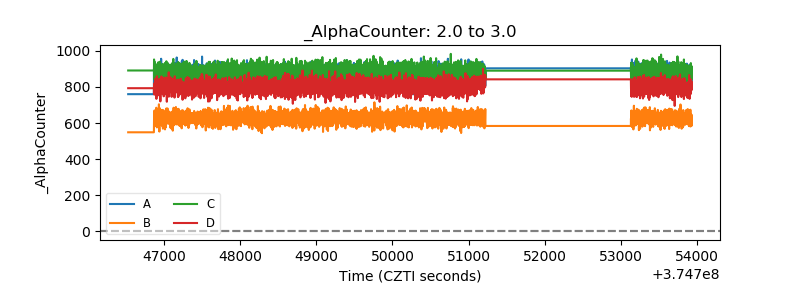 |
| _CPM_Rate | 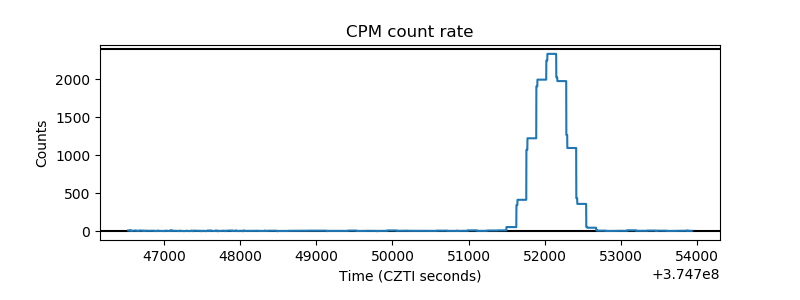 |
| CZT Counter | 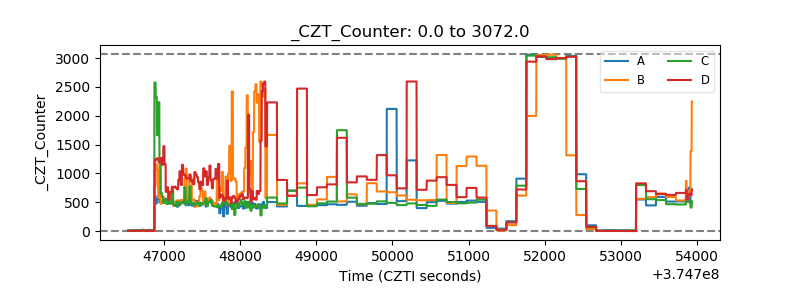 |
| +2.5 Volts monitor | 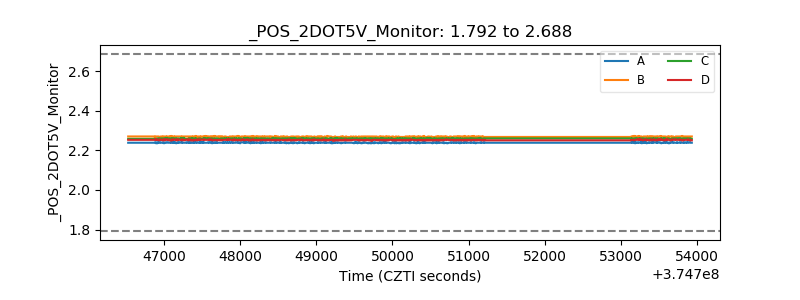 |
| +5 Volts monitor |  |
| _ROLL_ROT | 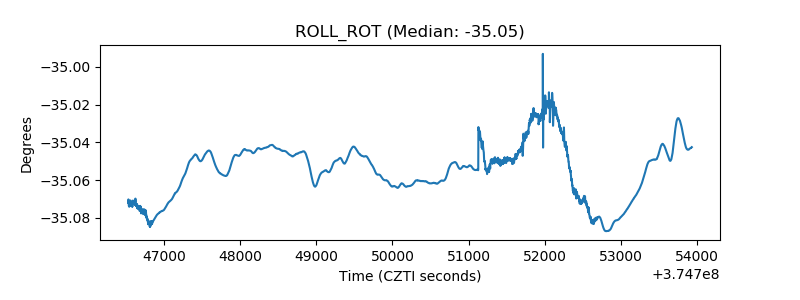 |
| _Roll_DEC | 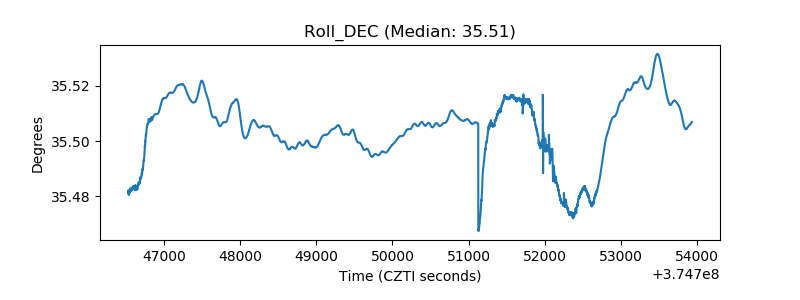 |
| _Roll_RA | 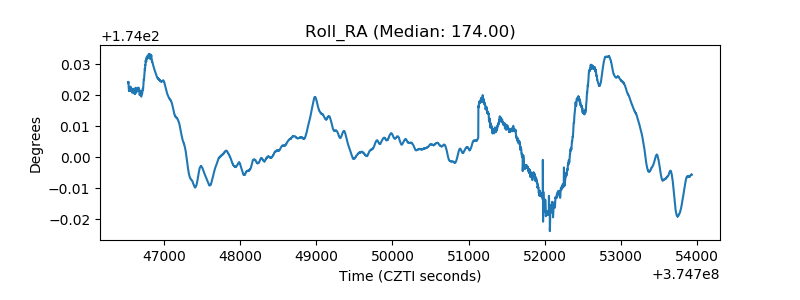 |
| Veto Counter | 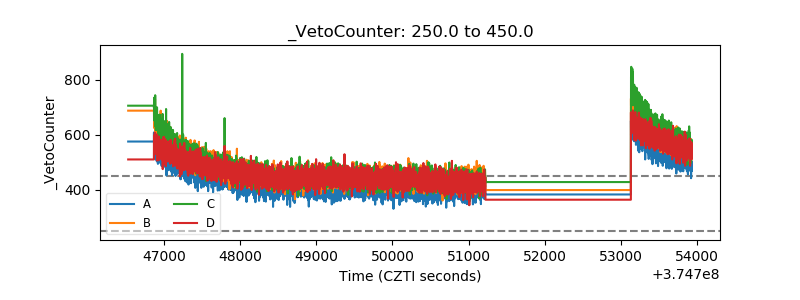 |