| Param | Original file | Final file |
|---|---|---|
| Filename | modeM0/AS1A11_080T02_9000004768_33177cztM0_level2.evt | modeM0/AS1A11_080T02_9000004768_33177cztM0_level2_quad_clean.evt |
| Size (bytes) | 467,311,680 | 59,379,840 |
| Size | 445.7 MB | 56.6 MB |
| Events in quadrant A | 2,544,250 | 371,202 |
| Events in quadrant B | 3,563,466 | 367,944 |
| Events in quadrant C | 2,727,701 | 367,426 |
| Events in quadrant D | 4,985,618 | 347,817 |
| Mode M9 | |||
|---|---|---|---|
| Quadrant | BADHDUFLAG | Total packets | Discarded packets |
| A | 0 | 22 | 0 |
| B | 0 | 22 | 0 |
| C | 0 | 22 | 0 |
| D | 0 | 23 | 0 |
| Mode SS | |||
|---|---|---|---|
| Quadrant | BADHDUFLAG | Total packets | Discarded packets |
| A | 0 | 100 | 0 |
| B | 0 | 100 | 0 |
| C | 0 | 100 | 0 |
| D | 0 | 100 | 0 |
| Mode M0 | |||
|---|---|---|---|
| Quadrant | BADHDUFLAG | Total packets | Discarded packets |
| A | 0 | 10210 | 3 |
| B | 0 | 13744 | 2 |
| C | 0 | 10764 | 2 |
| D | 0 | 18439 | 2 |
| Quadrant | Total seconds | Saturated seconds | Saturation percentage |
|---|---|---|---|
| A | 4892 | 7 | 0.143091% |
| B | 4892 | 200 | 4.088307% |
| C | 4892 | 66 | 1.349141% |
| D | 4892 | 321 | 6.561733% |
Noise dominated data is calculated using 1-second bins in cleaned event files. If a bin has >2000 counts, and if more than 50% of those come from <1% of pixels, then it is considered to be noise-dominated and hence unusable.
| Quadrant | # 1 sec bins | Bins with >0 counts | Bins with >2000 counts | High rate bins dominated by noise | Noise dominated (total time) | Noise dominated (detector-on time) | Marked lightcurve |
|---|---|---|---|---|---|---|---|
| A | 7014 | 4893 | 0 | 0 | 0.00% | 0.00% | 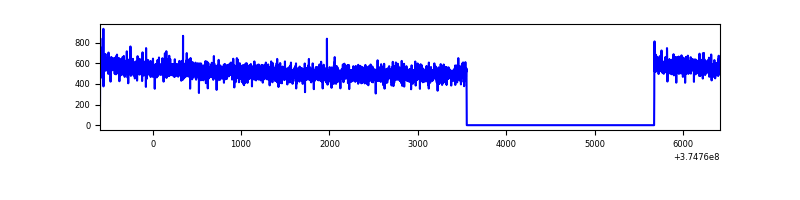 |
| B | 7014 | 4893 | 122 | 122 | 1.74% | 2.49% | 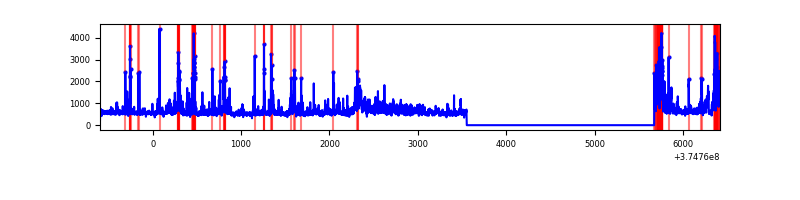 |
| C | 7014 | 4893 | 52 | 52 | 0.74% | 1.06% | 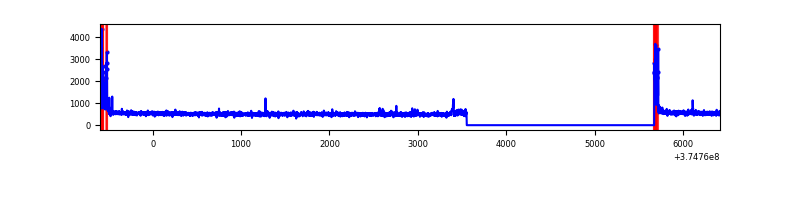 |
| D | 7014 | 4893 | 294 | 294 | 4.19% | 6.01% | 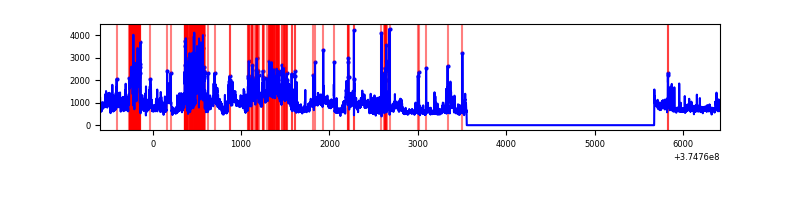 |
Top three noisy pixels from each quadrant. If the there are fewer than three noisy pixels in the level2.evt file, extra rows are filled as -1
| Pixel properties | Quadrant properties | ||||||
|---|---|---|---|---|---|---|---|
| Quadrant | DetID | PixID | Counts | Sigma | Mean | Median | Sigma |
| A | 13 | 6 | 12425 | 90.61 | 655 | 643 | 130.0 |
| A | 13 | 254 | 8758 | 62.41 | 655 | 643 | 130.0 |
| A | 0 | 226 | 5606 | 38.17 | 655 | 643 | 130.0 |
| B | 5 | 172 | 559896 | 4657.54 | 637 | 623 | 120.1 |
| B | 0 | 219 | 322944 | 2684.24 | 637 | 623 | 120.1 |
| B | 0 | 190 | 47415 | 389.68 | 637 | 623 | 120.1 |
| C | 0 | 10 | 195940 | 1351.15 | 634 | 641 | 144.5 |
| C | 14 | 67 | 24846 | 167.46 | 634 | 641 | 144.5 |
| C | 9 | 187 | 10005 | 64.78 | 634 | 641 | 144.5 |
| D | 12 | 218 | 1023393 | 6440.84 | 623 | 609 | 158.8 |
| D | 8 | 195 | 880946 | 5543.8 | 623 | 609 | 158.8 |
| D | 10 | 203 | 199512 | 1252.56 | 623 | 609 | 158.8 |
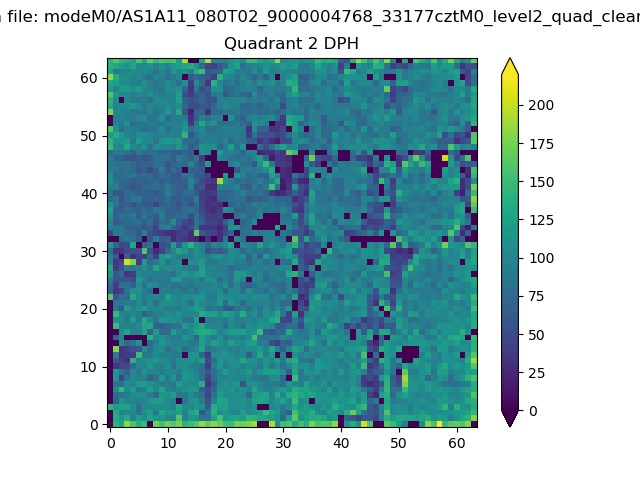
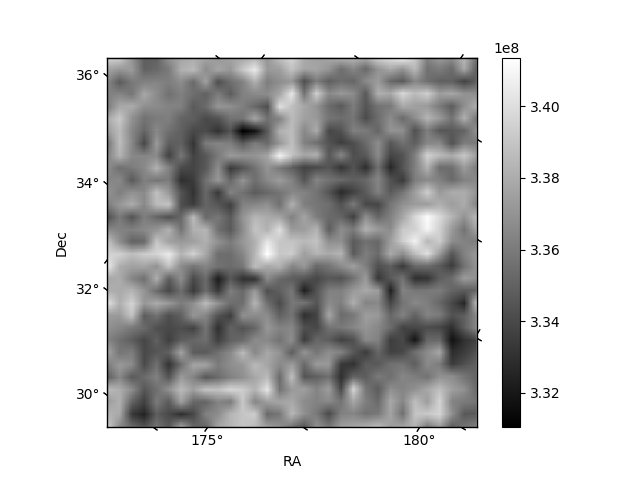
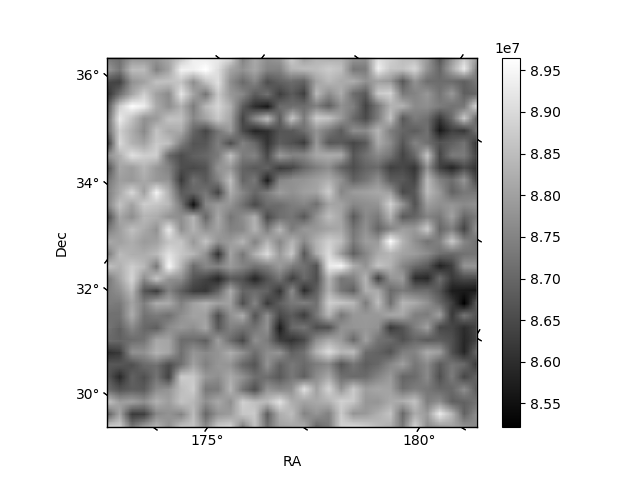
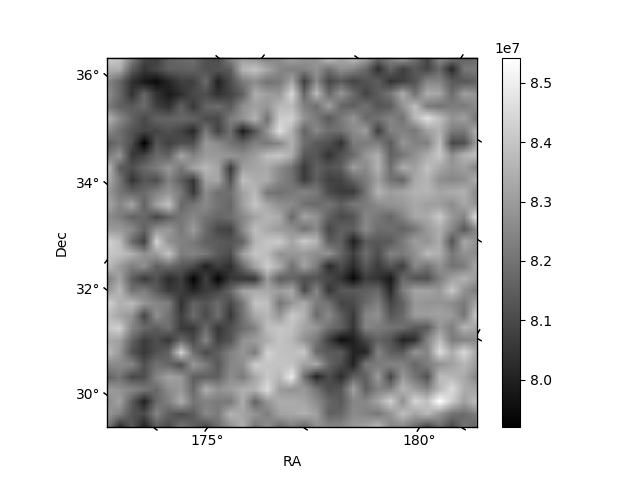
Histogram calculated using DETX and DETY for each event in the final _common_clean file
| Quadrant A | 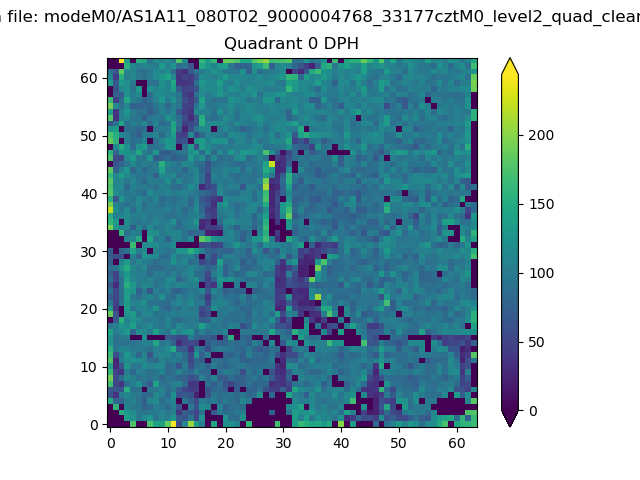 |
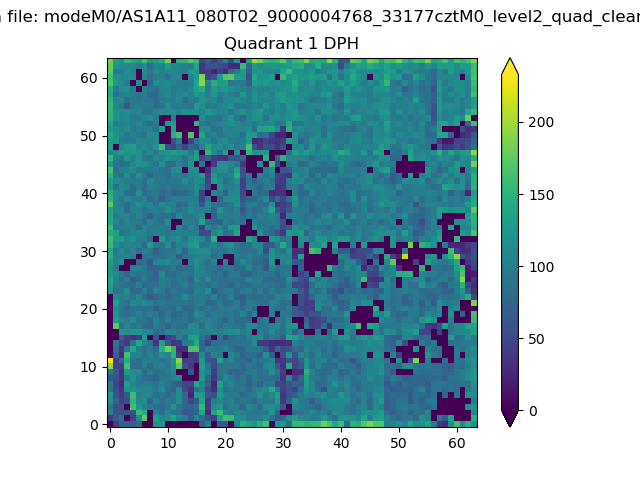 |
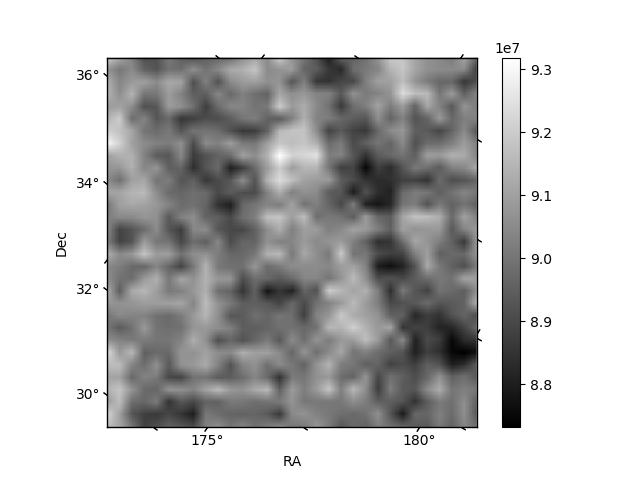
Quadrant B |
|---|---|---|---|
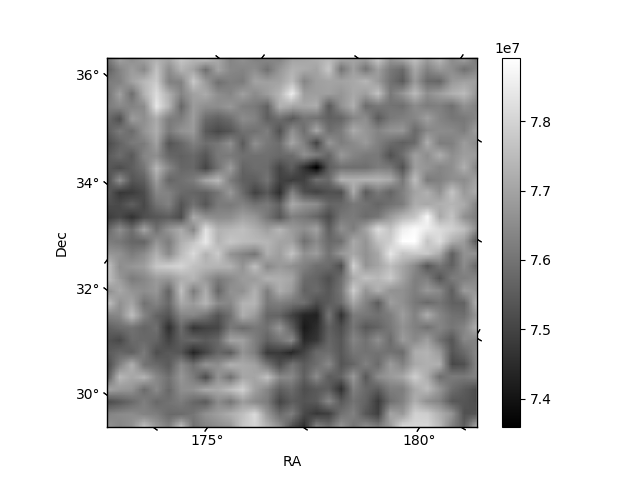
| Quadrant D | 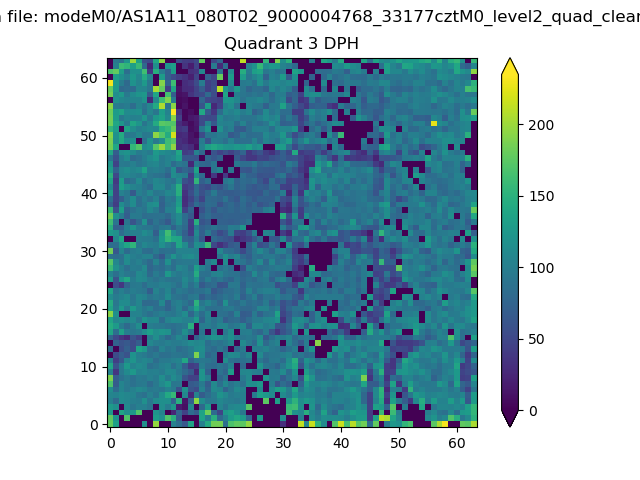 |
 |
Quadrant C |
| Plot type | Count rate plots | Images |
|---|---|---|
| Comparison with Poisson distribution Blue bars denote a histogram of data divided into 1 sec bins. Red curve is a Poisson curve with rate = median count rate of data. |
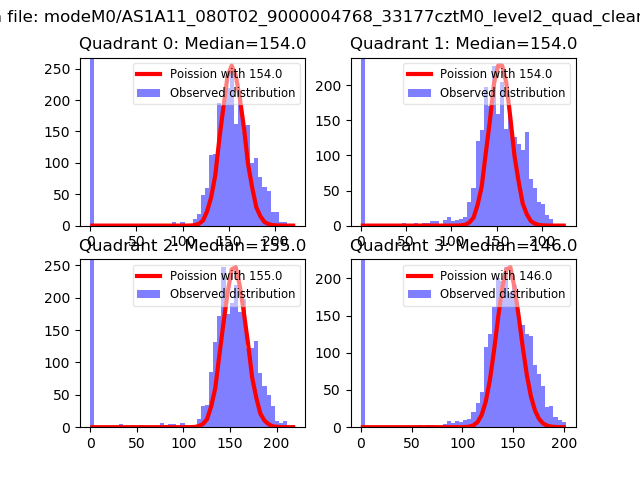 |
 |
| Quadrant-wise count rates Data is divided into 100 sec bins |
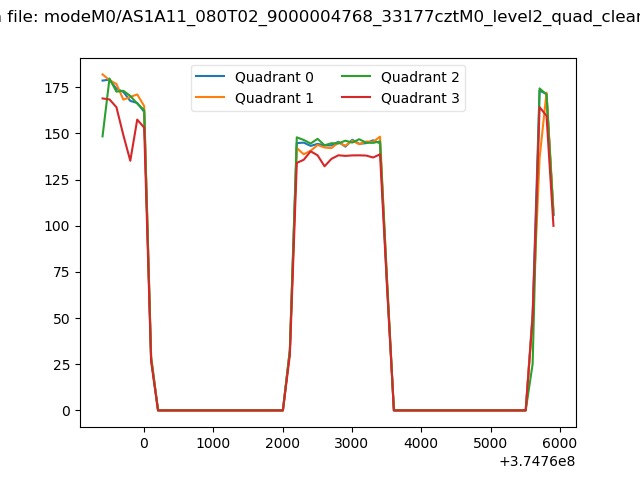 |
|
| Module-wise count rates for Quadrant A Data is divided into 100 sec bins |
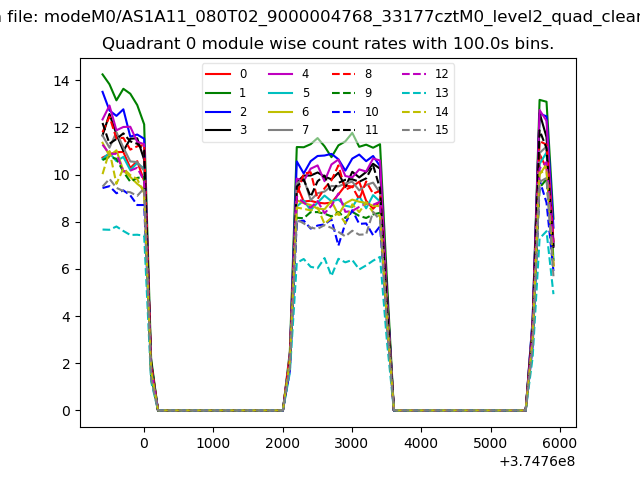 |
 |
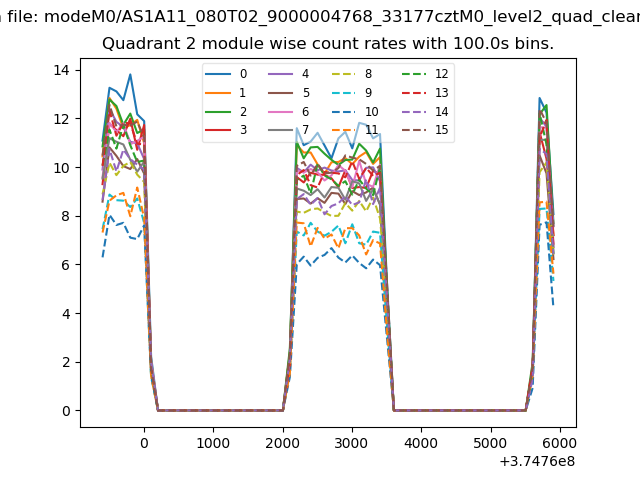
| Module-wise count rates for Quadrant B Data is divided into 100 sec bins |
 |
 |
| Module-wise count rates for Quadrant C Data is divided into 100 sec bins |
 |
 |
| Module-wise count rates for Quadrant D Data is divided into 100 sec bins |
 |
 |
| Parameter | Plot |
|---|---|
| CZT HV Monitor |  |
| D_VDD | 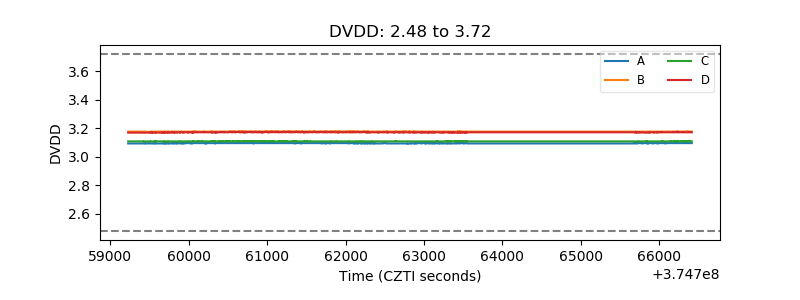 |
| Temperature 1 | 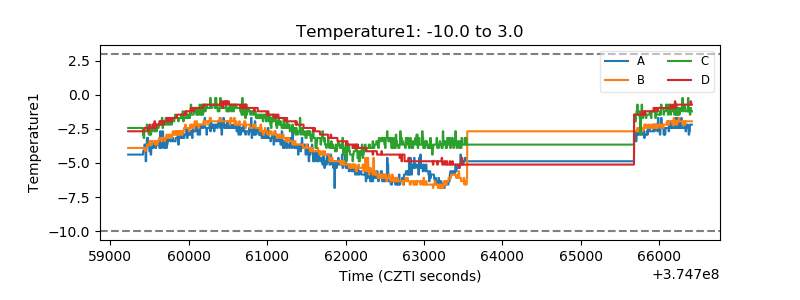 |
| Veto HV Monitor | 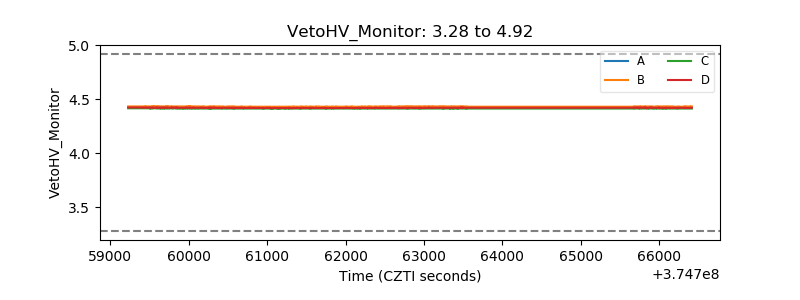 |
| Veto LLD | 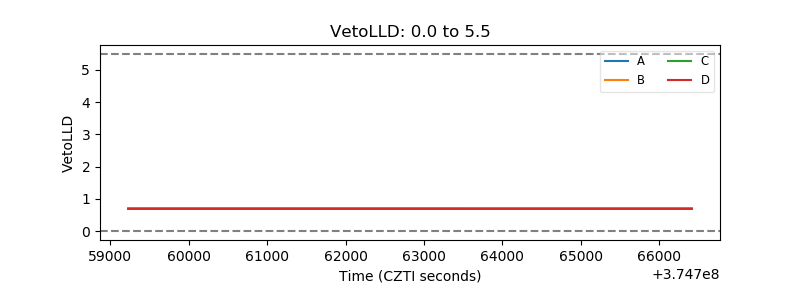 |
| Alpha Counter | 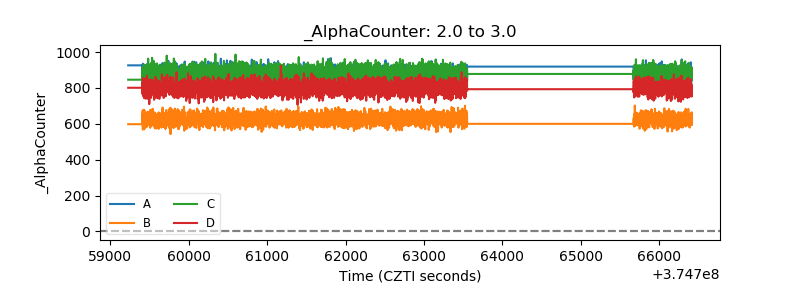 |
| _CPM_Rate | 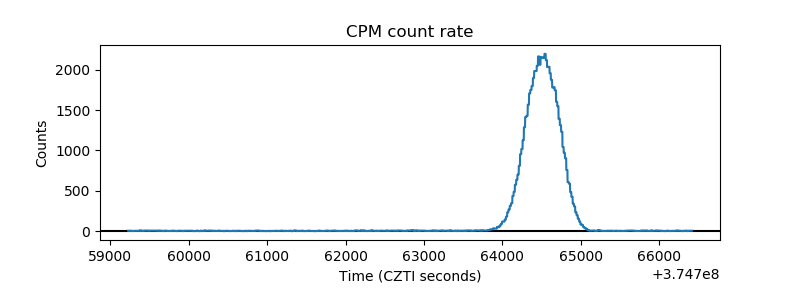 |
| CZT Counter | 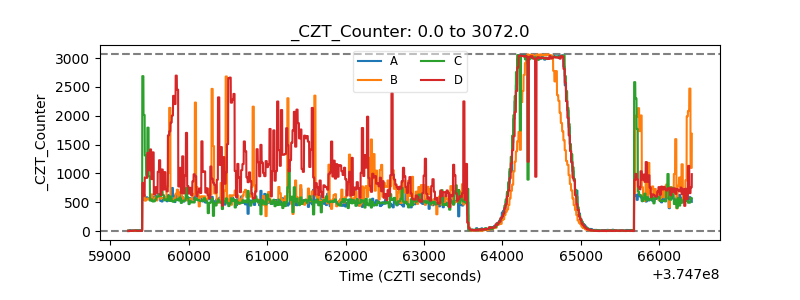 |
| +2.5 Volts monitor |  |
| +5 Volts monitor |  |
| _ROLL_ROT |  |
| _Roll_DEC | 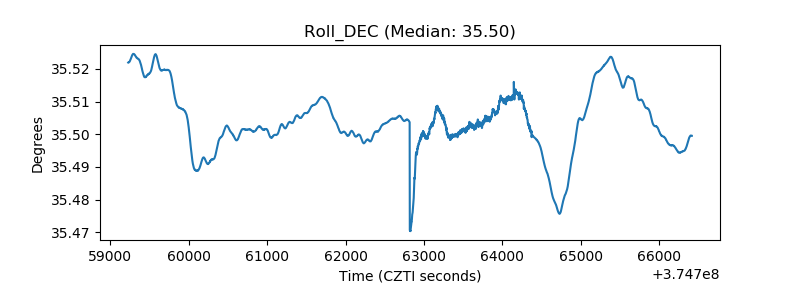 |
| _Roll_RA | 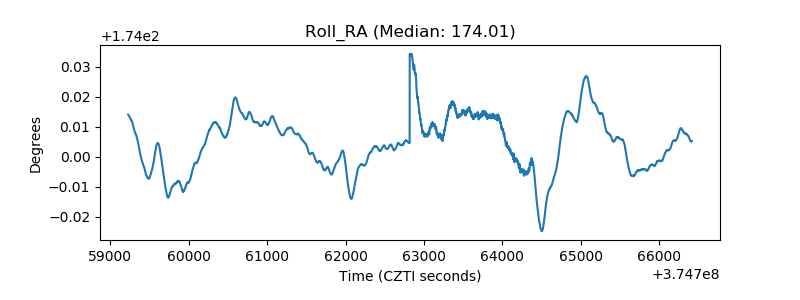 |
| Veto Counter | 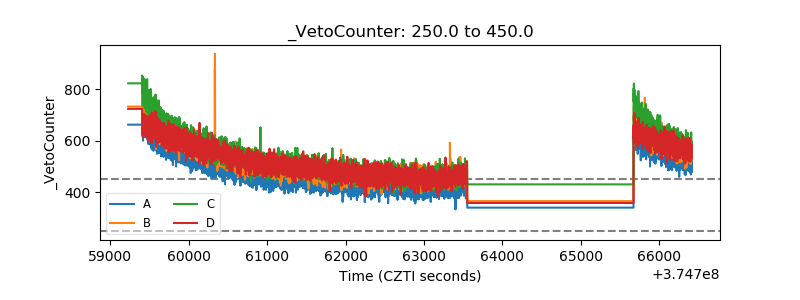 |