| Param | Original file | Final file |
|---|---|---|
| Filename | modeM0/AS1A11_080T02_9000004768_33178cztM0_level2.evt | modeM0/AS1A11_080T02_9000004768_33178cztM0_level2_quad_clean.evt |
| Size (bytes) | 511,758,720 | 51,261,120 |
| Size | 488.1 MB | 48.9 MB |
| Events in quadrant A | 2,650,680 | 302,977 |
| Events in quadrant B | 4,162,230 | 297,627 |
| Events in quadrant C | 2,868,815 | 302,000 |
| Events in quadrant D | 5,465,407 | 285,556 |
| Mode M9 | |||
|---|---|---|---|
| Quadrant | BADHDUFLAG | Total packets | Discarded packets |
| A | 0 | 29 | 0 |
| B | 0 | 29 | 0 |
| C | 0 | 29 | 0 |
| D | 0 | 30 | 0 |
| Mode SS | |||
|---|---|---|---|
| Quadrant | BADHDUFLAG | Total packets | Discarded packets |
| A | 0 | 104 | 0 |
| B | 0 | 104 | 0 |
| C | 0 | 104 | 0 |
| D | 0 | 104 | 0 |
| Mode M0 | |||
|---|---|---|---|
| Quadrant | BADHDUFLAG | Total packets | Discarded packets |
| A | 0 | 10744 | 3 |
| B | 0 | 15691 | 2 |
| C | 0 | 11392 | 2 |
| D | 0 | 19984 | 2 |
| Quadrant | Total seconds | Saturated seconds | Saturation percentage |
|---|---|---|---|
| A | 5196 | 7 | 0.134719% |
| B | 5196 | 530 | 10.200154% |
| C | 5196 | 72 | 1.385681% |
| D | 5196 | 427 | 8.217860% |
Noise dominated data is calculated using 1-second bins in cleaned event files. If a bin has >2000 counts, and if more than 50% of those come from <1% of pixels, then it is considered to be noise-dominated and hence unusable.
| Quadrant | # 1 sec bins | Bins with >0 counts | Bins with >2000 counts | High rate bins dominated by noise | Noise dominated (total time) | Noise dominated (detector-on time) | Marked lightcurve |
|---|---|---|---|---|---|---|---|
| A | 7350 | 5197 | 0 | 0 | 0.00% | 0.00% | 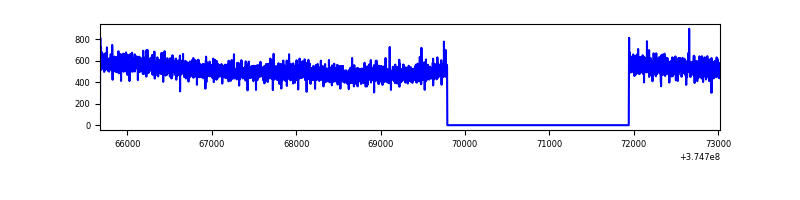 |
| B | 7349 | 5196 | 354 | 354 | 4.82% | 6.81% | 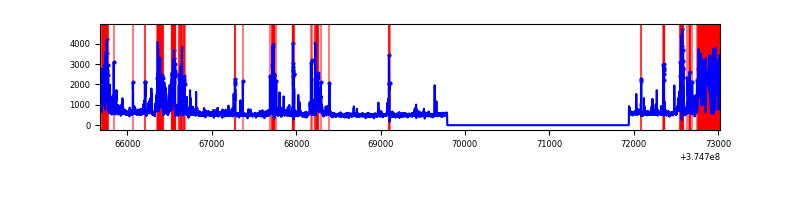 |
| C | 7350 | 5197 | 61 | 61 | 0.83% | 1.17% | 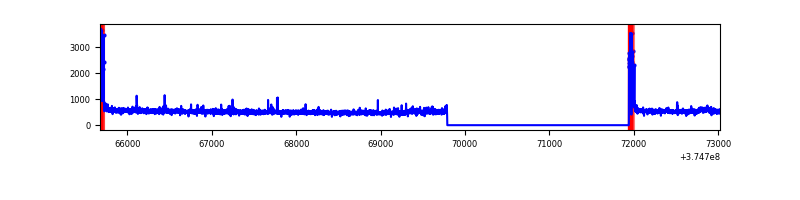 |
| D | 7350 | 5197 | 348 | 348 | 4.73% | 6.70% | 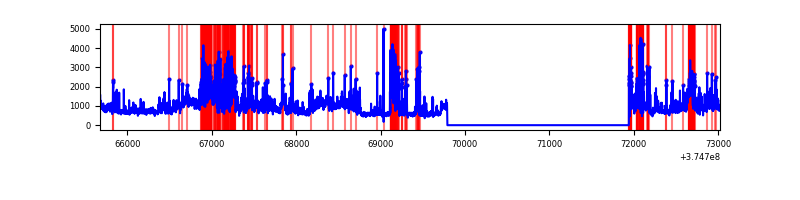 |
Top three noisy pixels from each quadrant. If the there are fewer than three noisy pixels in the level2.evt file, extra rows are filled as -1
| Pixel properties | Quadrant properties | ||||||
|---|---|---|---|---|---|---|---|
| Quadrant | DetID | PixID | Counts | Sigma | Mean | Median | Sigma |
| A | 13 | 6 | 15808 | 111.72 | 681 | 668 | 135.5 |
| A | 13 | 254 | 10240 | 70.63 | 681 | 668 | 135.5 |
| A | 3 | 137 | 5876 | 38.43 | 681 | 668 | 135.5 |
| B | 5 | 172 | 1216408 | 10184.85 | 640 | 624 | 119.4 |
| B | 0 | 219 | 123543 | 1029.71 | 640 | 624 | 119.4 |
| B | 0 | 229 | 107902 | 898.68 | 640 | 624 | 119.4 |
| C | 0 | 10 | 191461 | 1270.89 | 660 | 668 | 150.1 |
| C | 14 | 67 | 67078 | 442.36 | 660 | 668 | 150.1 |
| C | 1 | 241 | 13755 | 87.17 | 660 | 668 | 150.1 |
| D | 8 | 195 | 950167 | 5926.03 | 648 | 634 | 160.2 |
| D | 12 | 218 | 713469 | 4448.8 | 648 | 634 | 160.2 |
| D | 7 | 223 | 321308 | 2001.32 | 648 | 634 | 160.2 |
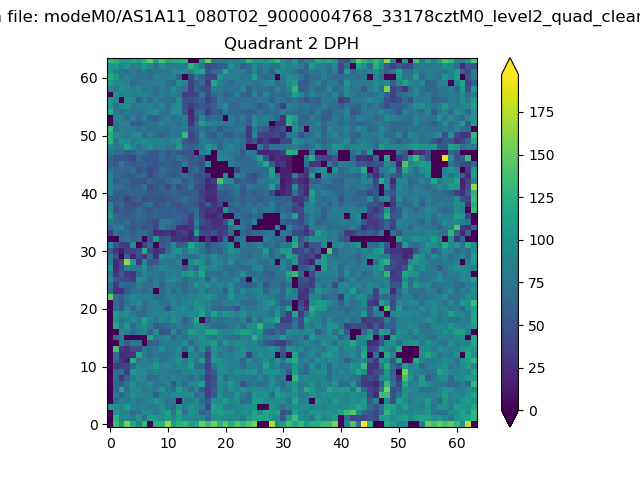
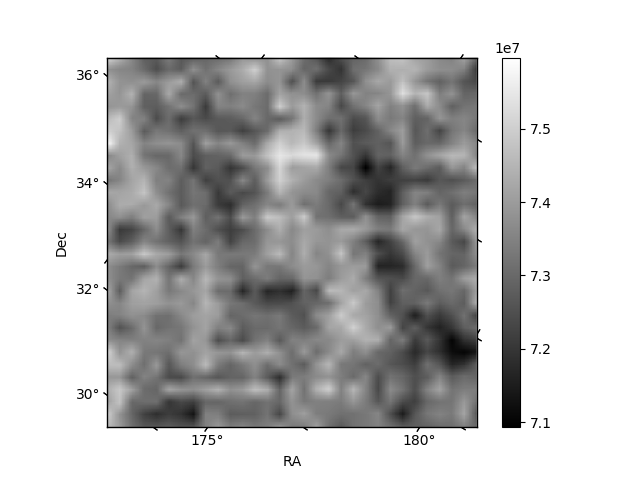
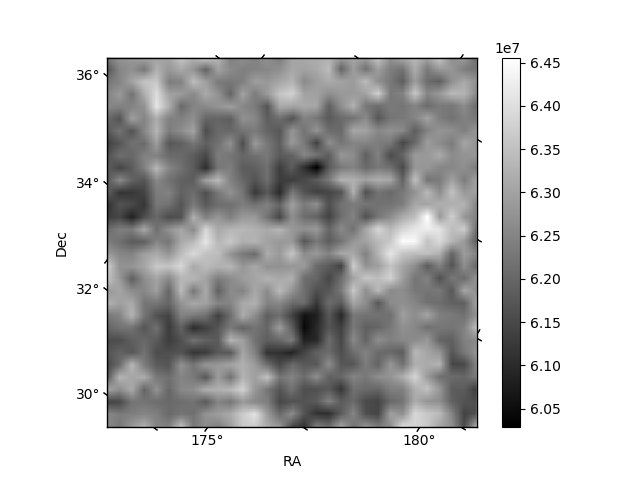
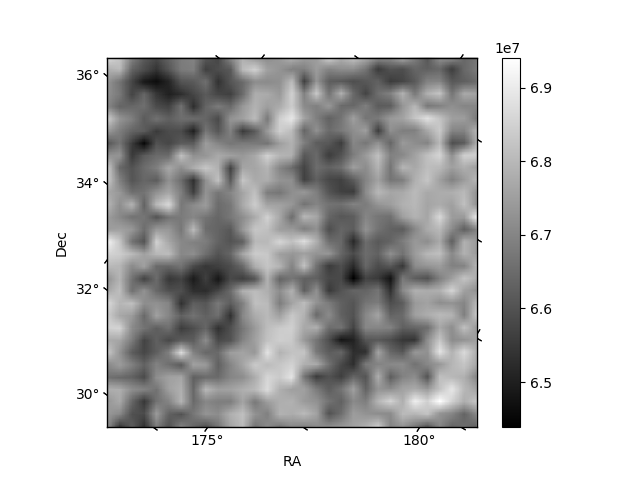
Histogram calculated using DETX and DETY for each event in the final _common_clean file
| Quadrant A | 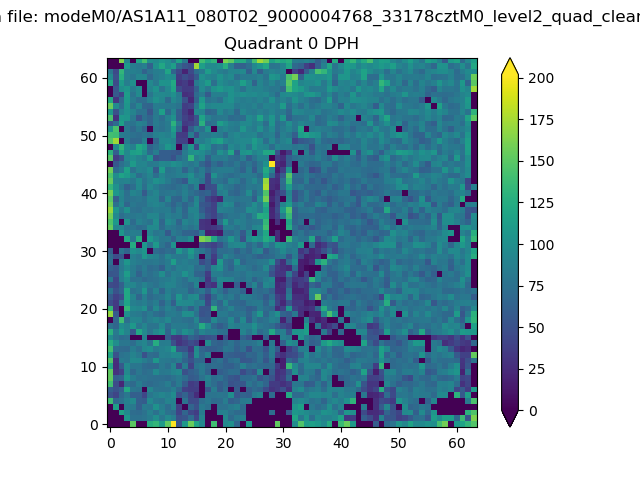 |
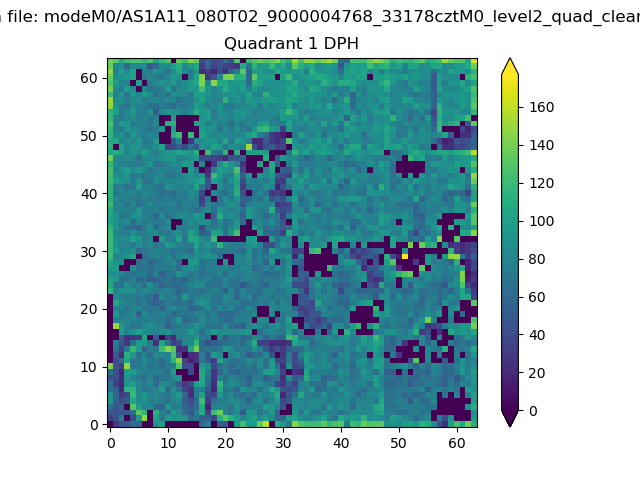 |
Quadrant B |
|---|---|---|---|
| Quadrant D | 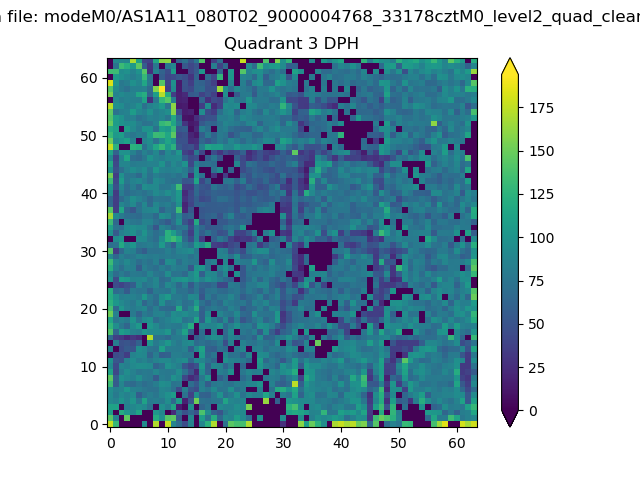 |
 |
Quadrant C |
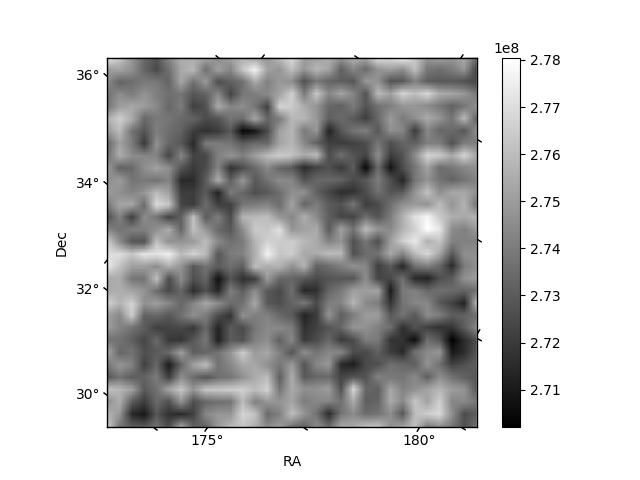
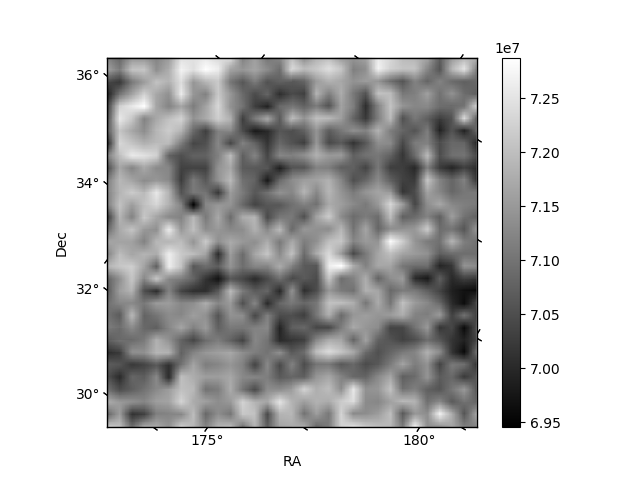
| Plot type | Count rate plots | Images |
|---|---|---|
| Comparison with Poisson distribution Blue bars denote a histogram of data divided into 1 sec bins. Red curve is a Poisson curve with rate = median count rate of data. |
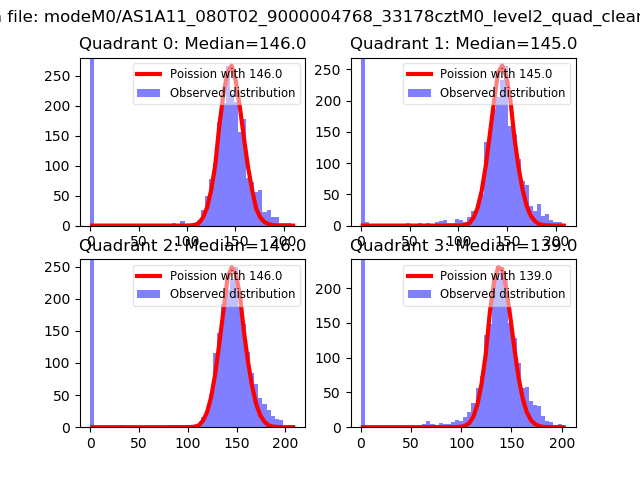 |
 |
| Quadrant-wise count rates Data is divided into 100 sec bins |
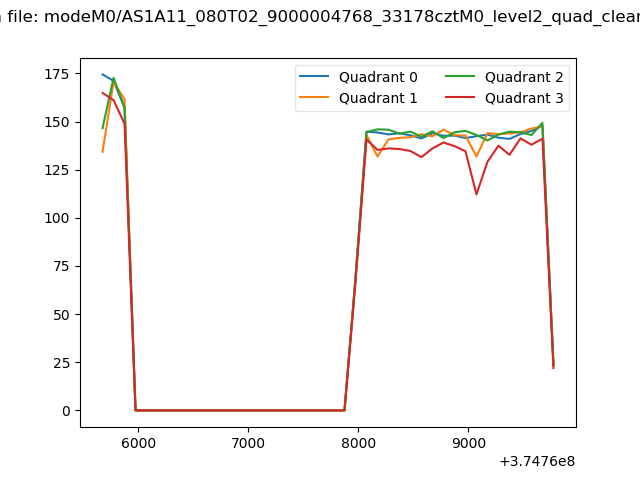 |
|
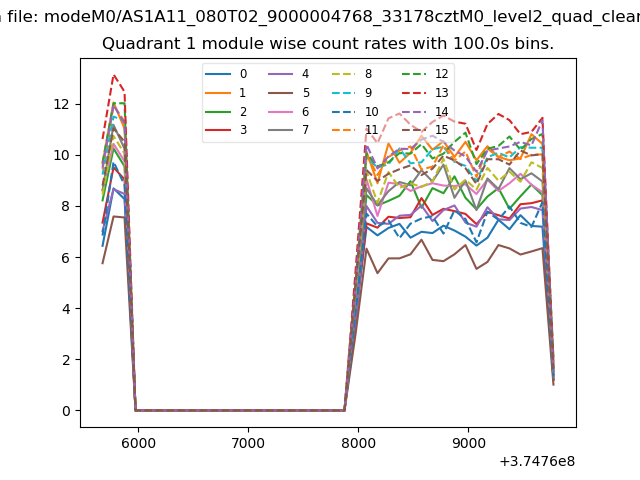
| Module-wise count rates for Quadrant A Data is divided into 100 sec bins |
 |
 |
| Module-wise count rates for Quadrant B Data is divided into 100 sec bins |
 |
 |
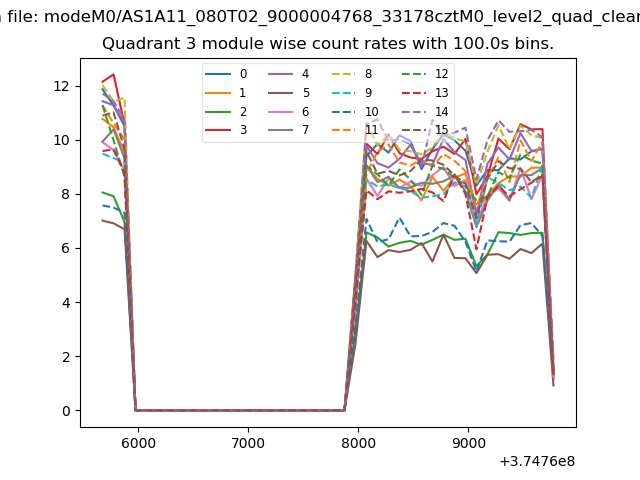
| Module-wise count rates for Quadrant C Data is divided into 100 sec bins |
 |
 |
| Module-wise count rates for Quadrant D Data is divided into 100 sec bins |
 |
 |
| Parameter | Plot |
|---|---|
| CZT HV Monitor |  |
| D_VDD |  |
| Temperature 1 | 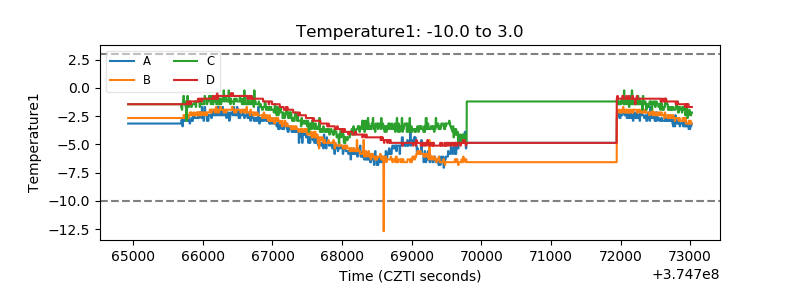 |
| Veto HV Monitor | 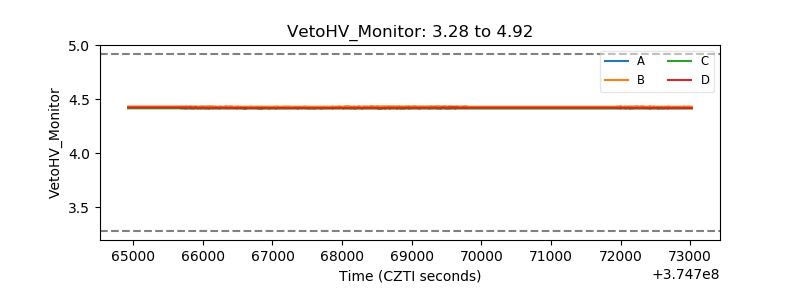 |
| Veto LLD |  |
| Alpha Counter | 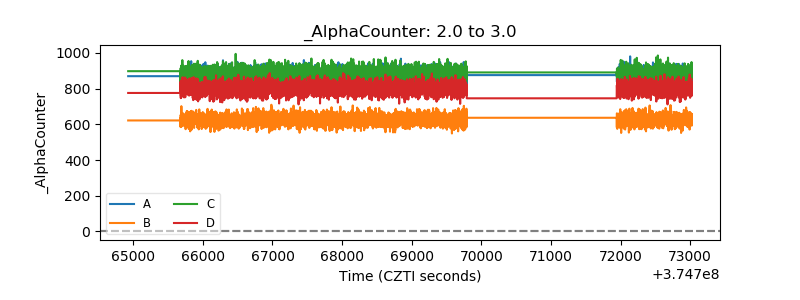 |
| _CPM_Rate | 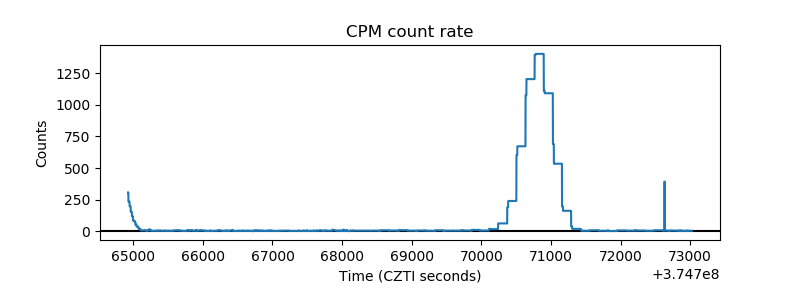 |
| CZT Counter | 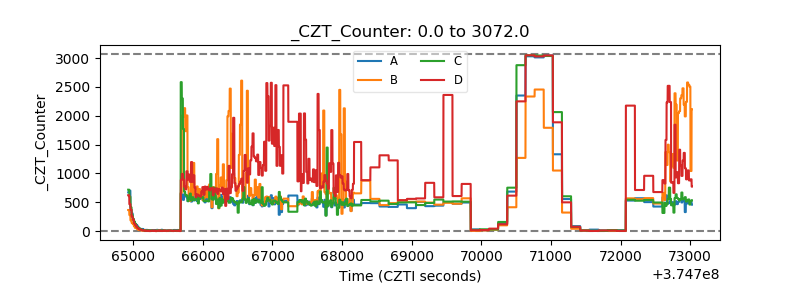 |
| +2.5 Volts monitor |  |
| +5 Volts monitor |  |
| _ROLL_ROT | 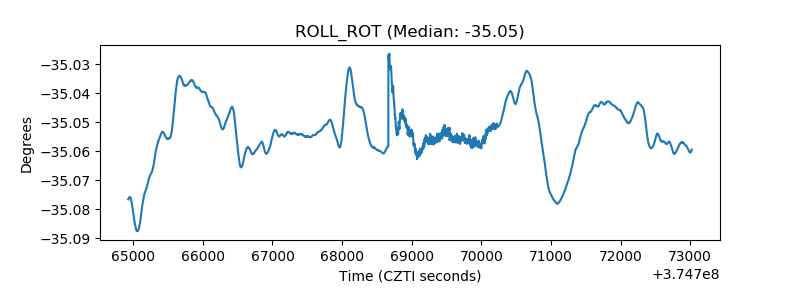 |
| _Roll_DEC | 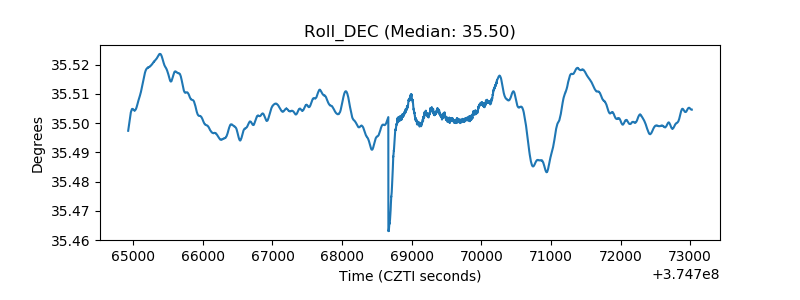 |
| _Roll_RA | 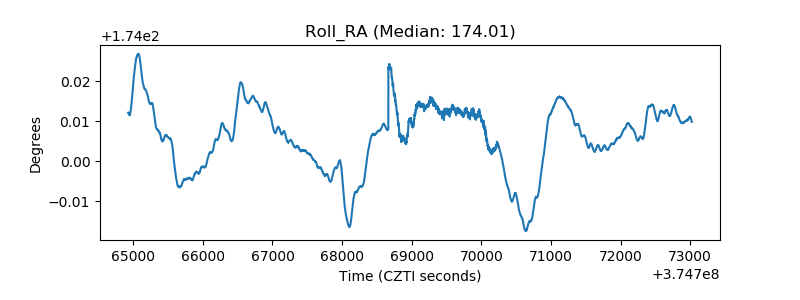 |
| Veto Counter |  |