| Param | Original file | Final file |
|---|---|---|
| Filename | modeM0/AS1A11_080T02_9000004768_33179cztM0_level2.evt | modeM0/AS1A11_080T02_9000004768_33179cztM0_level2_quad_clean.evt |
| Size (bytes) | 479,427,840 | 52,666,560 |
| Size | 457.2 MB | 50.2 MB |
| Events in quadrant A | 2,521,715 | 311,341 |
| Events in quadrant B | 3,858,730 | 313,272 |
| Events in quadrant C | 2,783,853 | 313,231 |
| Events in quadrant D | 5,004,409 | 294,090 |
| Mode M9 | |||
|---|---|---|---|
| Quadrant | BADHDUFLAG | Total packets | Discarded packets |
| A | 0 | 24 | 0 |
| B | 0 | 24 | 0 |
| C | 0 | 24 | 0 |
| D | 0 | 25 | 0 |
| Mode SS | |||
|---|---|---|---|
| Quadrant | BADHDUFLAG | Total packets | Discarded packets |
| A | 0 | 104 | 0 |
| B | 0 | 104 | 0 |
| C | 0 | 104 | 0 |
| D | 0 | 104 | 0 |
| Mode M0 | |||
|---|---|---|---|
| Quadrant | BADHDUFLAG | Total packets | Discarded packets |
| A | 0 | 10504 | 3 |
| B | 0 | 14754 | 2 |
| C | 0 | 11322 | 2 |
| D | 0 | 18481 | 2 |
| Quadrant | Total seconds | Saturated seconds | Saturation percentage |
|---|---|---|---|
| A | 5177 | 7 | 0.135213% |
| B | 5177 | 454 | 8.769558% |
| C | 5177 | 96 | 1.854356% |
| D | 5177 | 386 | 7.456056% |
Noise dominated data is calculated using 1-second bins in cleaned event files. If a bin has >2000 counts, and if more than 50% of those come from <1% of pixels, then it is considered to be noise-dominated and hence unusable.
| Quadrant | # 1 sec bins | Bins with >0 counts | Bins with >2000 counts | High rate bins dominated by noise | Noise dominated (total time) | Noise dominated (detector-on time) | Marked lightcurve |
|---|---|---|---|---|---|---|---|
| A | 7269 | 5178 | 0 | 0 | 0.00% | 0.00% | 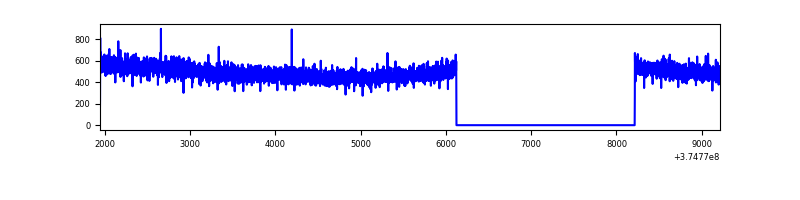 |
| B | 7269 | 5178 | 302 | 302 | 4.15% | 5.83% | 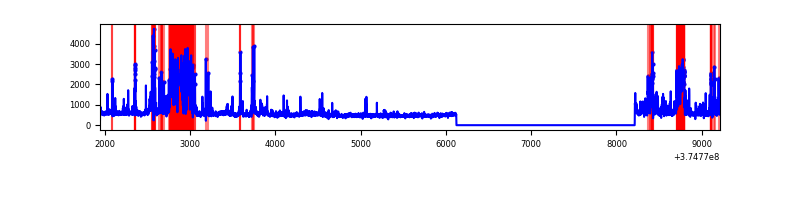 |
| C | 7269 | 5178 | 75 | 75 | 1.03% | 1.45% | 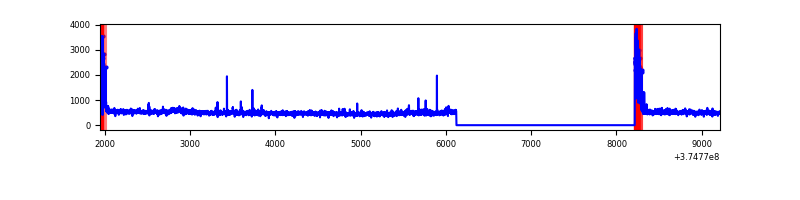 |
| D | 7269 | 5178 | 310 | 310 | 4.26% | 5.99% | 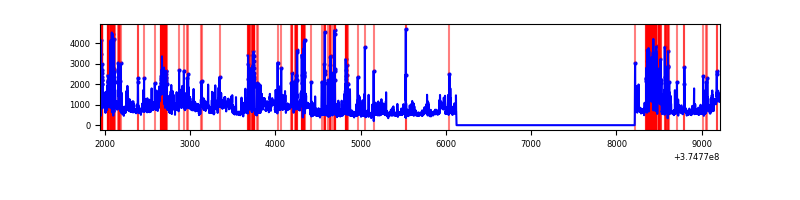 |
Top three noisy pixels from each quadrant. If the there are fewer than three noisy pixels in the level2.evt file, extra rows are filled as -1
| Pixel properties | Quadrant properties | ||||||
|---|---|---|---|---|---|---|---|
| Quadrant | DetID | PixID | Counts | Sigma | Mean | Median | Sigma |
| A | 13 | 6 | 17219 | 129.51 | 647 | 635 | 128.1 |
| A | 13 | 254 | 9992 | 73.07 | 647 | 635 | 128.1 |
| A | 3 | 137 | 5754 | 39.98 | 647 | 635 | 128.1 |
| B | 5 | 172 | 1097050 | 9501.85 | 615 | 601 | 115.4 |
| B | 0 | 219 | 144809 | 1249.71 | 615 | 601 | 115.4 |
| B | 0 | 230 | 35394 | 301.52 | 615 | 601 | 115.4 |
| C | 0 | 10 | 246876 | 1724.0 | 626 | 632 | 142.8 |
| C | 14 | 67 | 58758 | 406.95 | 626 | 632 | 142.8 |
| C | 1 | 241 | 10688 | 70.4 | 626 | 632 | 142.8 |
| D | 8 | 195 | 897577 | 6069.38 | 613 | 599 | 147.8 |
| D | 2 | 250 | 592007 | 4001.75 | 613 | 599 | 147.8 |
| D | 12 | 218 | 319359 | 2156.88 | 613 | 599 | 147.8 |
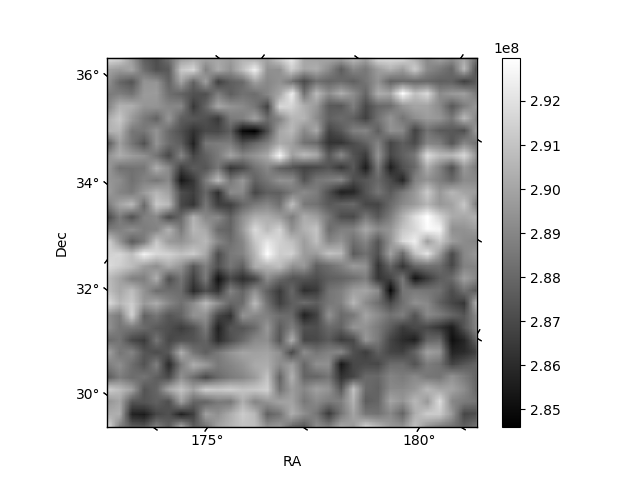
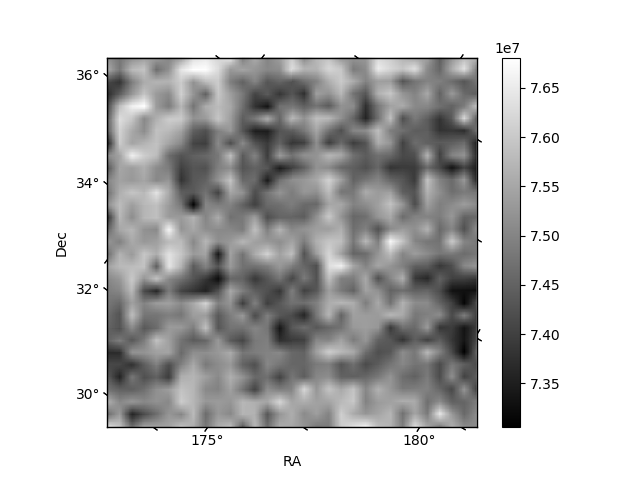
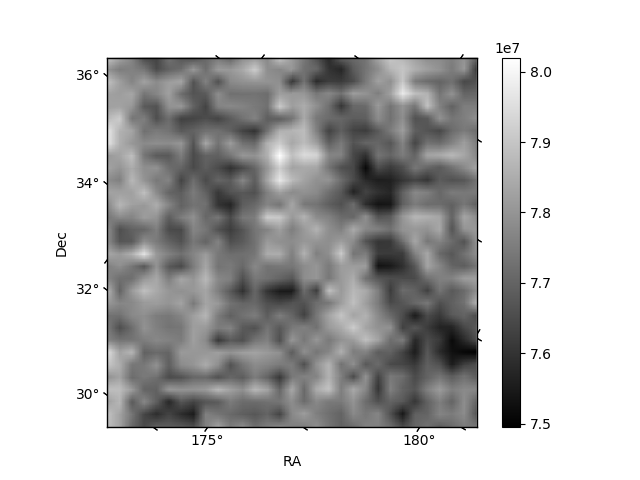
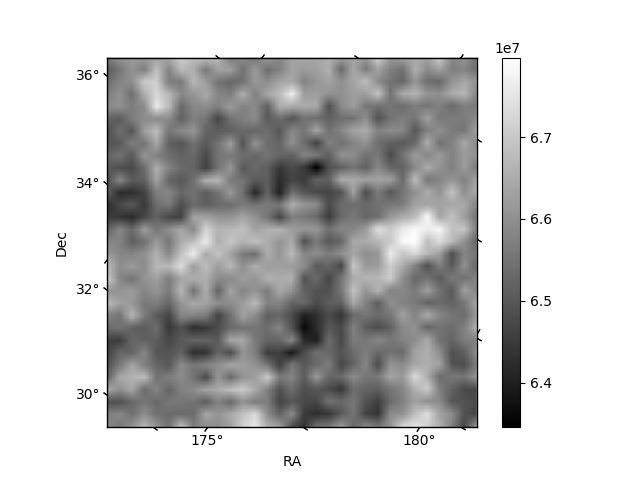
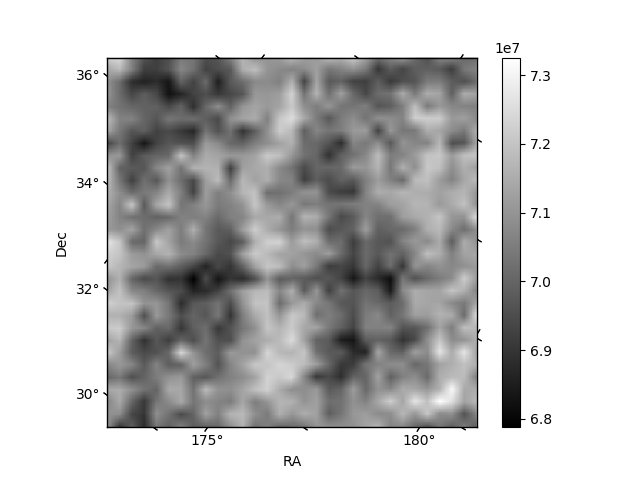
Histogram calculated using DETX and DETY for each event in the final _common_clean file
| Quadrant A | 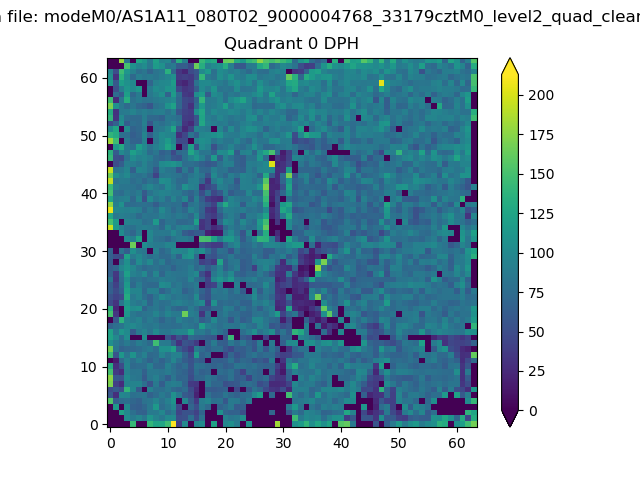 |
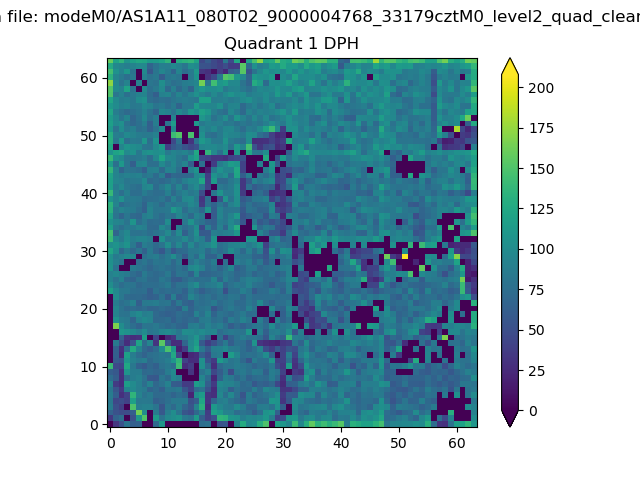 |
Quadrant B |
|---|---|---|---|
| Quadrant D | 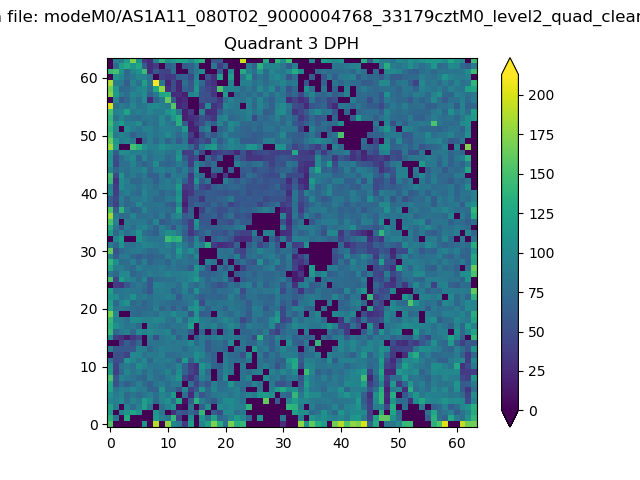 |
 |
Quadrant C |
| Plot type | Count rate plots | Images |
|---|---|---|
| Comparison with Poisson distribution Blue bars denote a histogram of data divided into 1 sec bins. Red curve is a Poisson curve with rate = median count rate of data. |
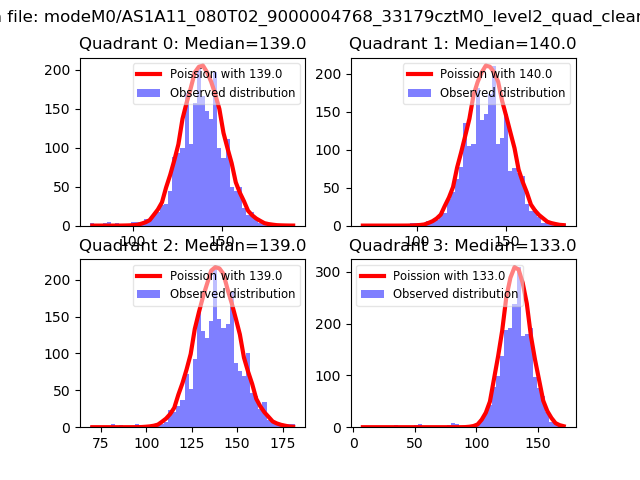 |
 |
| Quadrant-wise count rates Data is divided into 100 sec bins |
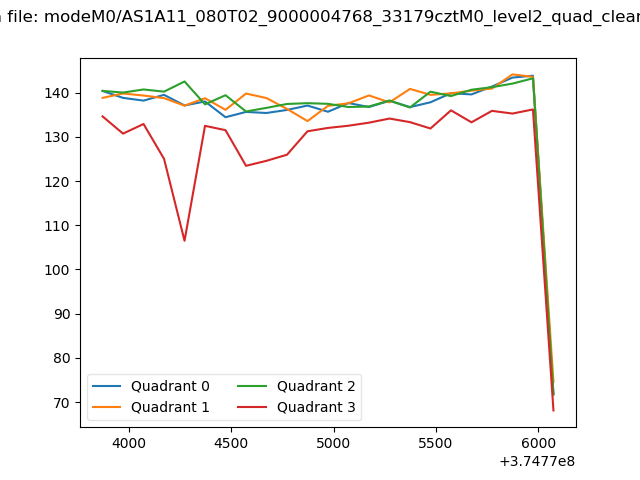 |
|
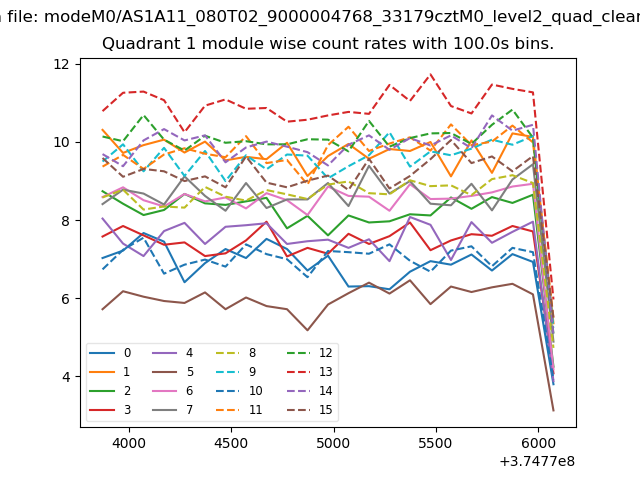
| Module-wise count rates for Quadrant A Data is divided into 100 sec bins |
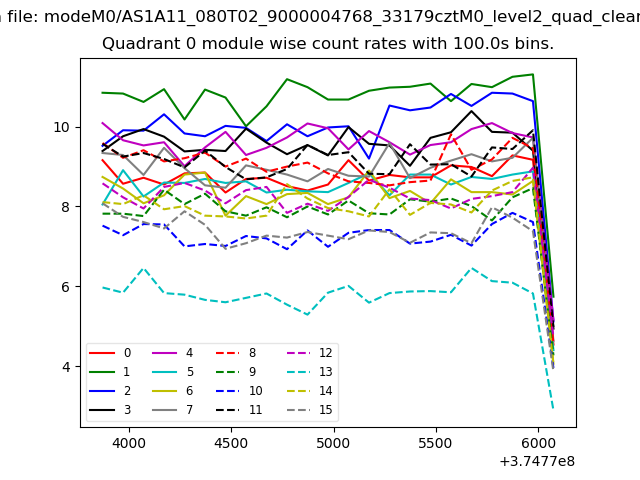 |
 |
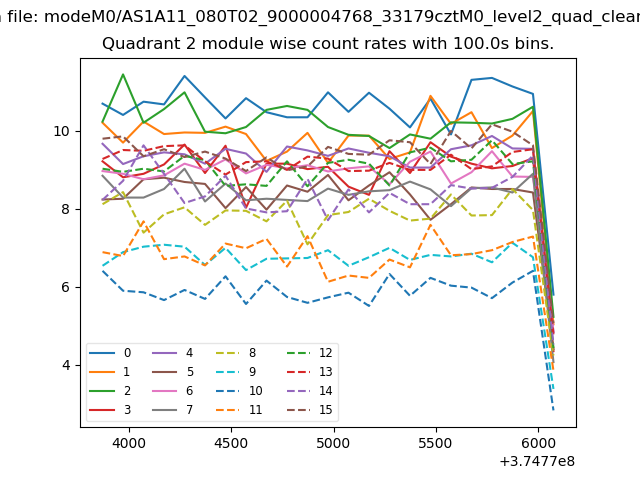
| Module-wise count rates for Quadrant B Data is divided into 100 sec bins |
 |
 |
| Module-wise count rates for Quadrant C Data is divided into 100 sec bins |
 |
 |
| Module-wise count rates for Quadrant D Data is divided into 100 sec bins |
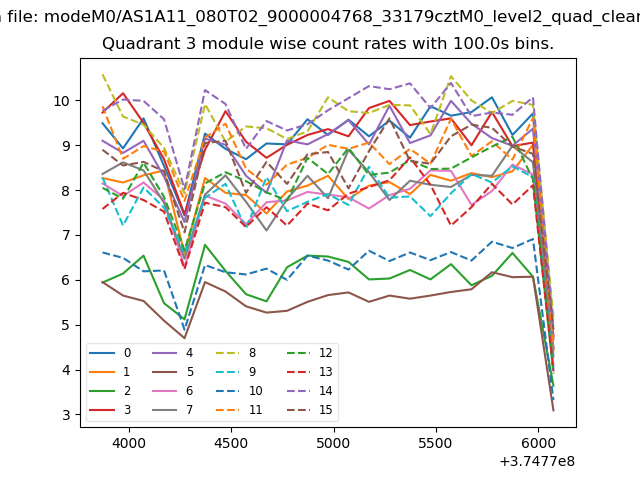 |
 |
| Parameter | Plot |
|---|---|
| CZT HV Monitor | 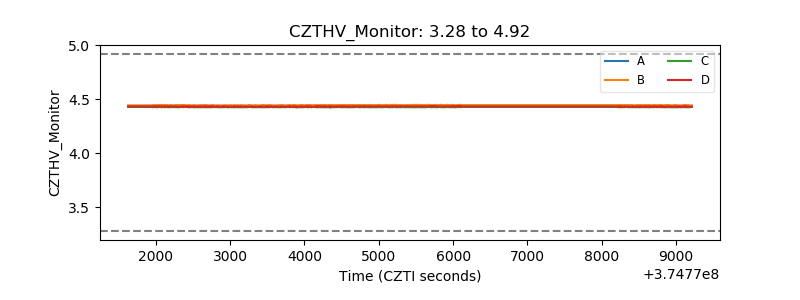 |
| D_VDD | 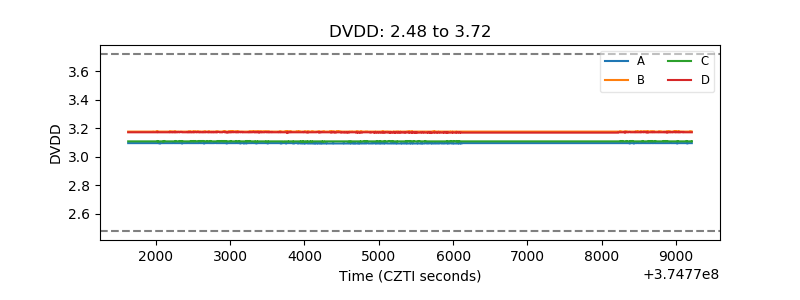 |
| Temperature 1 | 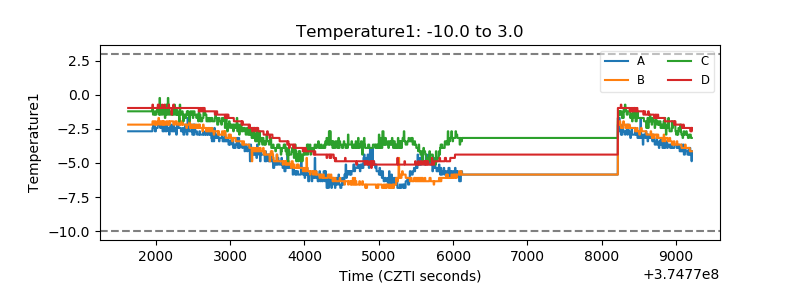 |
| Veto HV Monitor |  |
| Veto LLD | 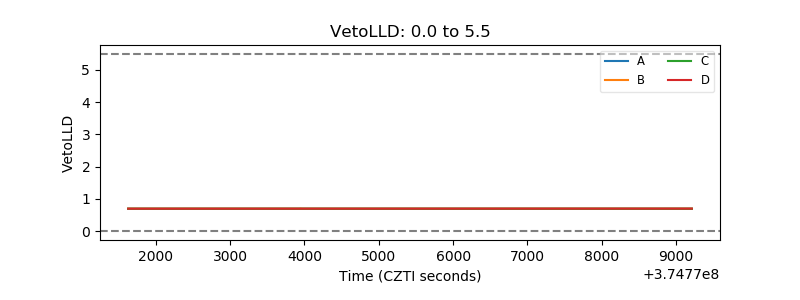 |
| Alpha Counter | 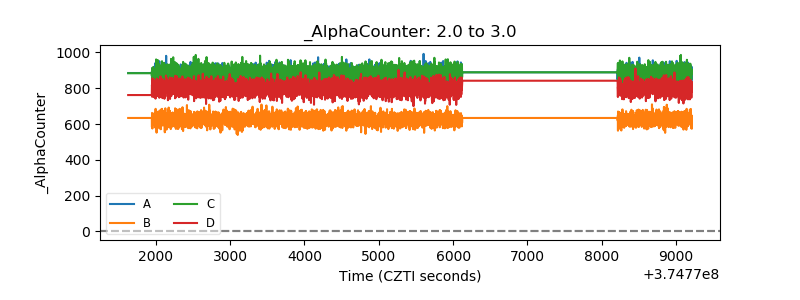 |
| _CPM_Rate | 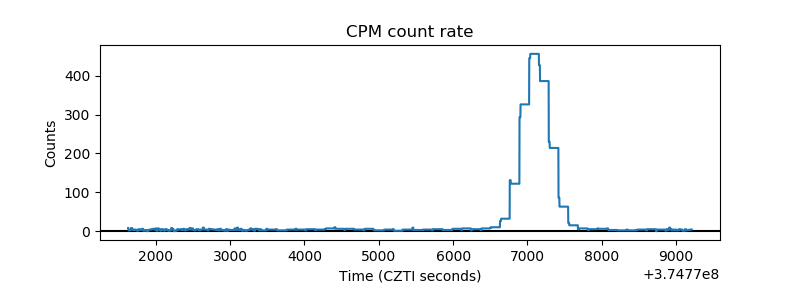 |
| CZT Counter |  |
| +2.5 Volts monitor |  |
| +5 Volts monitor | 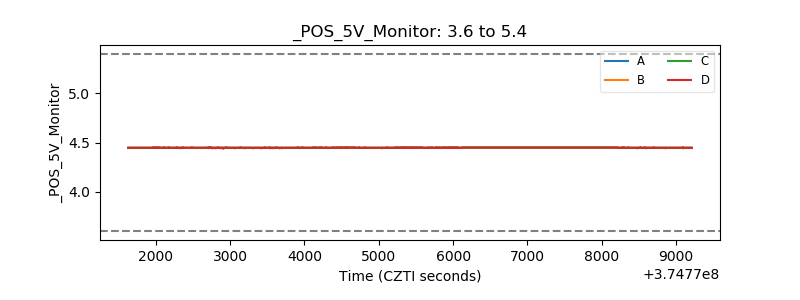 |
| _ROLL_ROT | 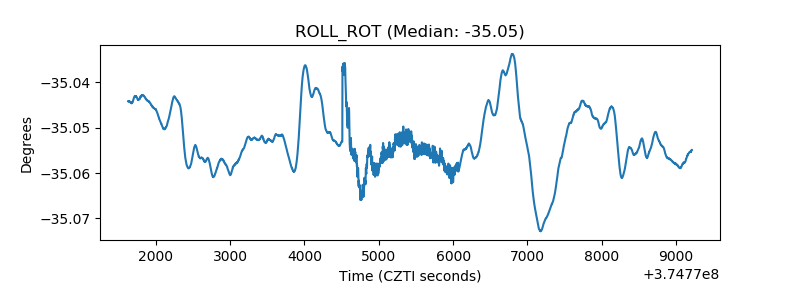 |
| _Roll_DEC | 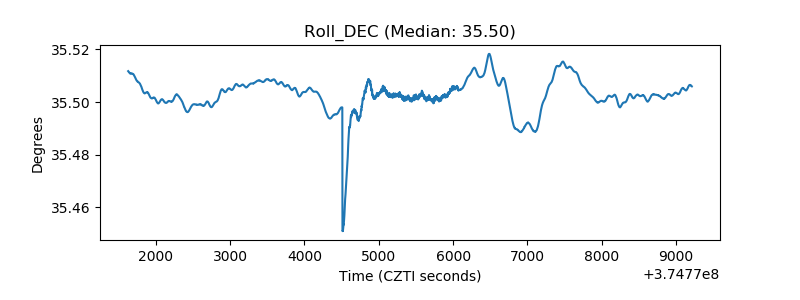 |
| _Roll_RA | 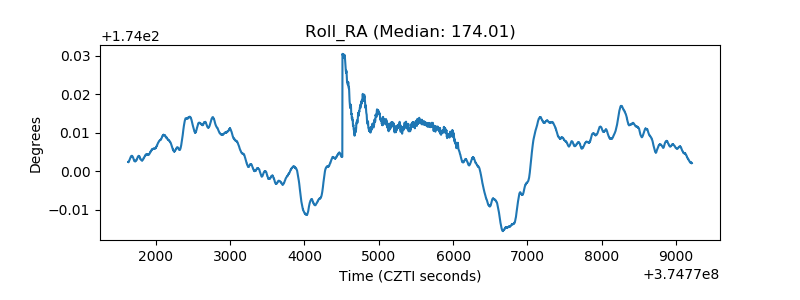 |
| Veto Counter | 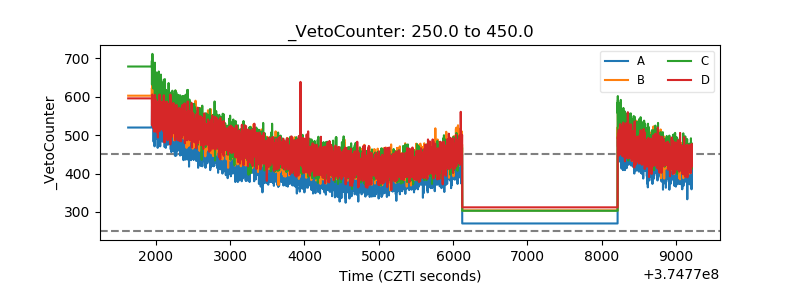 |