| Param | Original file | Final file |
|---|---|---|
| Filename | modeM0/AS1A11_080T02_9000004768_33180cztM0_level2.evt | modeM0/AS1A11_080T02_9000004768_33180cztM0_level2_quad_clean.evt |
| Size (bytes) | 481,613,760 | 61,606,080 |
| Size | 459.3 MB | 58.8 MB |
| Events in quadrant A | 2,438,390 | 380,260 |
| Events in quadrant B | 3,463,236 | 380,806 |
| Events in quadrant C | 2,774,854 | 379,625 |
| Events in quadrant D | 5,553,743 | 357,305 |
| Mode M9 | |||
|---|---|---|---|
| Quadrant | BADHDUFLAG | Total packets | Discarded packets |
| A | 0 | 27 | 0 |
| B | 0 | 27 | 0 |
| C | 0 | 27 | 0 |
| D | 0 | 28 | 0 |
| Mode SS | |||
|---|---|---|---|
| Quadrant | BADHDUFLAG | Total packets | Discarded packets |
| A | 0 | 106 | 0 |
| B | 0 | 106 | 0 |
| C | 0 | 106 | 0 |
| D | 0 | 106 | 0 |
| Mode M0 | |||
|---|---|---|---|
| Quadrant | BADHDUFLAG | Total packets | Discarded packets |
| A | 0 | 10560 | 3 |
| B | 0 | 13720 | 2 |
| C | 0 | 11521 | 2 |
| D | 0 | 20138 | 2 |
| Quadrant | Total seconds | Saturated seconds | Saturation percentage |
|---|---|---|---|
| A | 5245 | 4 | 0.076263% |
| B | 5245 | 251 | 4.785510% |
| C | 5245 | 92 | 1.754051% |
| D | 5245 | 623 | 11.877979% |
Noise dominated data is calculated using 1-second bins in cleaned event files. If a bin has >2000 counts, and if more than 50% of those come from <1% of pixels, then it is considered to be noise-dominated and hence unusable.
| Quadrant | # 1 sec bins | Bins with >0 counts | Bins with >2000 counts | High rate bins dominated by noise | Noise dominated (total time) | Noise dominated (detector-on time) | Marked lightcurve |
|---|---|---|---|---|---|---|---|
| A | 7096 | 5246 | 0 | 0 | 0.00% | 0.00% | 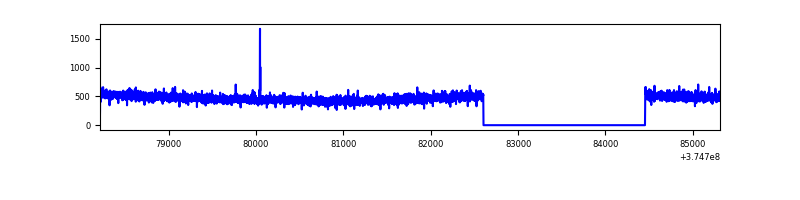 |
| B | 7096 | 5246 | 167 | 167 | 2.35% | 3.18% | 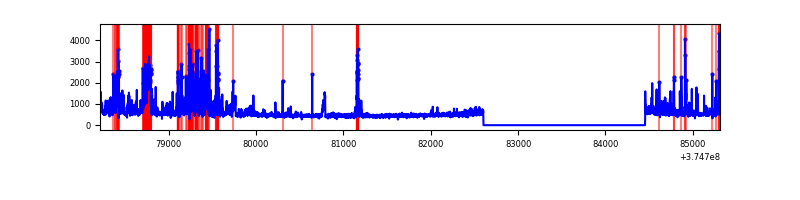 |
| C | 7096 | 5246 | 67 | 67 | 0.94% | 1.28% | 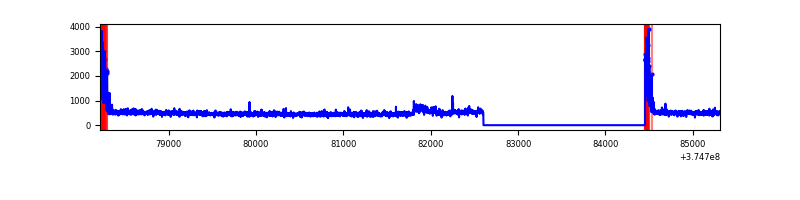 |
| D | 7096 | 5246 | 499 | 499 | 7.03% | 9.51% | 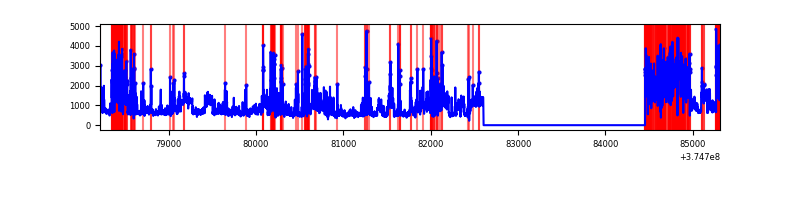 |
Top three noisy pixels from each quadrant. If the there are fewer than three noisy pixels in the level2.evt file, extra rows are filled as -1
| Pixel properties | Quadrant properties | ||||||
|---|---|---|---|---|---|---|---|
| Quadrant | DetID | PixID | Counts | Sigma | Mean | Median | Sigma |
| A | 13 | 6 | 10642 | 79.76 | 626 | 615 | 125.7 |
| A | 13 | 254 | 10161 | 75.94 | 626 | 615 | 125.7 |
| A | 3 | 137 | 5899 | 42.03 | 626 | 615 | 125.7 |
| B | 5 | 172 | 694325 | 5980.69 | 613 | 598 | 116.0 |
| B | 0 | 219 | 146600 | 1258.7 | 613 | 598 | 116.0 |
| B | 0 | 190 | 105412 | 903.61 | 613 | 598 | 116.0 |
| C | 0 | 10 | 252627 | 1803.51 | 606 | 612 | 139.7 |
| C | 1 | 23 | 75929 | 538.99 | 606 | 612 | 139.7 |
| C | 14 | 67 | 53799 | 380.62 | 606 | 612 | 139.7 |
| D | 8 | 195 | 1389692 | 9975.31 | 572 | 560 | 139.3 |
| D | 7 | 223 | 654910 | 4698.86 | 572 | 560 | 139.3 |
| D | 12 | 218 | 397402 | 2849.71 | 572 | 560 | 139.3 |
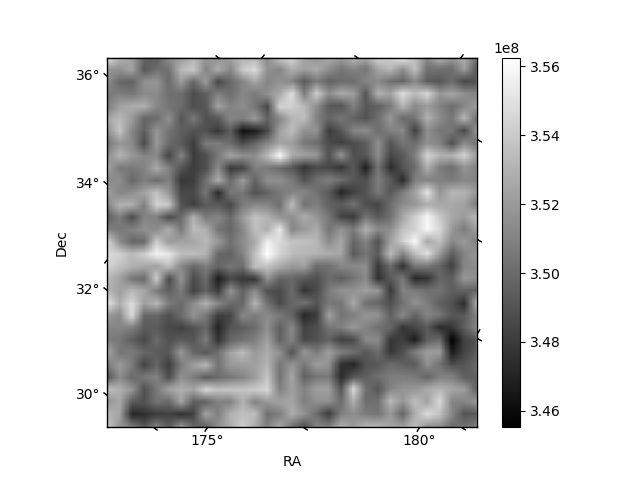
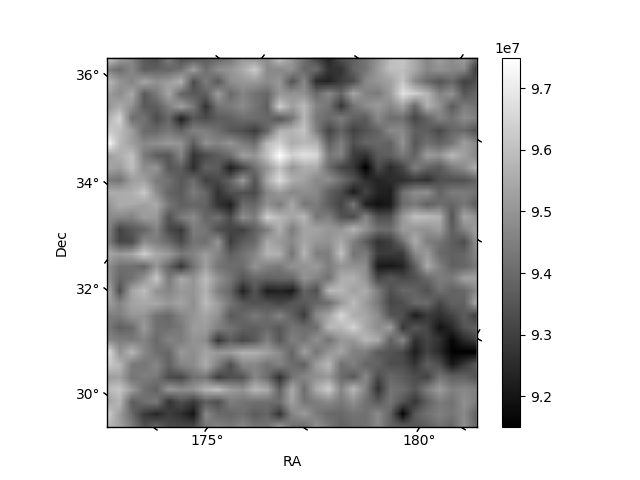
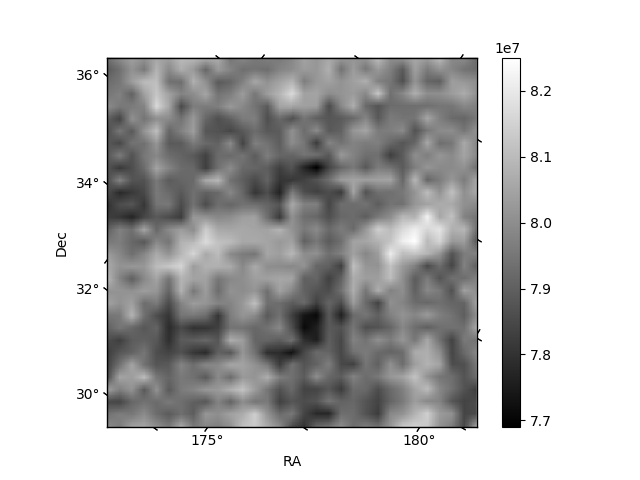
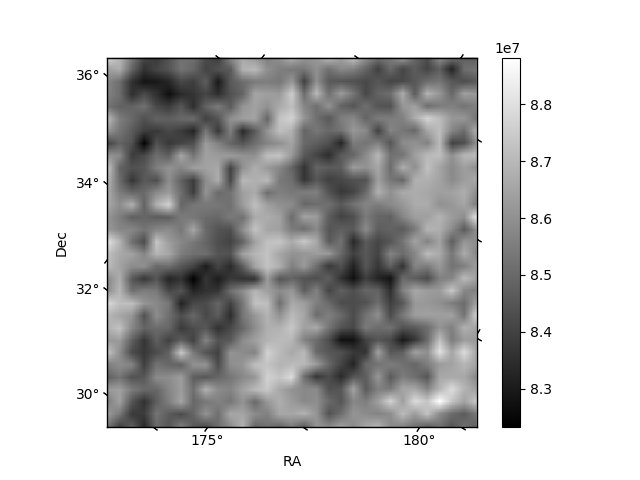
Histogram calculated using DETX and DETY for each event in the final _common_clean file
| Quadrant A | 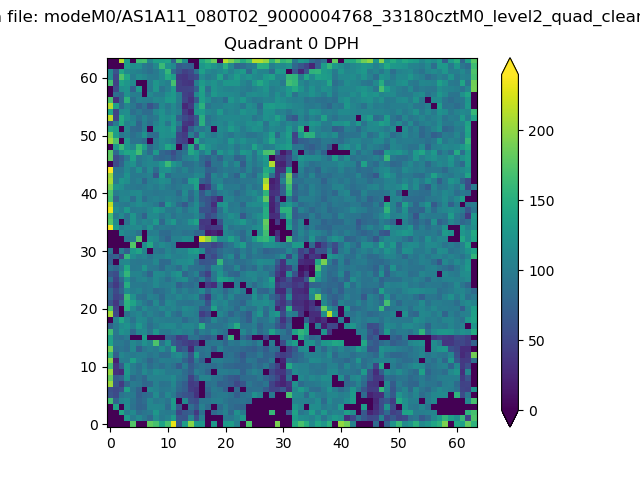 |
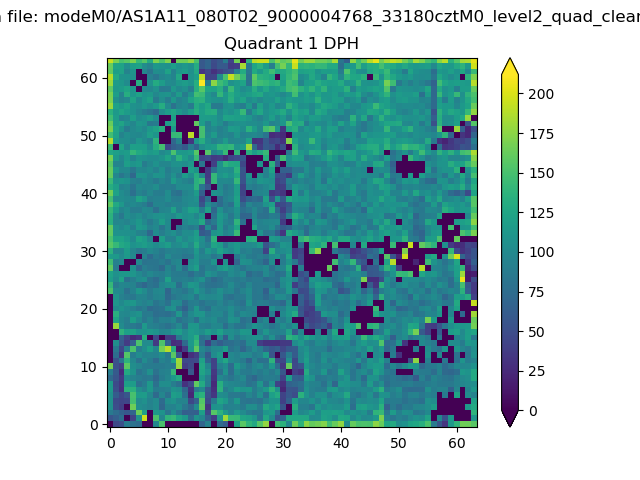 |
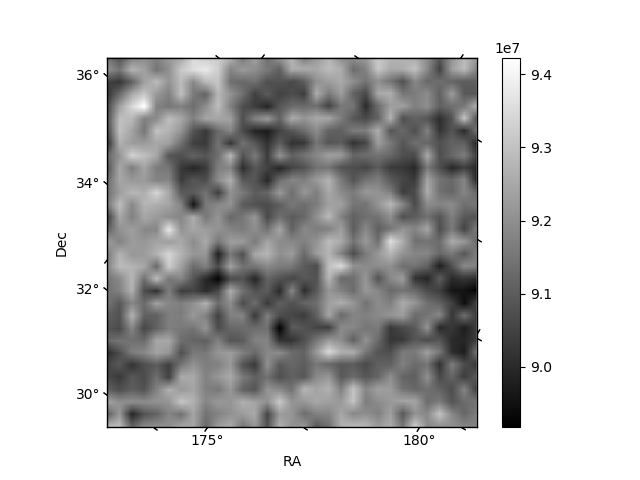
Quadrant B |
|---|---|---|---|
| Quadrant D |  |
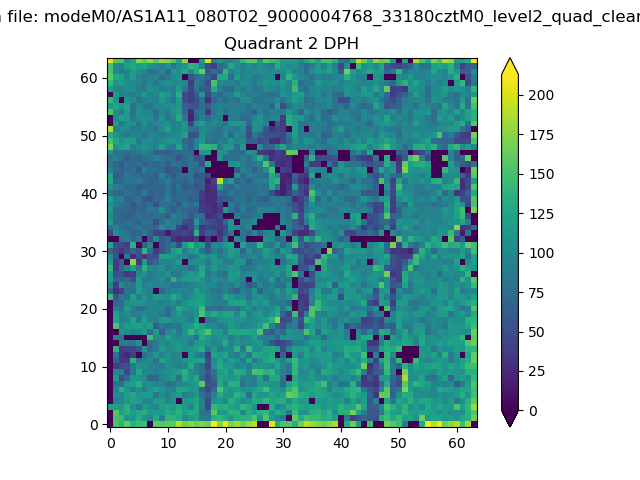 |
Quadrant C |
| Plot type | Count rate plots | Images |
|---|---|---|
| Comparison with Poisson distribution Blue bars denote a histogram of data divided into 1 sec bins. Red curve is a Poisson curve with rate = median count rate of data. |
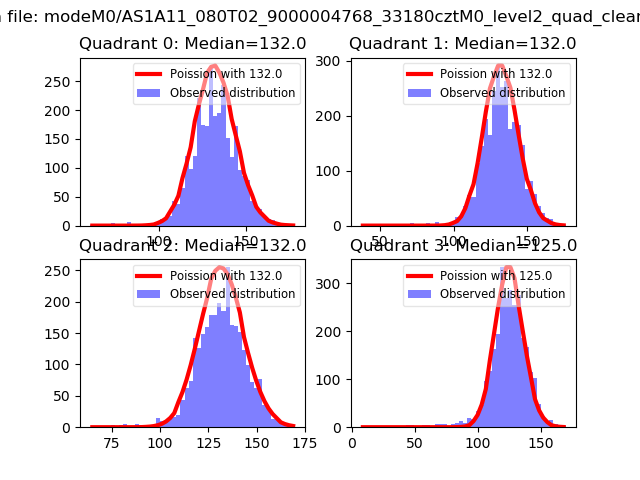 |
 |
| Quadrant-wise count rates Data is divided into 100 sec bins |
 |
|
| Module-wise count rates for Quadrant A Data is divided into 100 sec bins |
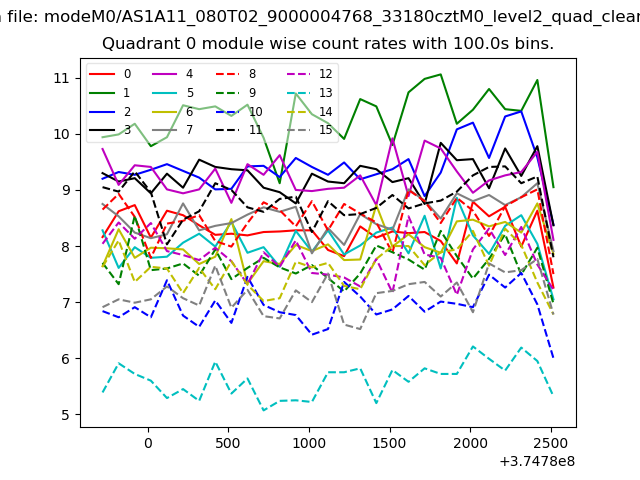 |
 |
| Module-wise count rates for Quadrant B Data is divided into 100 sec bins |
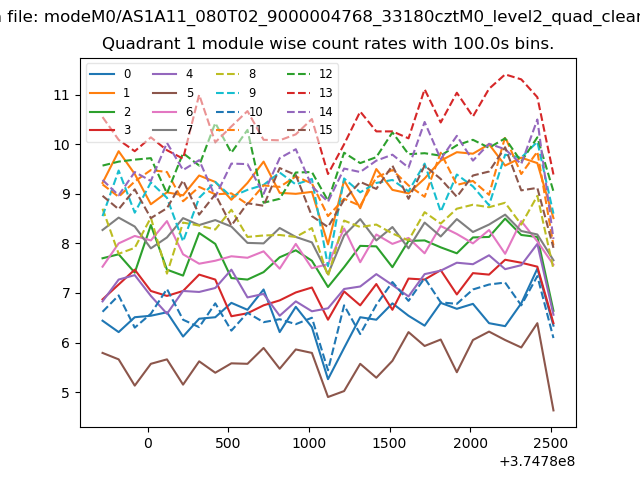 |
 |
| Module-wise count rates for Quadrant C Data is divided into 100 sec bins |
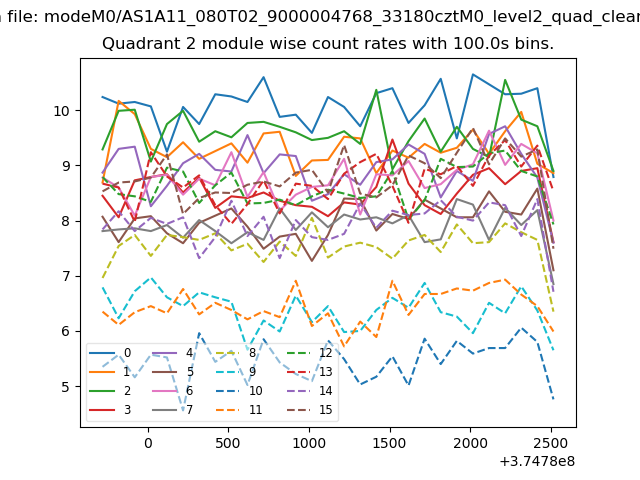 |
 |
| Module-wise count rates for Quadrant D Data is divided into 100 sec bins |
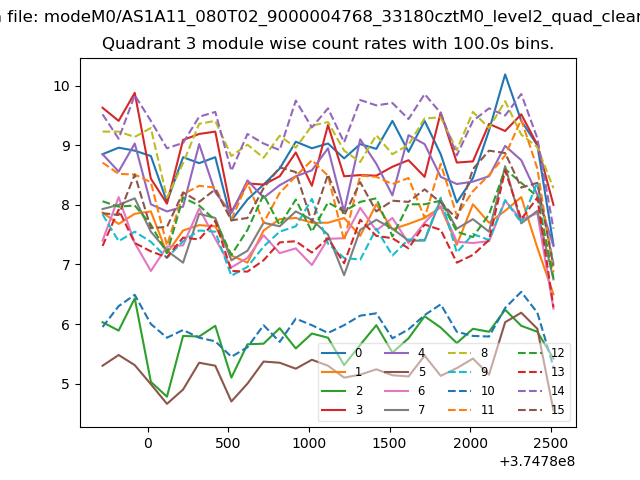 |
 |
| Parameter | Plot |
|---|---|
| CZT HV Monitor | 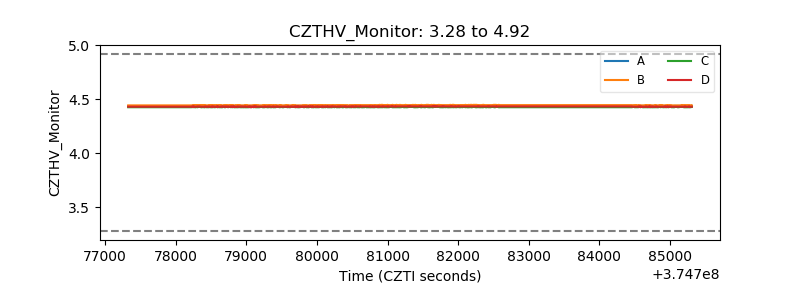 |
| D_VDD | 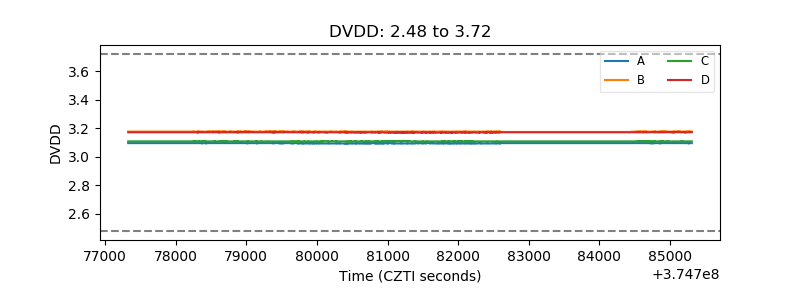 |
| Temperature 1 | 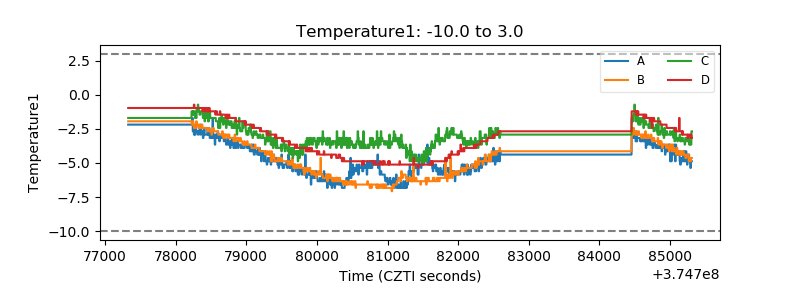 |
| Veto HV Monitor |  |
| Veto LLD | 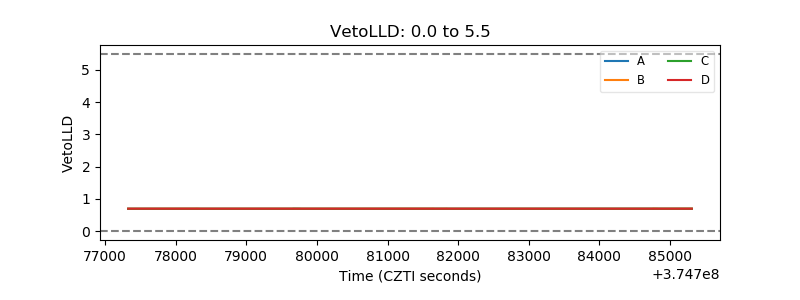 |
| Alpha Counter | 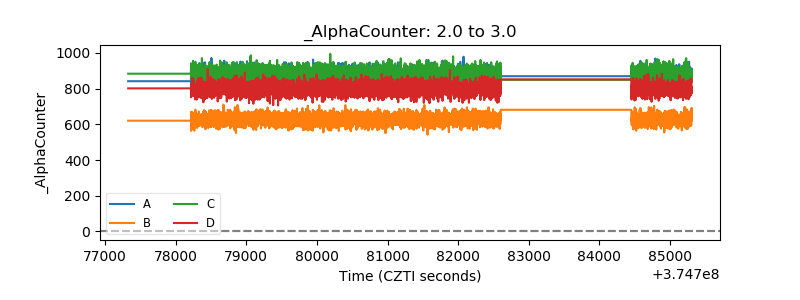 |
| _CPM_Rate | 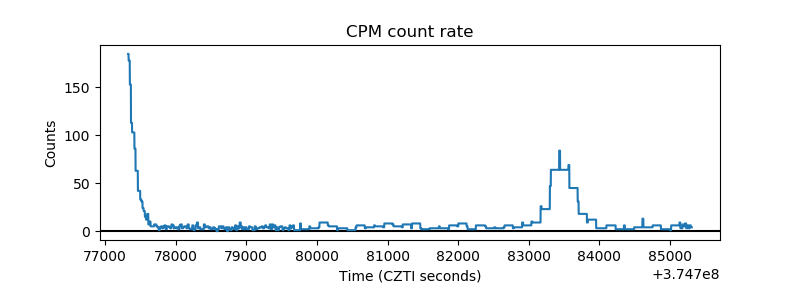 |
| CZT Counter | 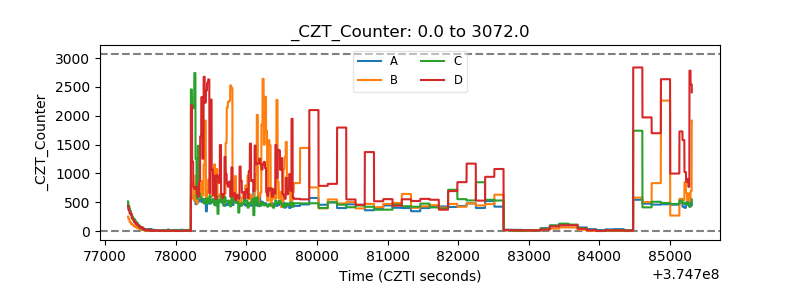 |
| +2.5 Volts monitor |  |
| +5 Volts monitor | 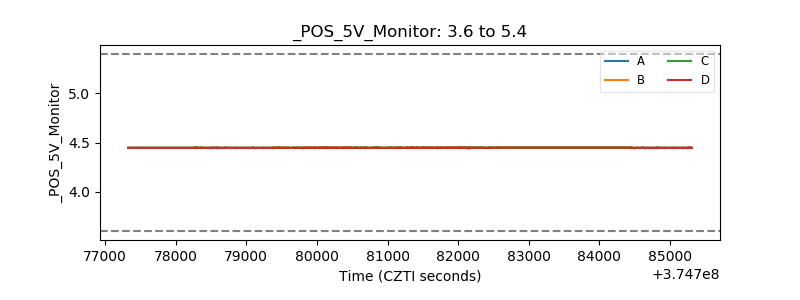 |
| _ROLL_ROT | 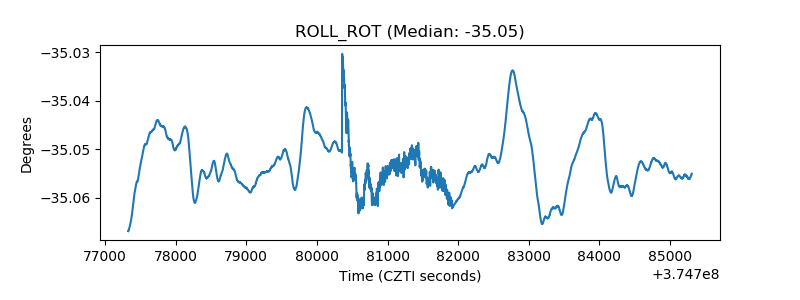 |
| _Roll_DEC | 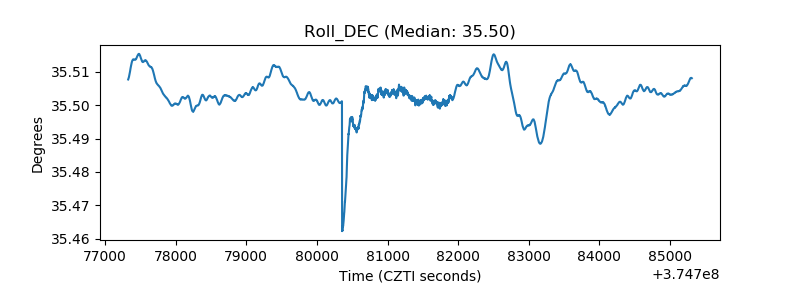 |
| _Roll_RA | 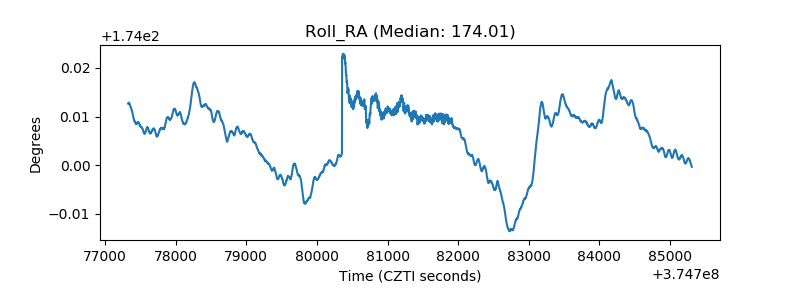 |
| Veto Counter | 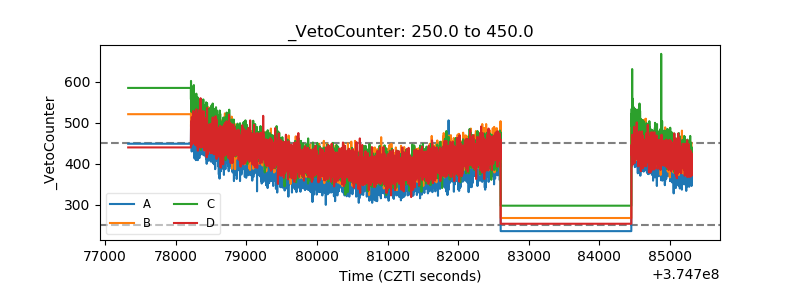 |