| Param | Original file | Final file |
|---|---|---|
| Filename | modeM0/AS1A11_080T02_9000004768_33181cztM0_level2.evt | modeM0/AS1A11_080T02_9000004768_33181cztM0_level2_quad_clean.evt |
| Size (bytes) | 586,468,800 | 76,227,840 |
| Size | 559.3 MB | 72.7 MB |
| Events in quadrant A | 2,585,759 | 493,337 |
| Events in quadrant B | 3,878,848 | 487,957 |
| Events in quadrant C | 2,993,911 | 493,194 |
| Events in quadrant D | 7,920,510 | 438,455 |
| Mode M9 | |||
|---|---|---|---|
| Quadrant | BADHDUFLAG | Total packets | Discarded packets |
| A | 0 | 15 | 0 |
| B | 0 | 15 | 0 |
| C | 0 | 15 | 0 |
| D | 0 | 16 | 0 |
| Mode SS | |||
|---|---|---|---|
| Quadrant | BADHDUFLAG | Total packets | Discarded packets |
| A | 0 | 114 | 0 |
| B | 0 | 114 | 0 |
| C | 0 | 114 | 0 |
| D | 0 | 114 | 0 |
| Mode M0 | |||
|---|---|---|---|
| Quadrant | BADHDUFLAG | Total packets | Discarded packets |
| A | 0 | 11367 | 2 |
| B | 0 | 15305 | 1 |
| C | 0 | 12366 | 1 |
| D | 0 | 27527 | 1 |
| Quadrant | Total seconds | Saturated seconds | Saturation percentage |
|---|---|---|---|
| A | 5652 | 3 | 0.053079% |
| B | 5652 | 289 | 5.113234% |
| C | 5652 | 69 | 1.220807% |
| D | 5652 | 1227 | 21.709130% |
Noise dominated data is calculated using 1-second bins in cleaned event files. If a bin has >2000 counts, and if more than 50% of those come from <1% of pixels, then it is considered to be noise-dominated and hence unusable.
| Quadrant | # 1 sec bins | Bins with >0 counts | Bins with >2000 counts | High rate bins dominated by noise | Noise dominated (total time) | Noise dominated (detector-on time) | Marked lightcurve |
|---|---|---|---|---|---|---|---|
| A | 7145 | 5653 | 0 | 0 | 0.00% | 0.00% | 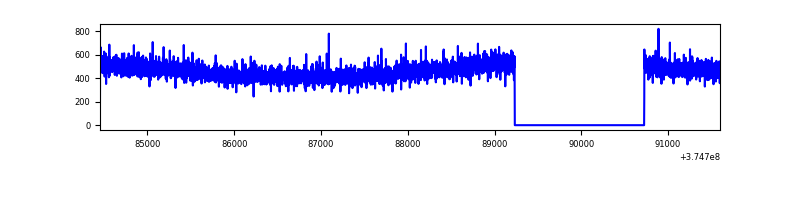 |
| B | 7145 | 5653 | 166 | 166 | 2.32% | 2.94% | 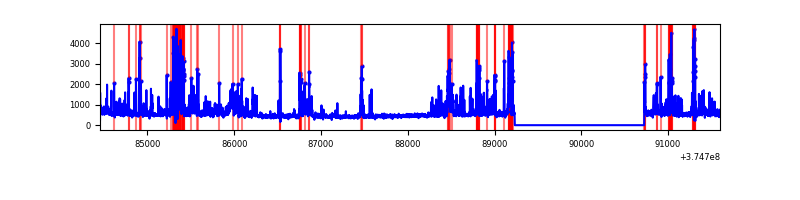 |
| C | 7145 | 5653 | 49 | 49 | 0.69% | 0.87% | 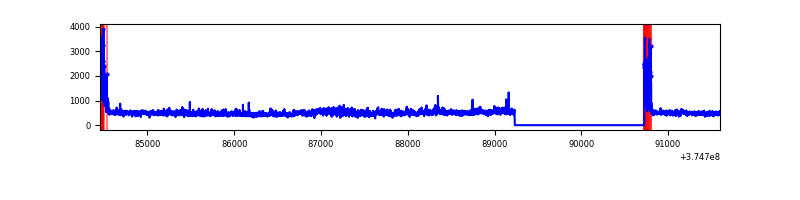 |
| D | 7145 | 5653 | 1155 | 1155 | 16.17% | 20.43% | 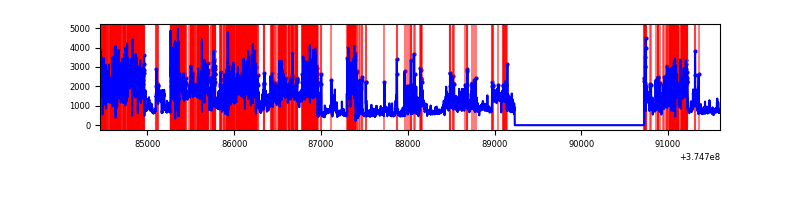 |
Top three noisy pixels from each quadrant. If the there are fewer than three noisy pixels in the level2.evt file, extra rows are filled as -1
| Pixel properties | Quadrant properties | ||||||
|---|---|---|---|---|---|---|---|
| Quadrant | DetID | PixID | Counts | Sigma | Mean | Median | Sigma |
| A | 13 | 254 | 10822 | 75.63 | 666 | 650 | 134.5 |
| A | 13 | 6 | 8433 | 57.87 | 666 | 650 | 134.5 |
| A | 3 | 137 | 6372 | 42.54 | 666 | 650 | 134.5 |
| B | 5 | 172 | 574194 | 4620.19 | 647 | 629 | 124.1 |
| B | 0 | 219 | 459620 | 3697.27 | 647 | 629 | 124.1 |
| B | 0 | 190 | 84982 | 679.48 | 647 | 629 | 124.1 |
| C | 14 | 67 | 249233 | 1664.63 | 643 | 649 | 149.3 |
| C | 0 | 10 | 207677 | 1386.35 | 643 | 649 | 149.3 |
| C | 12 | 251 | 7846 | 48.19 | 643 | 649 | 149.3 |
| D | 8 | 195 | 2100637 | 14793.86 | 588 | 574 | 142.0 |
| D | 7 | 223 | 1688085 | 11887.64 | 588 | 574 | 142.0 |
| D | 12 | 218 | 969074 | 6822.58 | 588 | 574 | 142.0 |
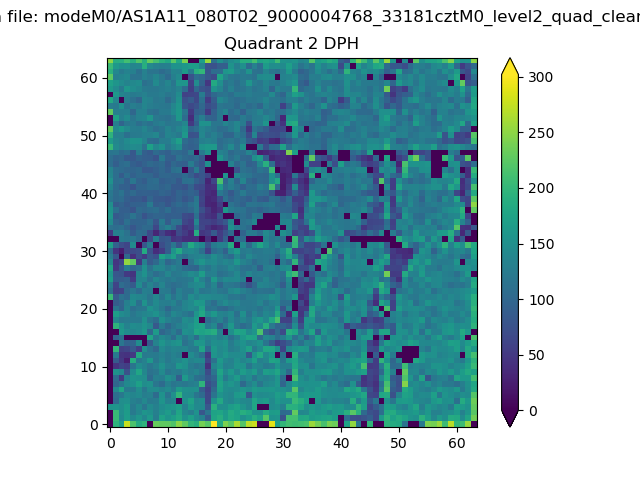
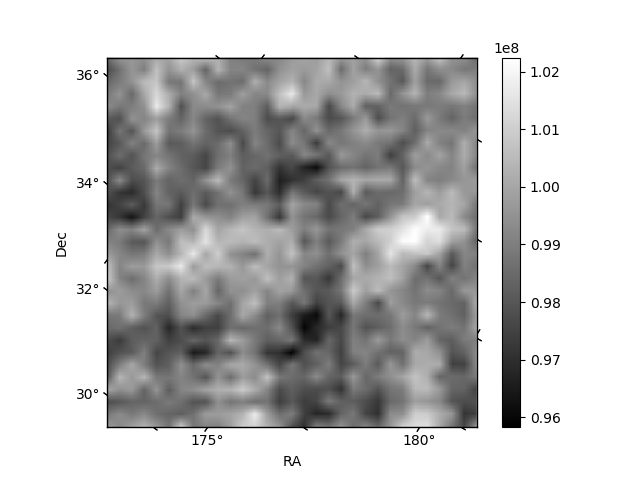
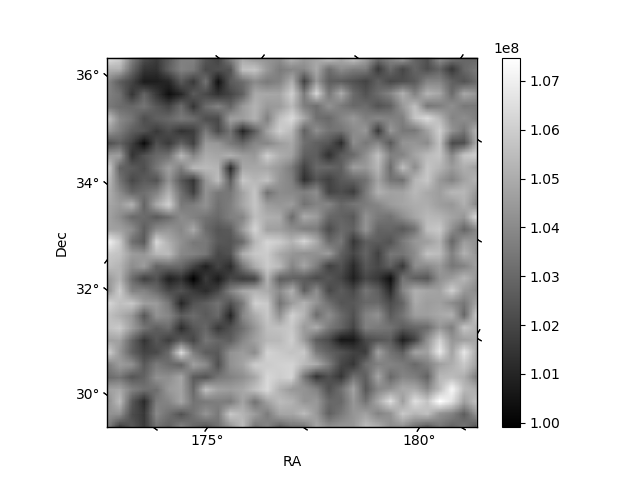
Histogram calculated using DETX and DETY for each event in the final _common_clean file
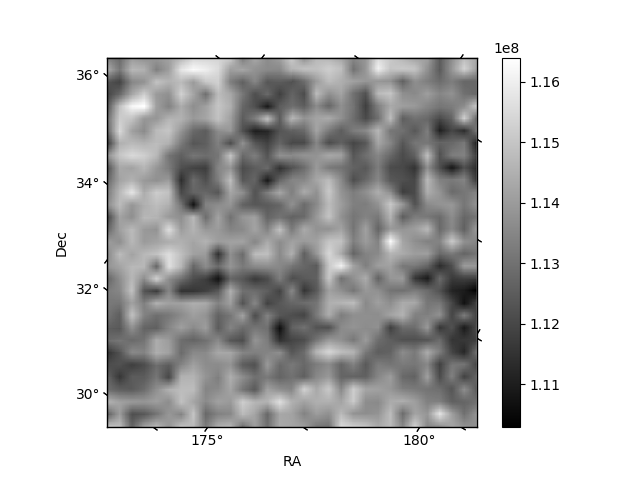
| Quadrant A |  |
 |
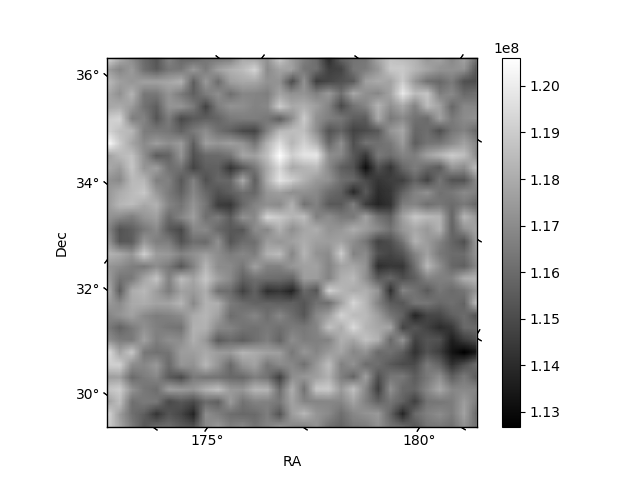
Quadrant B |
|---|---|---|---|
| Quadrant D |  |
 |
Quadrant C |
| Plot type | Count rate plots | Images |
|---|---|---|
| Comparison with Poisson distribution Blue bars denote a histogram of data divided into 1 sec bins. Red curve is a Poisson curve with rate = median count rate of data. |
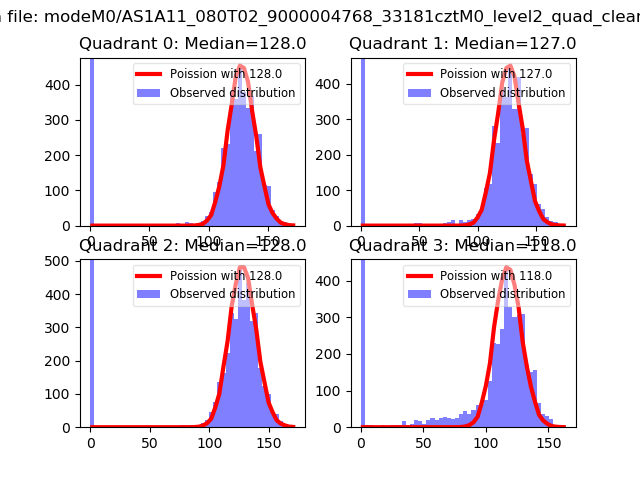 |
 |
| Quadrant-wise count rates Data is divided into 100 sec bins |
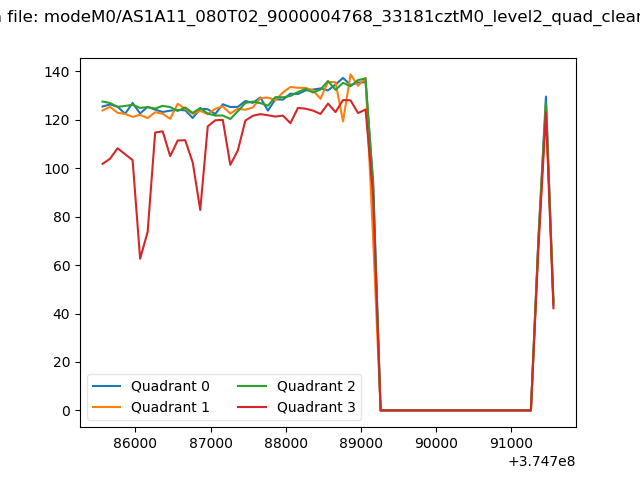 |
|
| Module-wise count rates for Quadrant A Data is divided into 100 sec bins |
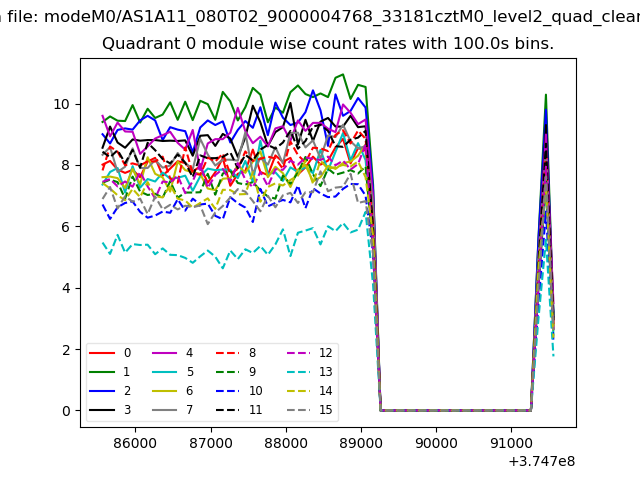 |
 |
| Module-wise count rates for Quadrant B Data is divided into 100 sec bins |
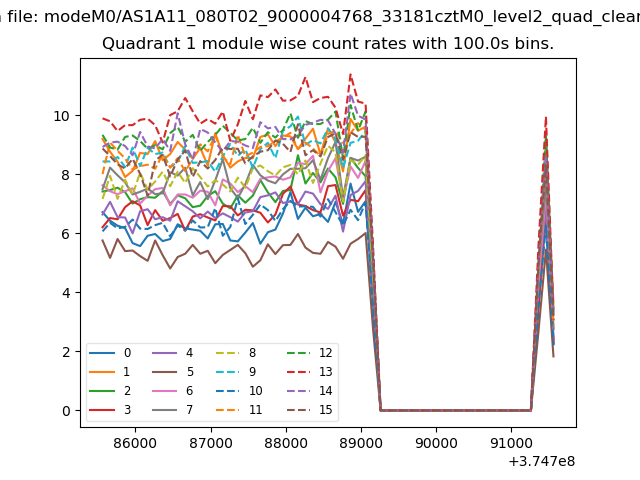 |
 |
| Module-wise count rates for Quadrant C Data is divided into 100 sec bins |
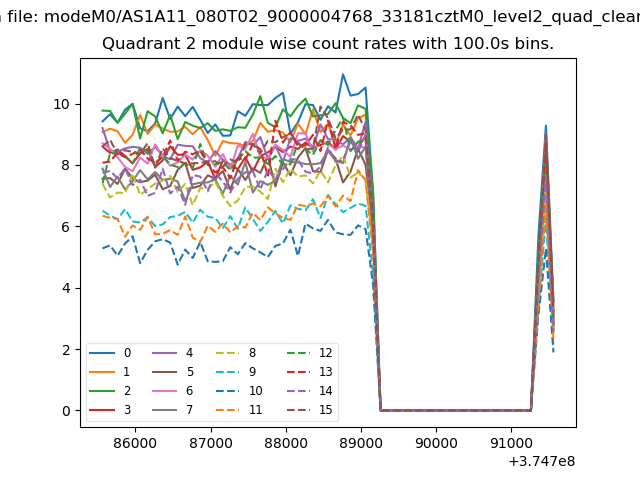 |
 |
| Module-wise count rates for Quadrant D Data is divided into 100 sec bins |
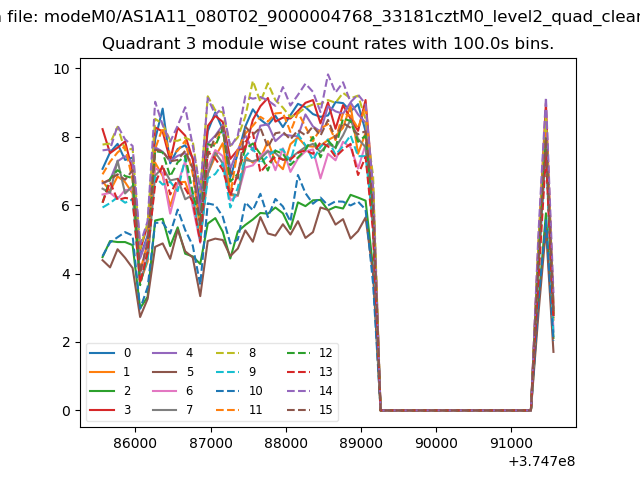 |
 |
| Parameter | Plot |
|---|---|
| CZT HV Monitor | 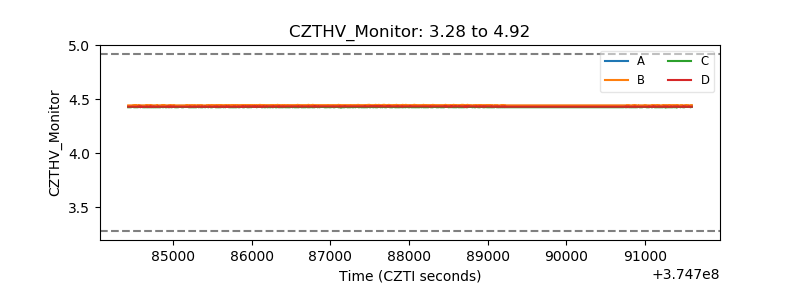 |
| D_VDD | 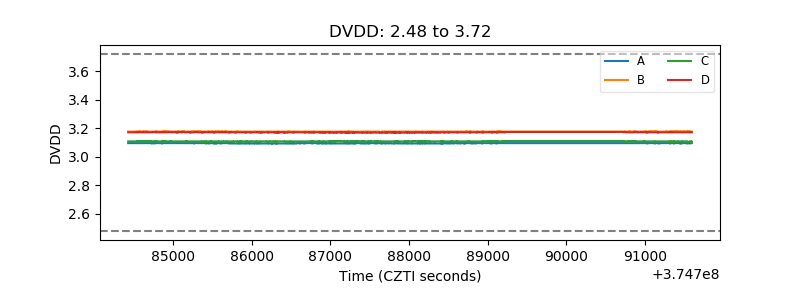 |
| Temperature 1 | 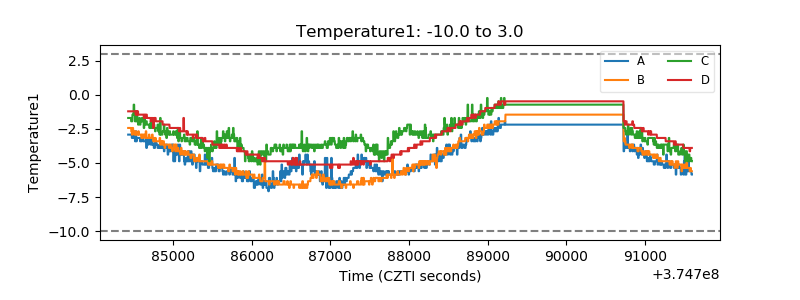 |
| Veto HV Monitor |  |
| Veto LLD | 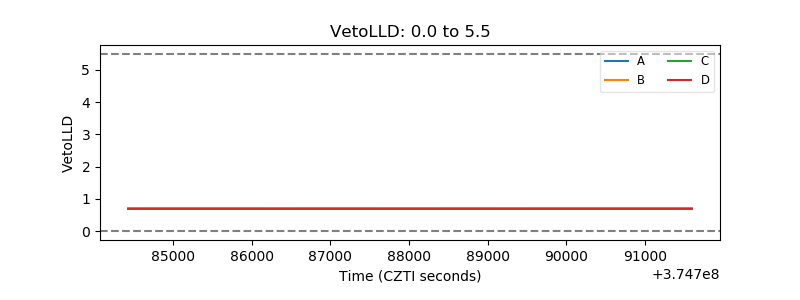 |
| Alpha Counter | 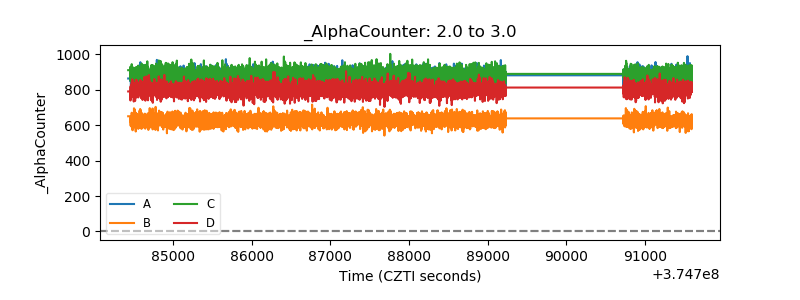 |
| _CPM_Rate | 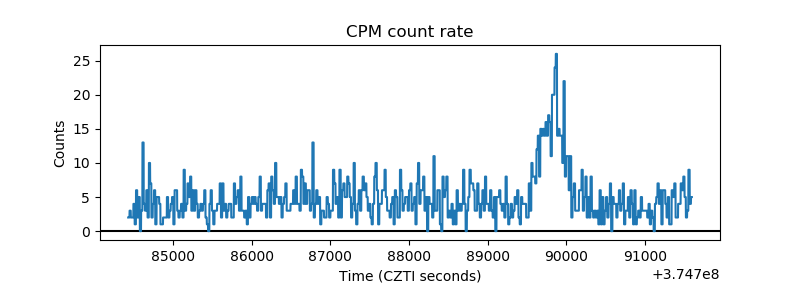 |
| CZT Counter | 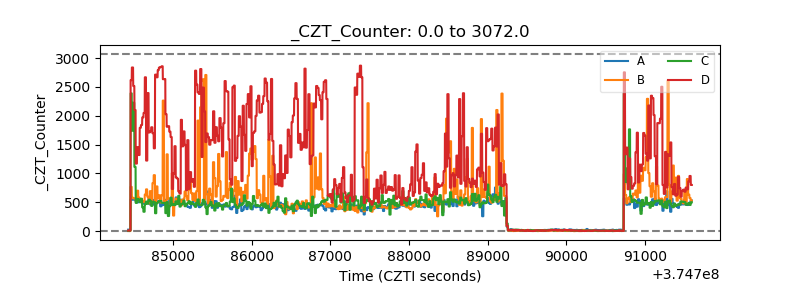 |
| +2.5 Volts monitor |  |
| +5 Volts monitor | 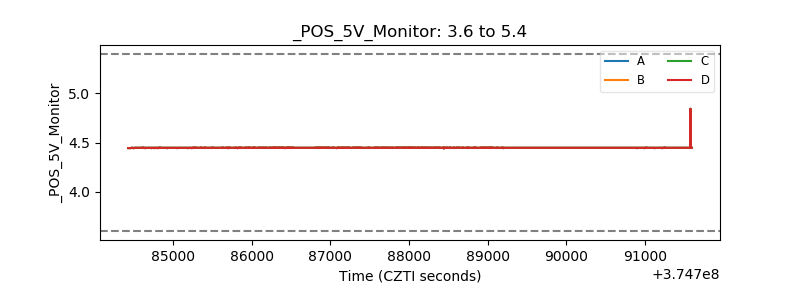 |
| _ROLL_ROT | 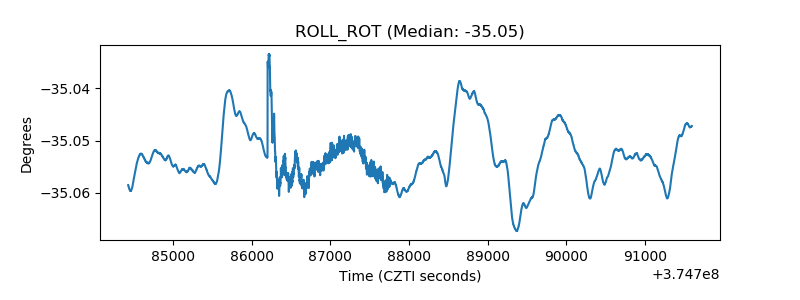 |
| _Roll_DEC | 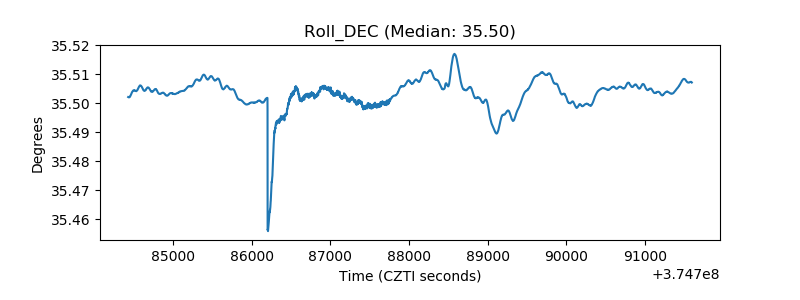 |
| _Roll_RA | 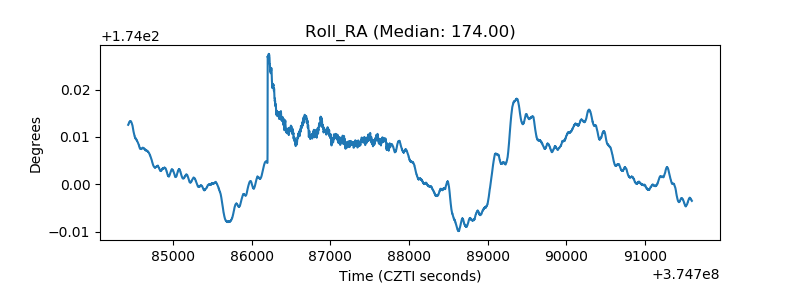 |
| Veto Counter | 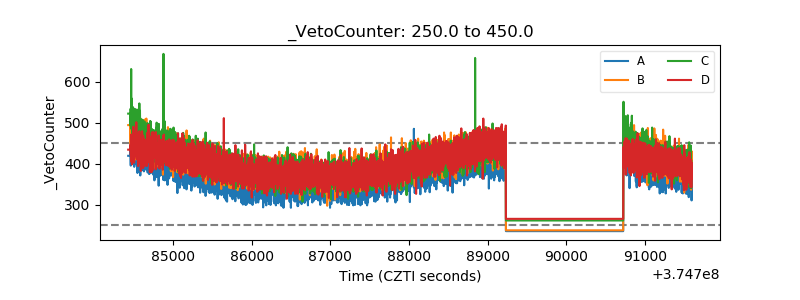 |