| Param | Original file | Final file |
|---|---|---|
| Filename | modeM0/AS1A11_080T02_9000004768_33182cztM0_level2.evt | modeM0/AS1A11_080T02_9000004768_33182cztM0_level2_quad_clean.evt |
| Size (bytes) | 510,583,680 | 85,311,360 |
| Size | 486.9 MB | 81.4 MB |
| Events in quadrant A | 2,699,715 | 554,425 |
| Events in quadrant B | 3,956,547 | 545,089 |
| Events in quadrant C | 2,868,059 | 554,764 |
| Events in quadrant D | 5,541,560 | 519,819 |
| Mode M9 | |||
|---|---|---|---|
| Quadrant | BADHDUFLAG | Total packets | Discarded packets |
| A | 0 | 26 | 0 |
| B | 0 | 26 | 0 |
| C | 0 | 26 | 0 |
| D | 0 | 27 | 0 |
| Mode SS | |||
|---|---|---|---|
| Quadrant | BADHDUFLAG | Total packets | Discarded packets |
| A | 0 | 118 | 0 |
| B | 0 | 118 | 0 |
| C | 0 | 118 | 0 |
| D | 0 | 118 | 0 |
| Mode M0 | |||
|---|---|---|---|
| Quadrant | BADHDUFLAG | Total packets | Discarded packets |
| A | 0 | 11960 | 2 |
| B | 0 | 15747 | 1 |
| C | 0 | 12442 | 1 |
| D | 0 | 20751 | 1 |
| Quadrant | Total seconds | Saturated seconds | Saturation percentage |
|---|---|---|---|
| A | 5860 | 10 | 0.170648% |
| B | 5860 | 349 | 5.955631% |
| C | 5860 | 59 | 1.006826% |
| D | 5860 | 363 | 6.194539% |
Noise dominated data is calculated using 1-second bins in cleaned event files. If a bin has >2000 counts, and if more than 50% of those come from <1% of pixels, then it is considered to be noise-dominated and hence unusable.
| Quadrant | # 1 sec bins | Bins with >0 counts | Bins with >2000 counts | High rate bins dominated by noise | Noise dominated (total time) | Noise dominated (detector-on time) | Marked lightcurve |
|---|---|---|---|---|---|---|---|
| A | 7172 | 5861 | 4 | 4 | 0.06% | 0.07% | 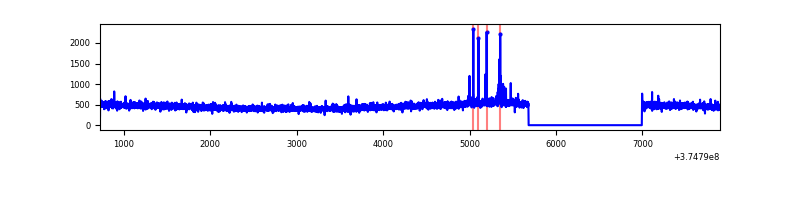 |
| B | 7172 | 5861 | 186 | 186 | 2.59% | 3.17% | 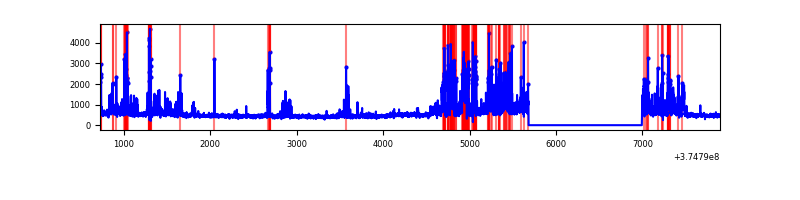 |
| C | 7172 | 5861 | 37 | 37 | 0.52% | 0.63% | 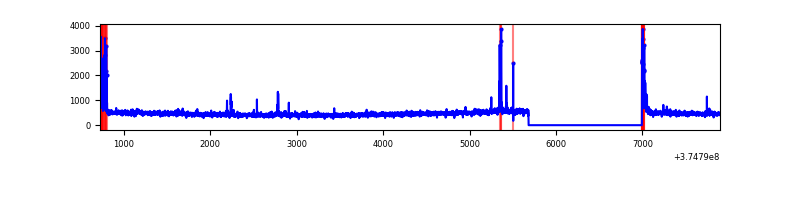 |
| D | 7172 | 5861 | 280 | 280 | 3.90% | 4.78% | 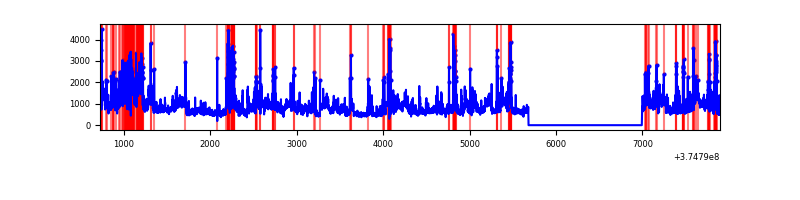 |
Top three noisy pixels from each quadrant. If the there are fewer than three noisy pixels in the level2.evt file, extra rows are filled as -1
| Pixel properties | Quadrant properties | ||||||
|---|---|---|---|---|---|---|---|
| Quadrant | DetID | PixID | Counts | Sigma | Mean | Median | Sigma |
| A | 14 | 254 | 37255 | 265.95 | 684 | 671 | 137.6 |
| A | 13 | 6 | 12598 | 86.71 | 684 | 671 | 137.6 |
| A | 13 | 254 | 10643 | 72.49 | 684 | 671 | 137.6 |
| B | 5 | 172 | 673957 | 5263.42 | 665 | 649 | 127.9 |
| B | 0 | 219 | 404963 | 3160.62 | 665 | 649 | 127.9 |
| B | 0 | 190 | 59509 | 460.12 | 665 | 649 | 127.9 |
| C | 0 | 10 | 166303 | 1078.64 | 662 | 668 | 153.6 |
| C | 14 | 67 | 33795 | 215.73 | 662 | 668 | 153.6 |
| C | 1 | 23 | 33529 | 214.0 | 662 | 668 | 153.6 |
| D | 8 | 195 | 1498931 | 9113.59 | 646 | 632 | 164.4 |
| D | 12 | 218 | 397610 | 2414.67 | 646 | 632 | 164.4 |
| D | 12 | 6 | 247685 | 1502.73 | 646 | 632 | 164.4 |
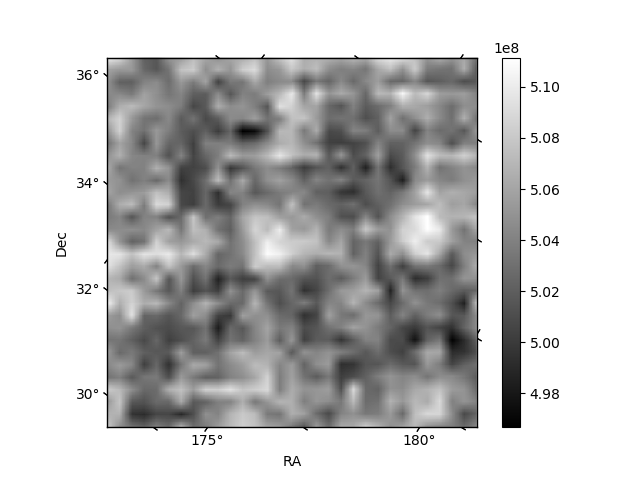
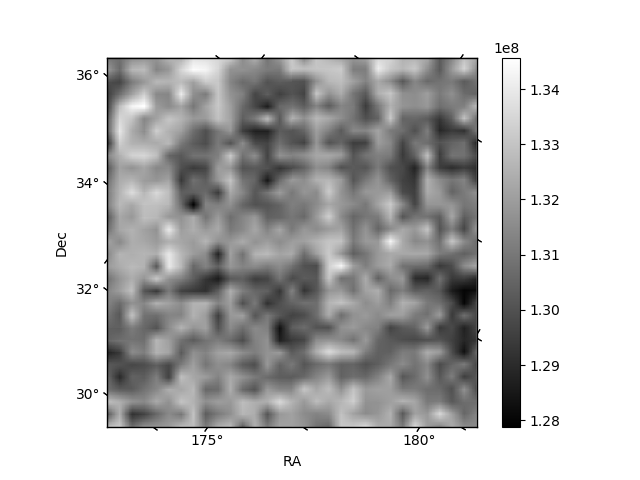
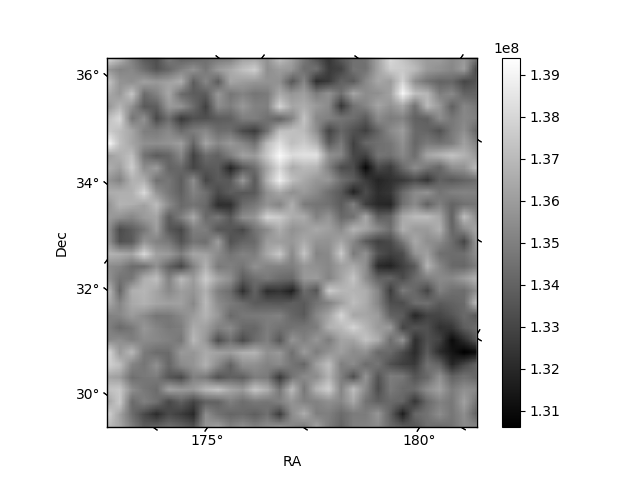
Histogram calculated using DETX and DETY for each event in the final _common_clean file
| Quadrant A | 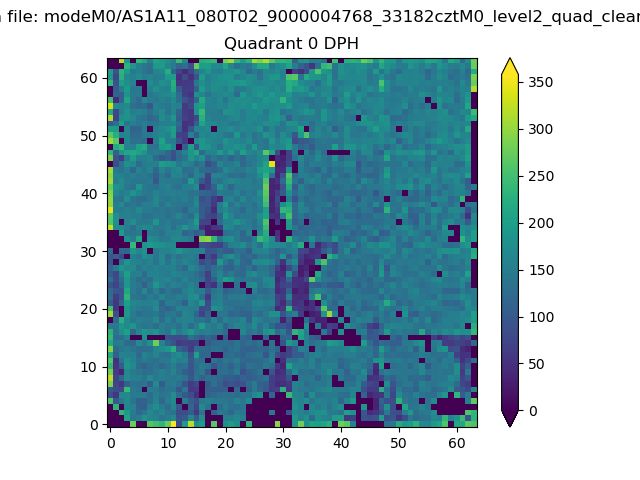 |
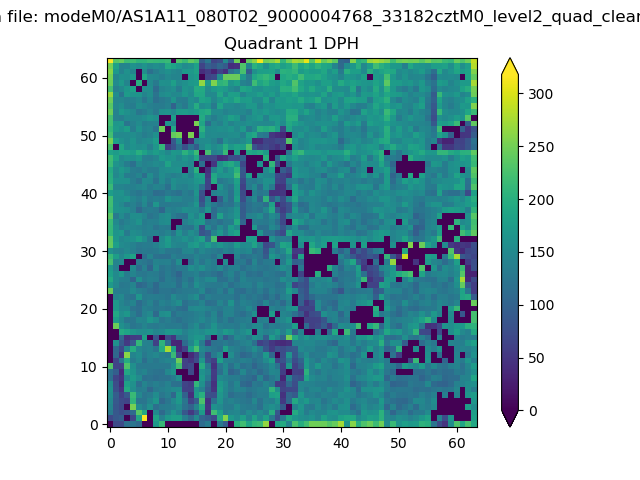 |
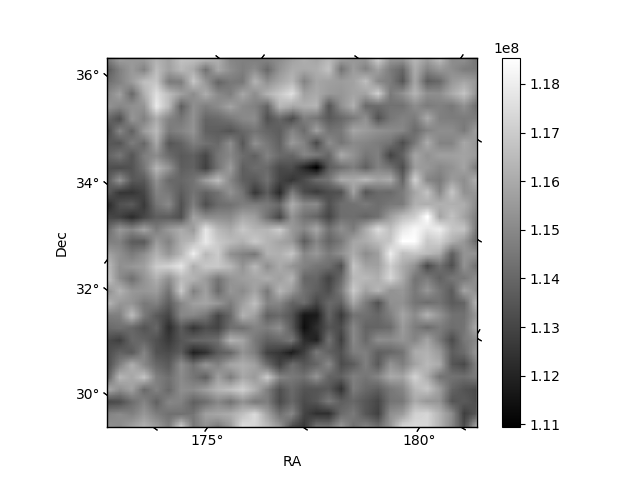
Quadrant B |
|---|---|---|---|
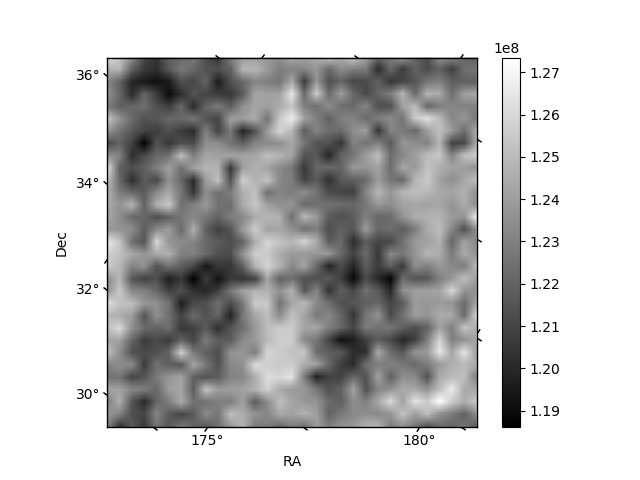
| Quadrant D |  |
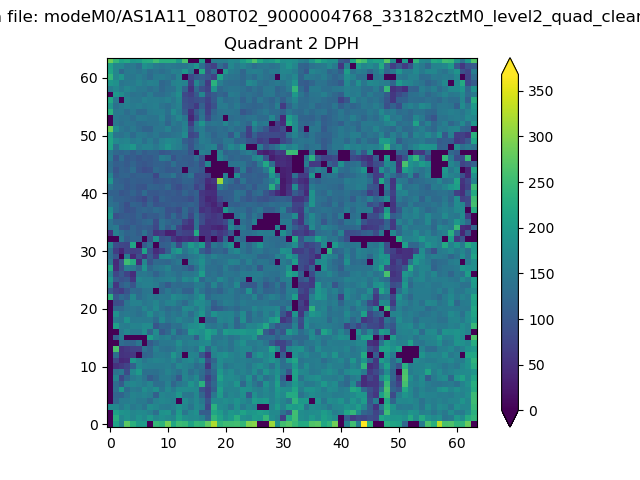 |
Quadrant C |
| Plot type | Count rate plots | Images |
|---|---|---|
| Comparison with Poisson distribution Blue bars denote a histogram of data divided into 1 sec bins. Red curve is a Poisson curve with rate = median count rate of data. |
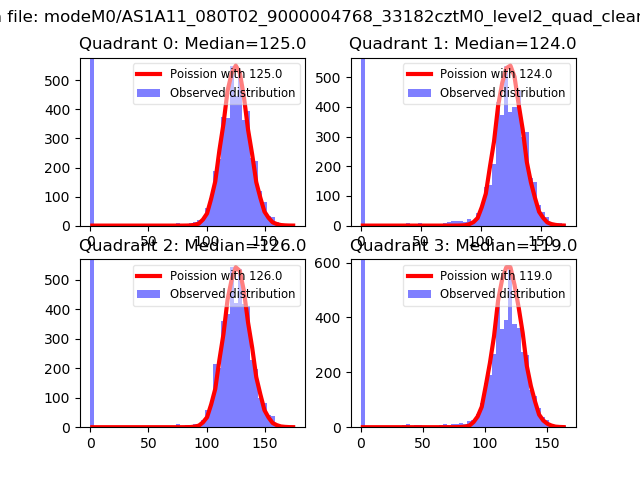 |
 |
| Quadrant-wise count rates Data is divided into 100 sec bins |
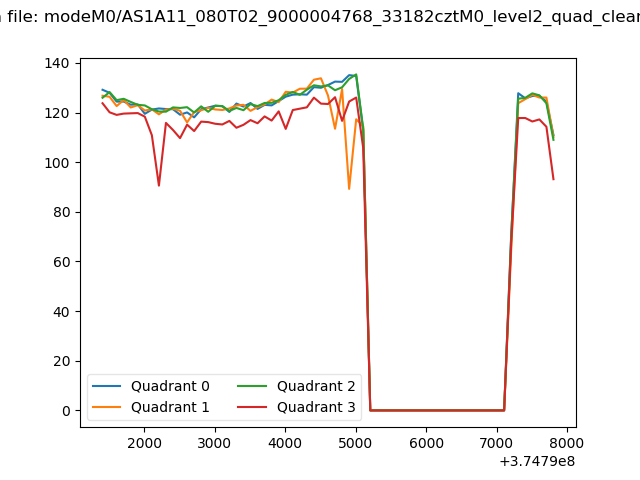 |
|
| Module-wise count rates for Quadrant A Data is divided into 100 sec bins |
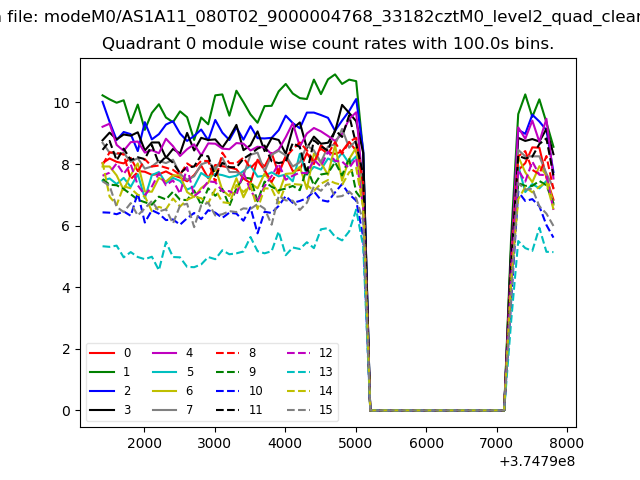 |
 |
| Module-wise count rates for Quadrant B Data is divided into 100 sec bins |
 |
 |
| Module-wise count rates for Quadrant C Data is divided into 100 sec bins |
 |
 |
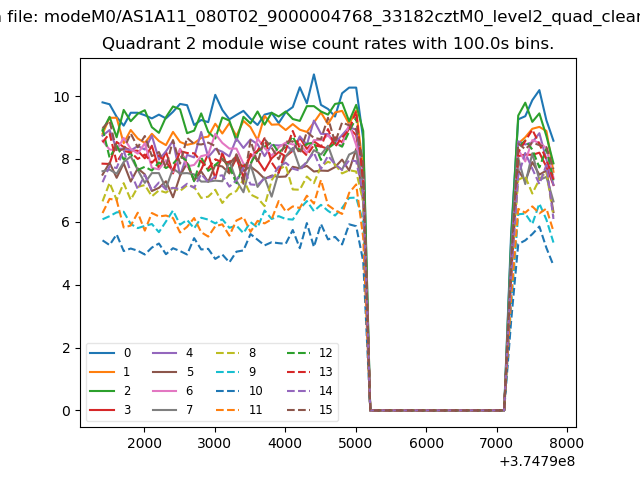
| Module-wise count rates for Quadrant D Data is divided into 100 sec bins |
 |
 |
| Parameter | Plot |
|---|---|
| CZT HV Monitor | 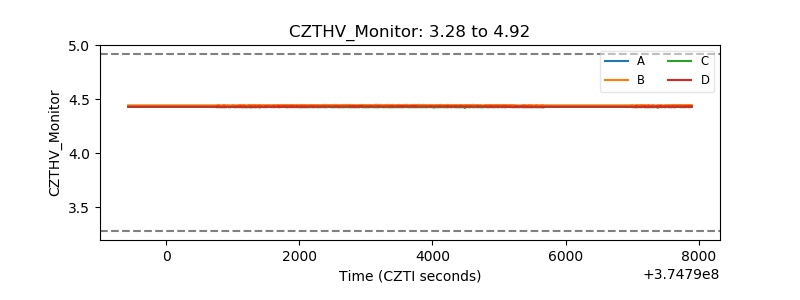 |
| D_VDD | 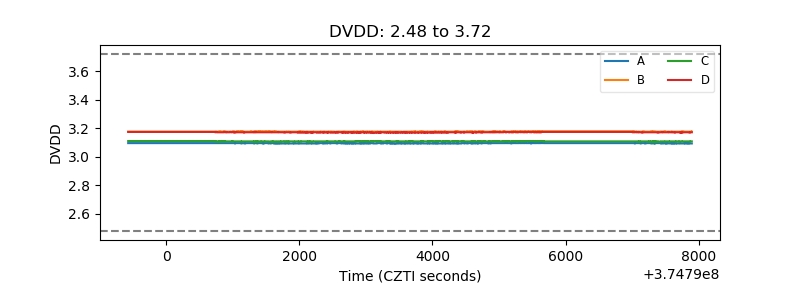 |
| Temperature 1 | 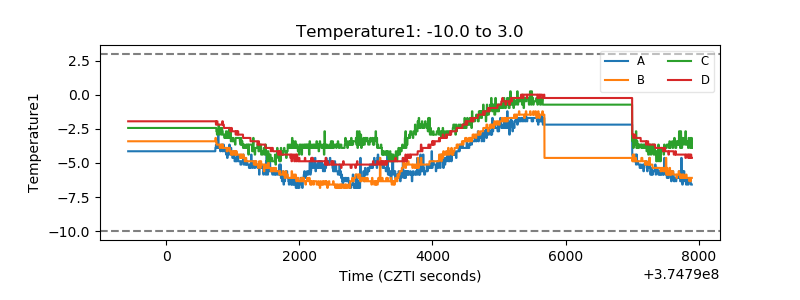 |
| Veto HV Monitor | 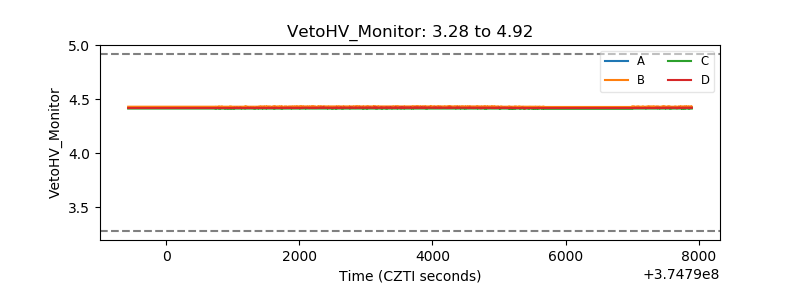 |
| Veto LLD |  |
| Alpha Counter | 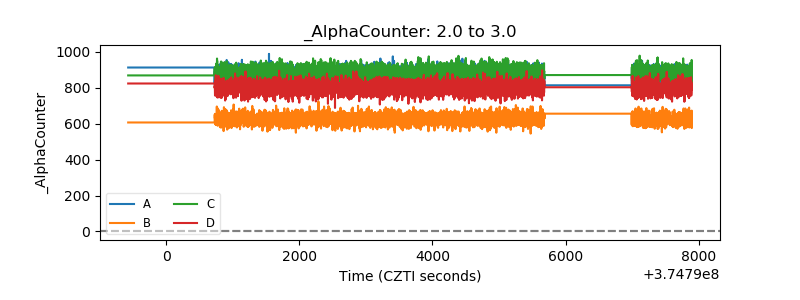 |
| _CPM_Rate | 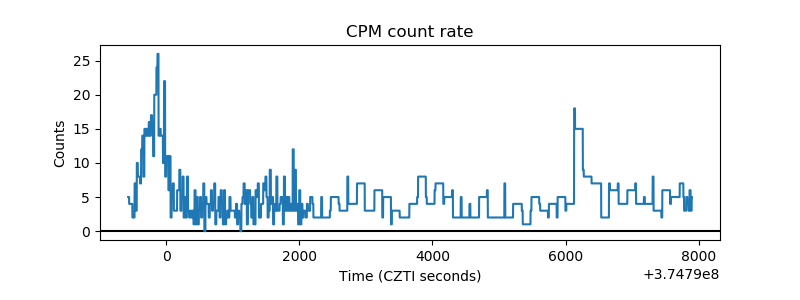 |
| CZT Counter | 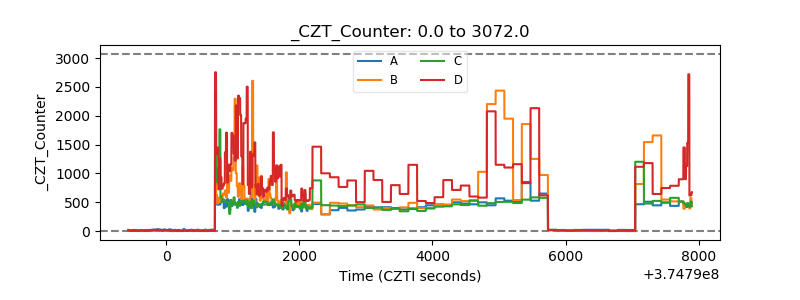 |
| +2.5 Volts monitor |  |
| +5 Volts monitor |  |
| _ROLL_ROT | 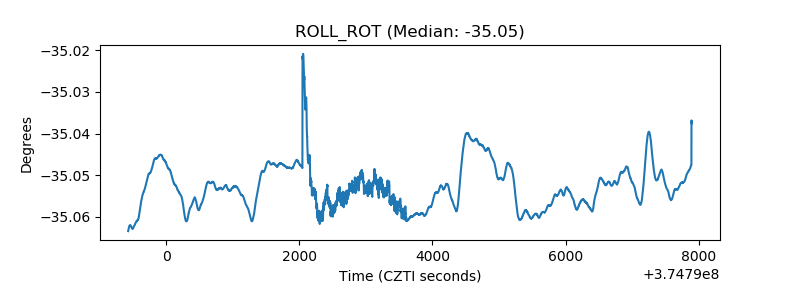 |
| _Roll_DEC | 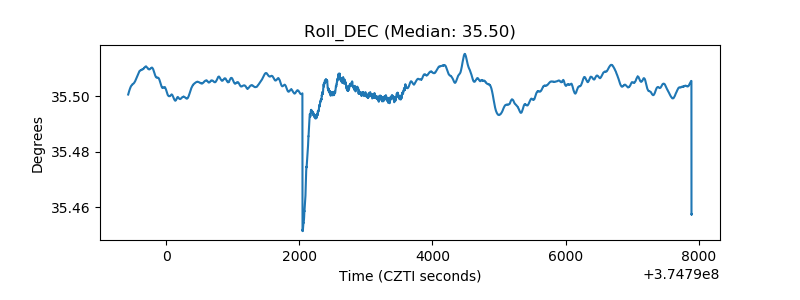 |
| _Roll_RA | 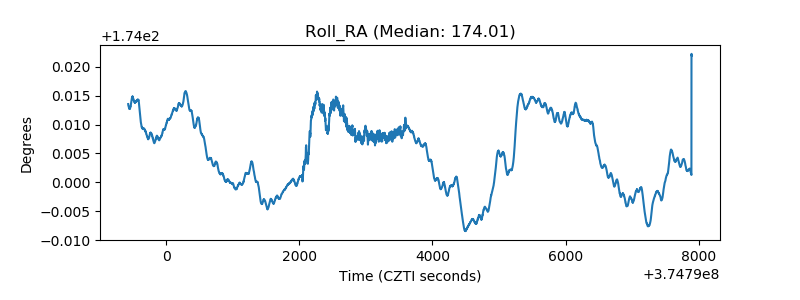 |
| Veto Counter | 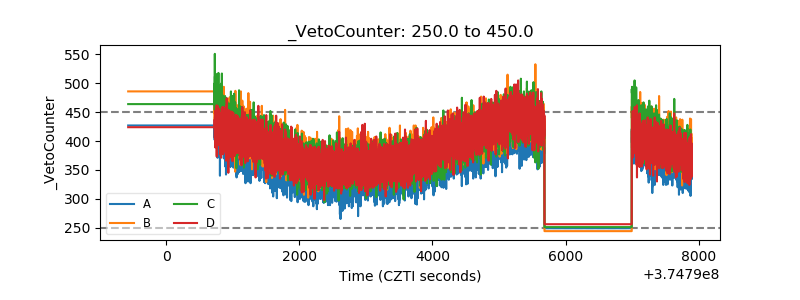 |