| Param | Original file | Final file |
|---|---|---|
| Filename | modeM0/AS1A11_080T02_9000004768_33183cztM0_level2.evt | modeM0/AS1A11_080T02_9000004768_33183cztM0_level2_quad_clean.evt |
| Size (bytes) | 537,531,840 | 90,938,880 |
| Size | 512.6 MB | 86.7 MB |
| Events in quadrant A | 2,730,499 | 595,091 |
| Events in quadrant B | 3,948,942 | 590,320 |
| Events in quadrant C | 2,922,550 | 594,419 |
| Events in quadrant D | 6,268,545 | 552,535 |
| Mode M9 | |||
|---|---|---|---|
| Quadrant | BADHDUFLAG | Total packets | Discarded packets |
| A | 0 | 20 | 0 |
| B | 0 | 20 | 0 |
| C | 0 | 20 | 0 |
| D | 0 | 21 | 0 |
| Mode SS | |||
|---|---|---|---|
| Quadrant | BADHDUFLAG | Total packets | Discarded packets |
| A | 0 | 122 | 0 |
| B | 0 | 122 | 0 |
| C | 0 | 122 | 0 |
| D | 0 | 122 | 0 |
| Mode M0 | |||
|---|---|---|---|
| Quadrant | BADHDUFLAG | Total packets | Discarded packets |
| A | 0 | 12232 | 15 |
| B | 0 | 15816 | 15 |
| C | 0 | 12732 | 14 |
| D | 0 | 23113 | 19 |
| Quadrant | Total seconds | Saturated seconds | Saturation percentage |
|---|---|---|---|
| A | 6035 | 8 | 0.132560% |
| B | 6035 | 274 | 4.540182% |
| C | 6035 | 48 | 0.795360% |
| D | 6036 | 373 | 6.179589% |
Noise dominated data is calculated using 1-second bins in cleaned event files. If a bin has >2000 counts, and if more than 50% of those come from <1% of pixels, then it is considered to be noise-dominated and hence unusable.
| Quadrant | # 1 sec bins | Bins with >0 counts | Bins with >2000 counts | High rate bins dominated by noise | Noise dominated (total time) | Noise dominated (detector-on time) | Marked lightcurve |
|---|---|---|---|---|---|---|---|
| A | 7324 | 6042 | 0 | 0 | 0.00% | 0.00% | 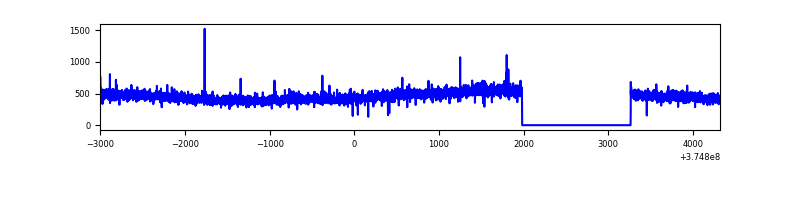 |
| B | 7324 | 6042 | 146 | 146 | 1.99% | 2.42% | 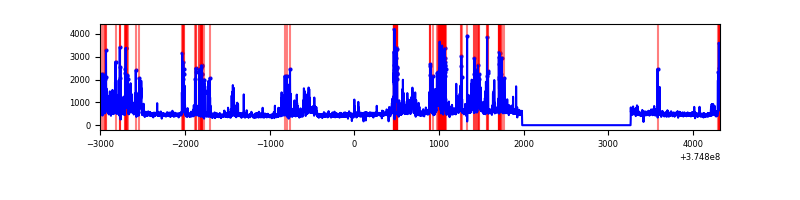 |
| C | 7324 | 6042 | 32 | 32 | 0.44% | 0.53% | 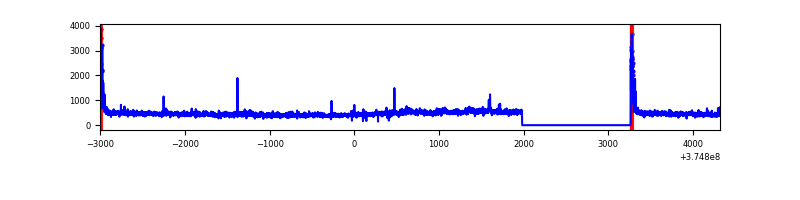 |
| D | 7324 | 6042 | 268 | 268 | 3.66% | 4.44% | 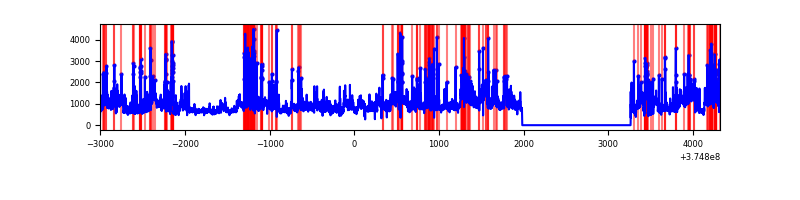 |
Top three noisy pixels from each quadrant. If the there are fewer than three noisy pixels in the level2.evt file, extra rows are filled as -1
| Pixel properties | Quadrant properties | ||||||
|---|---|---|---|---|---|---|---|
| Quadrant | DetID | PixID | Counts | Sigma | Mean | Median | Sigma |
| A | 13 | 6 | 19985 | 136.85 | 699 | 684 | 141.0 |
| A | 13 | 254 | 11200 | 74.56 | 699 | 684 | 141.0 |
| A | 3 | 137 | 6707 | 42.7 | 699 | 684 | 141.0 |
| B | 5 | 172 | 573970 | 4342.24 | 688 | 671 | 132.0 |
| B | 0 | 219 | 391729 | 2961.92 | 688 | 671 | 132.0 |
| B | 5 | 200 | 114178 | 859.72 | 688 | 671 | 132.0 |
| C | 0 | 10 | 146575 | 928.94 | 674 | 679 | 157.1 |
| C | 14 | 67 | 89290 | 564.2 | 674 | 679 | 157.1 |
| C | 6 | 11 | 19225 | 118.08 | 674 | 679 | 157.1 |
| D | 8 | 195 | 1442426 | 8417.68 | 658 | 643 | 171.3 |
| D | 10 | 203 | 865095 | 5047.0 | 658 | 643 | 171.3 |
| D | 12 | 218 | 674894 | 3936.53 | 658 | 643 | 171.3 |
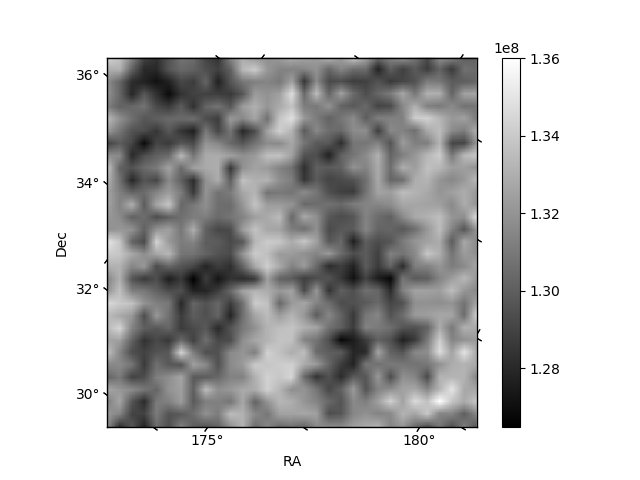
Histogram calculated using DETX and DETY for each event in the final _common_clean file
| Quadrant A |  |
 |
Quadrant B |
|---|---|---|---|
| Quadrant D |  |
 |
Quadrant C |
| Plot type | Count rate plots | Images |
|---|---|---|
| Comparison with Poisson distribution Blue bars denote a histogram of data divided into 1 sec bins. Red curve is a Poisson curve with rate = median count rate of data. |
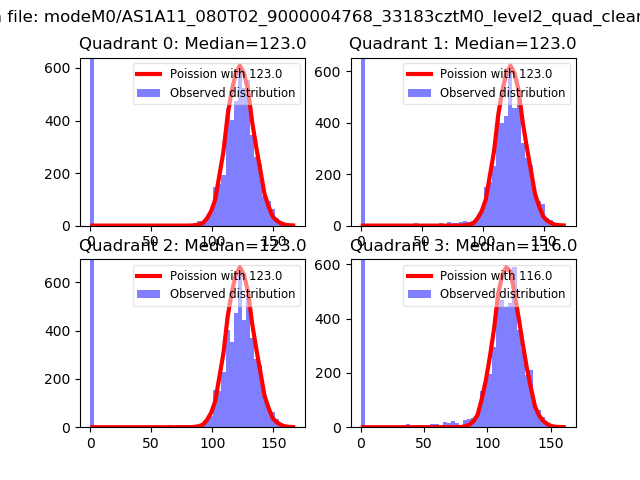 |
 |
| Quadrant-wise count rates Data is divided into 100 sec bins |
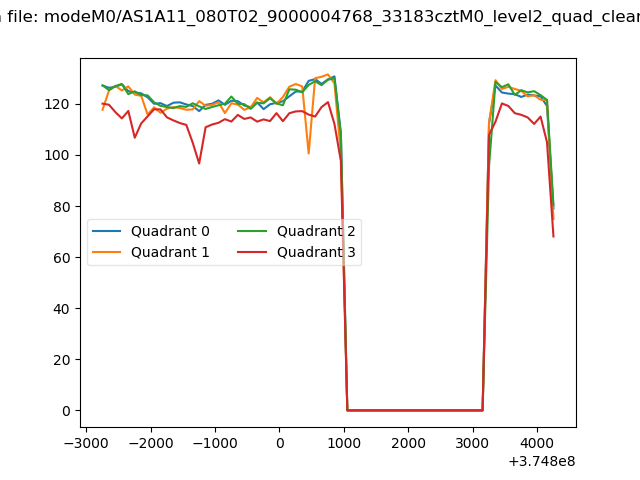 |
|
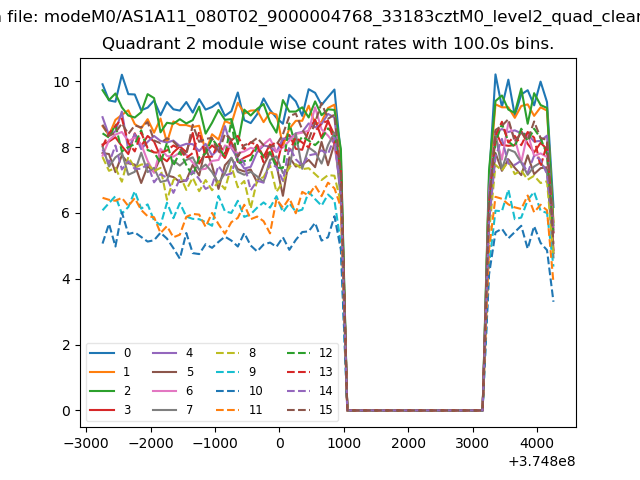
| Module-wise count rates for Quadrant A Data is divided into 100 sec bins |
 |
 |
| Module-wise count rates for Quadrant B Data is divided into 100 sec bins |
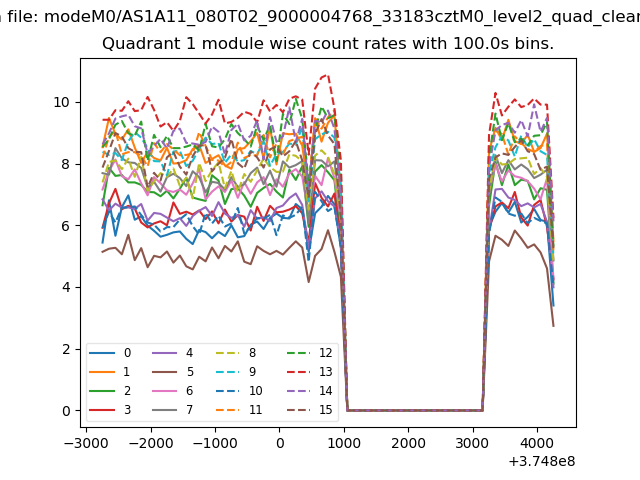 |
 |
| Module-wise count rates for Quadrant C Data is divided into 100 sec bins |
 |
 |
| Module-wise count rates for Quadrant D Data is divided into 100 sec bins |
 |
 |
| Parameter | Plot |
|---|---|
| CZT HV Monitor | 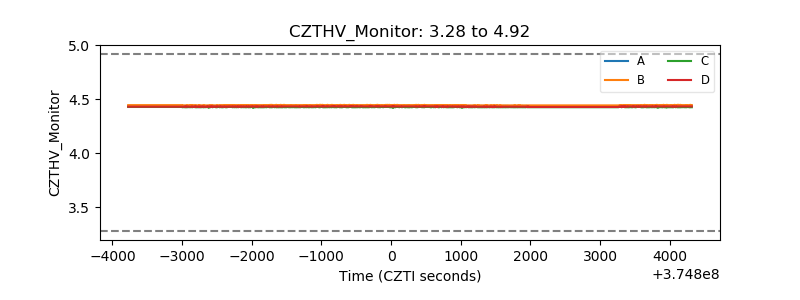 |
| D_VDD |  |
| Temperature 1 |  |
| Veto HV Monitor |  |
| Veto LLD |  |
| Alpha Counter | 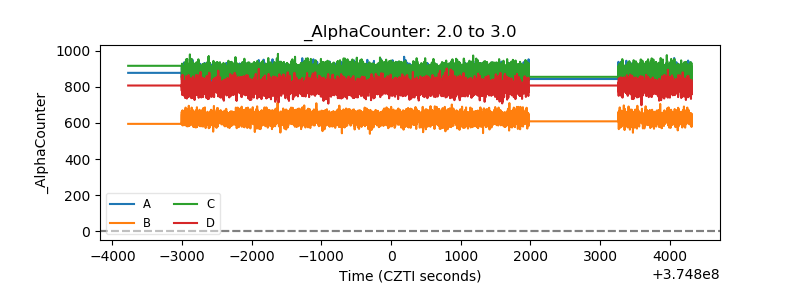 |
| _CPM_Rate | 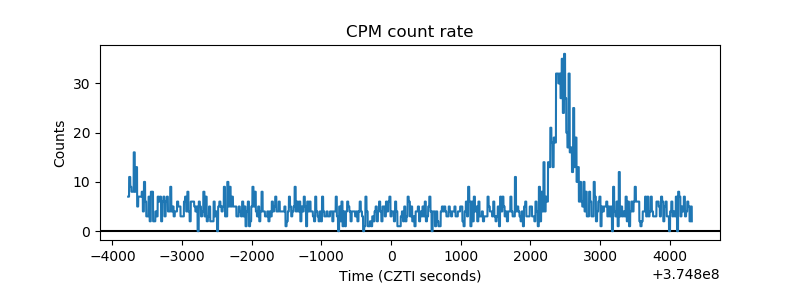 |
| CZT Counter |  |
| +2.5 Volts monitor |  |
| +5 Volts monitor |  |
| _ROLL_ROT |  |
| _Roll_DEC |  |
| _Roll_RA |  |
| Veto Counter |  |