| Param | Original file | Final file |
|---|---|---|
| Filename | modeM0/AS1A11_080T02_9000004768_33186cztM0_level2.evt | modeM0/AS1A11_080T02_9000004768_33186cztM0_level2_quad_clean.evt |
| Size (bytes) | 514,609,920 | 73,019,520 |
| Size | 490.8 MB | 69.6 MB |
| Events in quadrant A | 2,565,871 | 462,557 |
| Events in quadrant B | 4,870,278 | 463,861 |
| Events in quadrant C | 2,780,176 | 456,438 |
| Events in quadrant D | 4,981,632 | 428,970 |
| Mode M9 | |||
|---|---|---|---|
| Quadrant | BADHDUFLAG | Total packets | Discarded packets |
| A | 0 | 24 | 0 |
| B | 0 | 24 | 0 |
| C | 0 | 24 | 0 |
| D | 0 | 25 | 0 |
| Mode SS | |||
|---|---|---|---|
| Quadrant | BADHDUFLAG | Total packets | Discarded packets |
| A | 0 | 116 | 0 |
| B | 0 | 116 | 0 |
| C | 0 | 116 | 0 |
| D | 0 | 116 | 0 |
| Mode M0 | |||
|---|---|---|---|
| Quadrant | BADHDUFLAG | Total packets | Discarded packets |
| A | 0 | 11492 | 3 |
| B | 0 | 18378 | 2 |
| C | 0 | 12069 | 2 |
| D | 0 | 18867 | 2 |
| Quadrant | Total seconds | Saturated seconds | Saturation percentage |
|---|---|---|---|
| A | 5708 | 5 | 0.087596% |
| B | 5708 | 774 | 13.559916% |
| C | 5708 | 44 | 0.770848% |
| D | 5708 | 233 | 4.081990% |
Noise dominated data is calculated using 1-second bins in cleaned event files. If a bin has >2000 counts, and if more than 50% of those come from <1% of pixels, then it is considered to be noise-dominated and hence unusable.
| Quadrant | # 1 sec bins | Bins with >0 counts | Bins with >2000 counts | High rate bins dominated by noise | Noise dominated (total time) | Noise dominated (detector-on time) | Marked lightcurve |
|---|---|---|---|---|---|---|---|
| A | 7261 | 5709 | 0 | 0 | 0.00% | 0.00% | 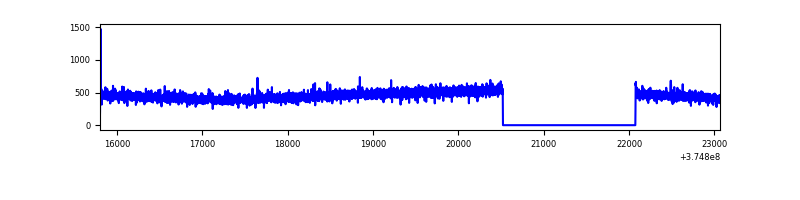 |
| B | 7261 | 5709 | 450 | 450 | 6.20% | 7.88% | 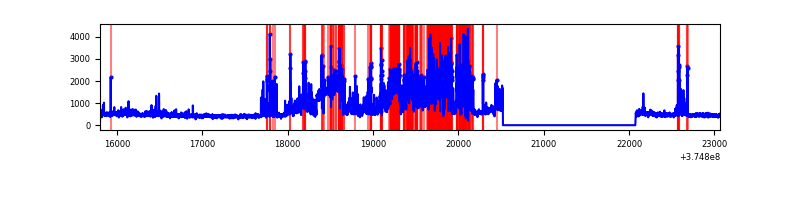 |
| C | 7261 | 5709 | 25 | 25 | 0.34% | 0.44% | 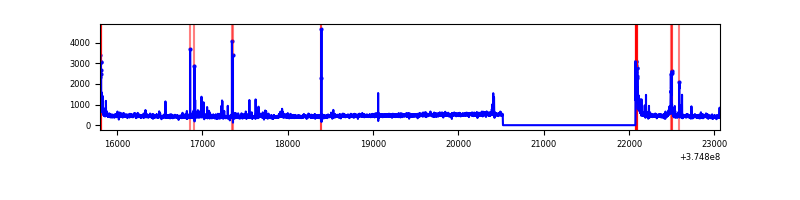 |
| D | 7261 | 5709 | 174 | 174 | 2.40% | 3.05% | 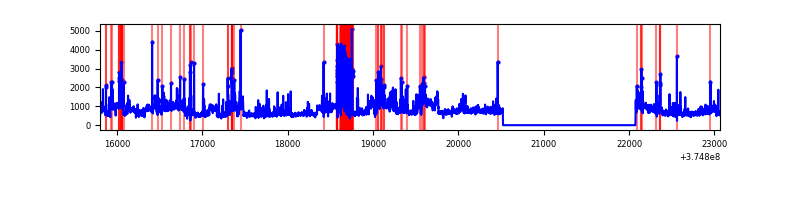 |
Top three noisy pixels from each quadrant. If the there are fewer than three noisy pixels in the level2.evt file, extra rows are filled as -1
| Pixel properties | Quadrant properties | ||||||
|---|---|---|---|---|---|---|---|
| Quadrant | DetID | PixID | Counts | Sigma | Mean | Median | Sigma |
| A | 13 | 6 | 11162 | 79.46 | 658 | 645 | 132.4 |
| A | 13 | 254 | 10351 | 73.33 | 658 | 645 | 132.4 |
| A | 3 | 137 | 6225 | 42.16 | 658 | 645 | 132.4 |
| B | 5 | 172 | 1424943 | 12046.71 | 621 | 607 | 118.2 |
| B | 0 | 219 | 586530 | 4955.6 | 621 | 607 | 118.2 |
| B | 5 | 200 | 296001 | 2498.38 | 621 | 607 | 118.2 |
| C | 0 | 10 | 123955 | 833.98 | 634 | 638 | 147.9 |
| C | 9 | 187 | 60086 | 402.04 | 634 | 638 | 147.9 |
| C | 3 | 233 | 50649 | 338.22 | 634 | 638 | 147.9 |
| D | 8 | 195 | 1255126 | 7483.78 | 620 | 605 | 167.6 |
| D | 7 | 223 | 543699 | 3239.8 | 620 | 605 | 167.6 |
| D | 10 | 203 | 311420 | 1854.15 | 620 | 605 | 167.6 |
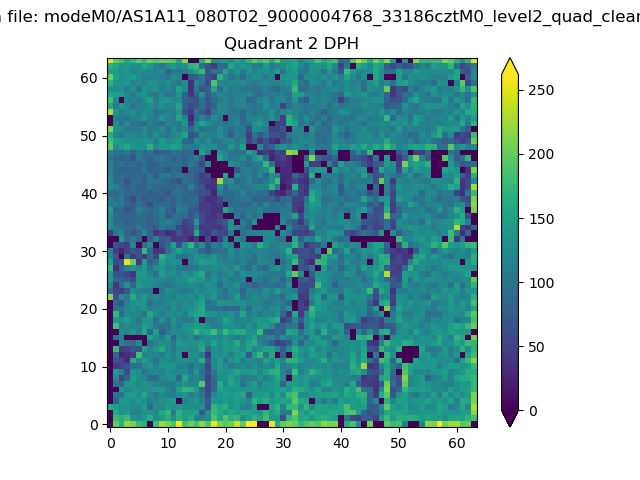
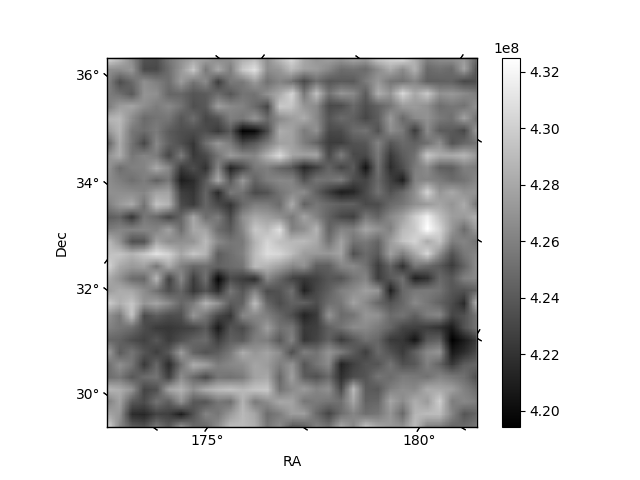
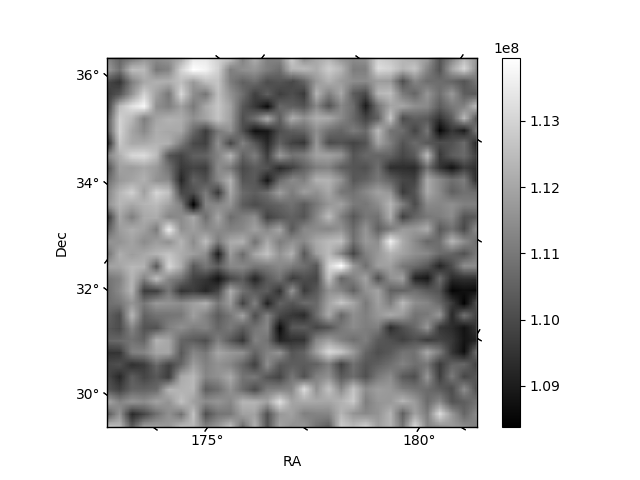
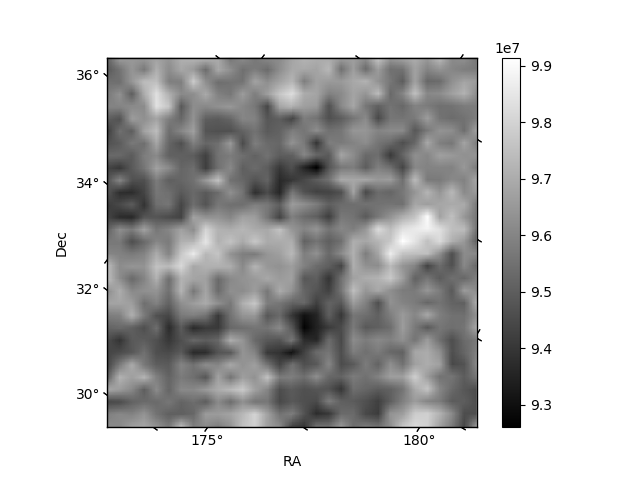
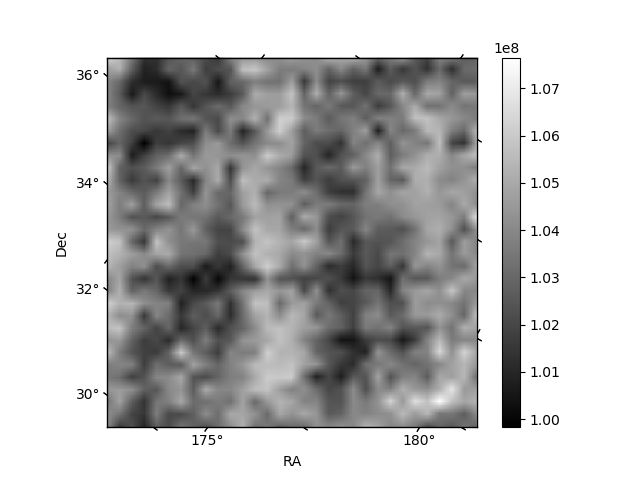
Histogram calculated using DETX and DETY for each event in the final _common_clean file
| Quadrant A | 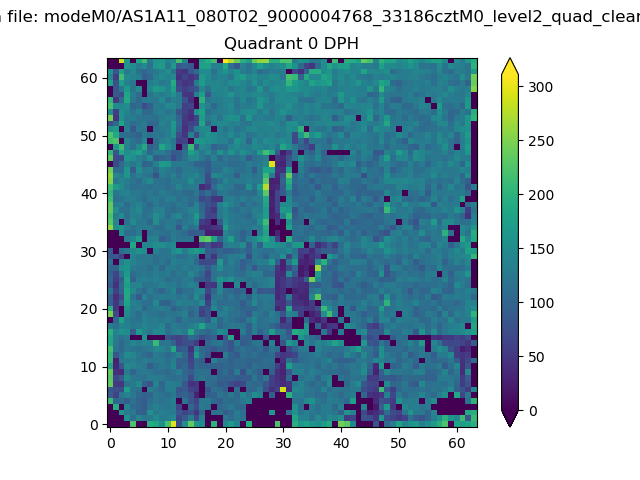 |
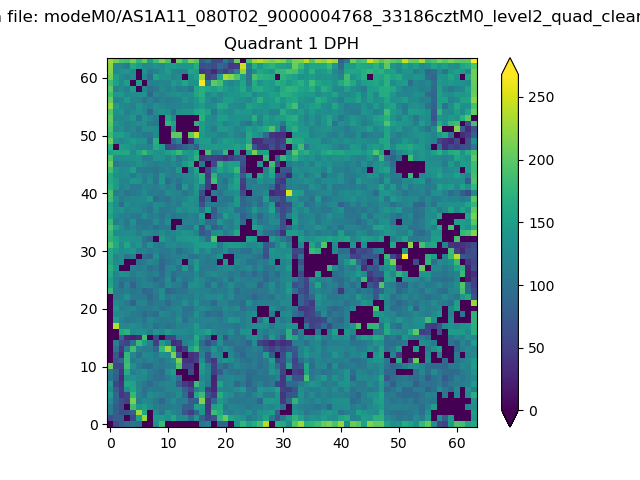 |
Quadrant B |
|---|---|---|---|
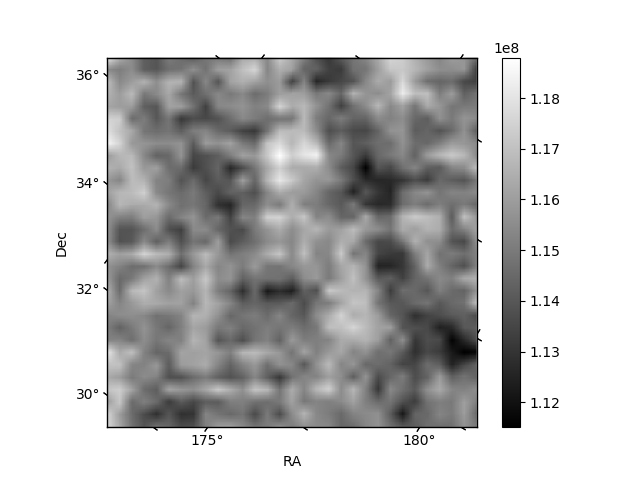
| Quadrant D | 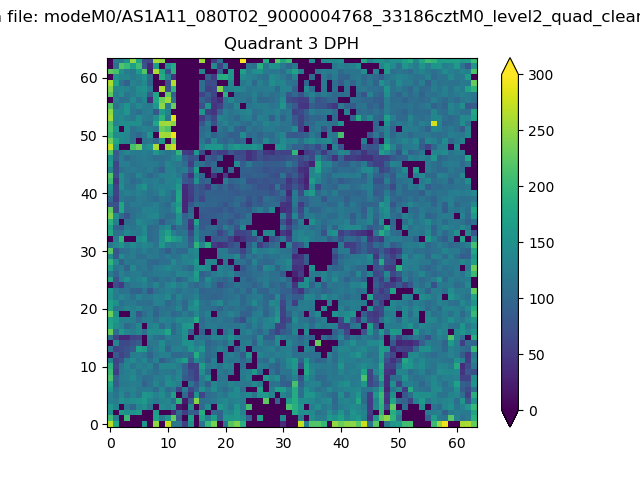 |
 |
Quadrant C |
| Plot type | Count rate plots | Images |
|---|---|---|
| Comparison with Poisson distribution Blue bars denote a histogram of data divided into 1 sec bins. Red curve is a Poisson curve with rate = median count rate of data. |
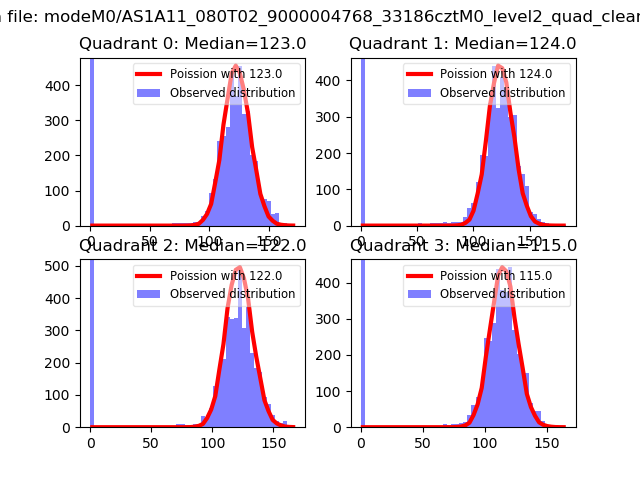 |
 |
| Quadrant-wise count rates Data is divided into 100 sec bins |
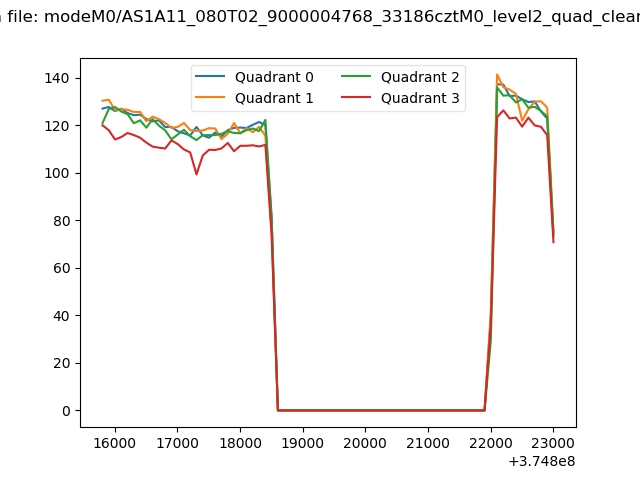 |
|
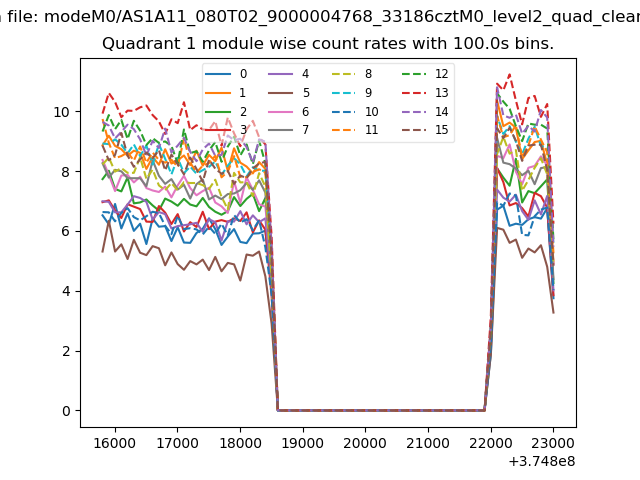
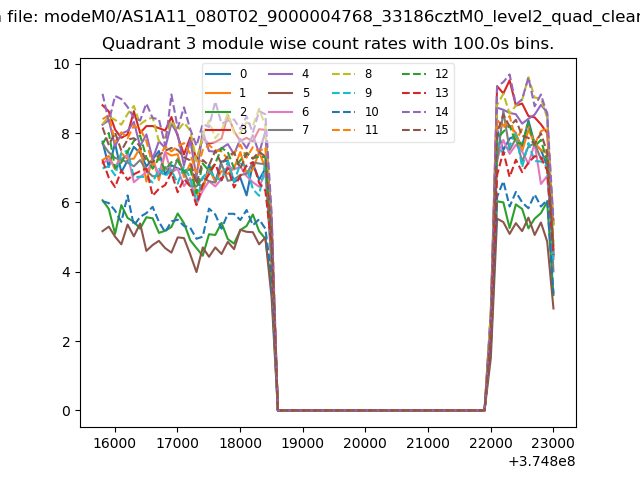
| Module-wise count rates for Quadrant A Data is divided into 100 sec bins |
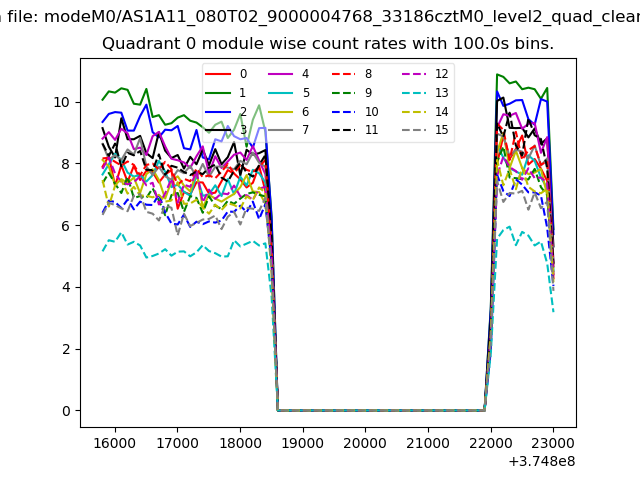 |
 |
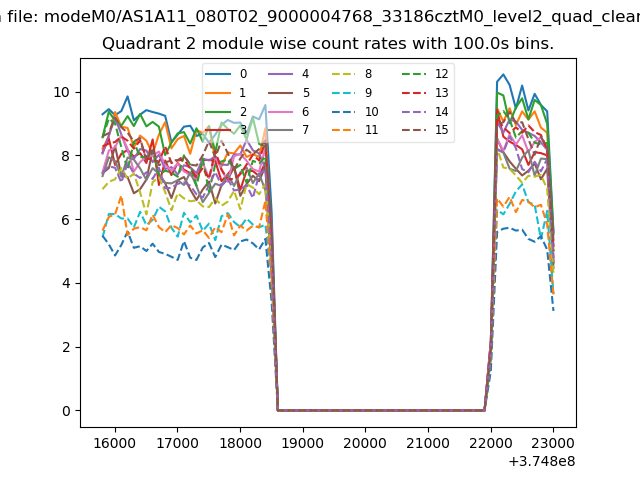
| Module-wise count rates for Quadrant B Data is divided into 100 sec bins |
 |
 |
| Module-wise count rates for Quadrant C Data is divided into 100 sec bins |
 |
 |
| Module-wise count rates for Quadrant D Data is divided into 100 sec bins |
 |
 |
| Parameter | Plot |
|---|---|
| CZT HV Monitor | 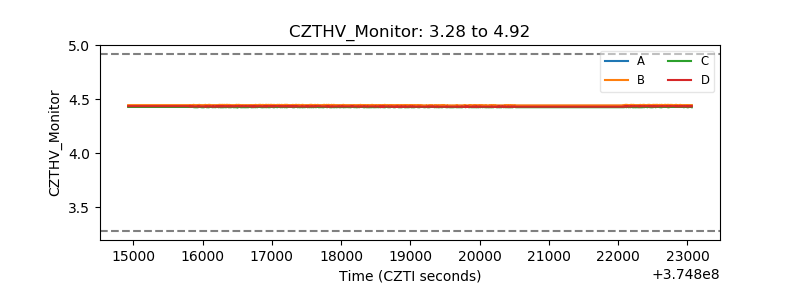 |
| D_VDD | 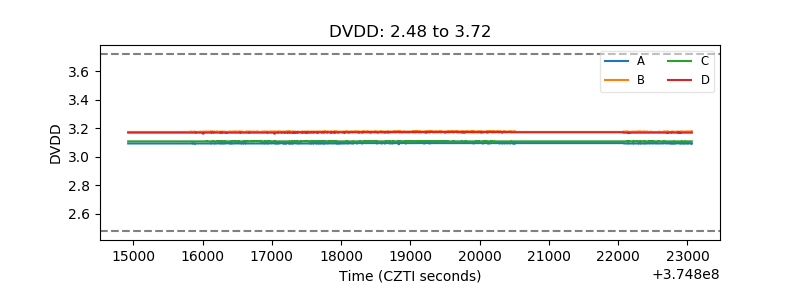 |
| Temperature 1 | 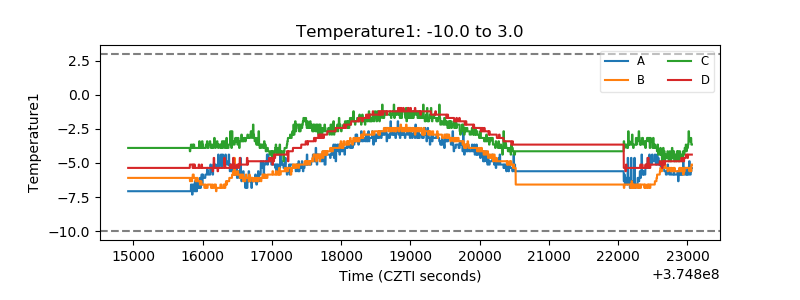 |
| Veto HV Monitor | 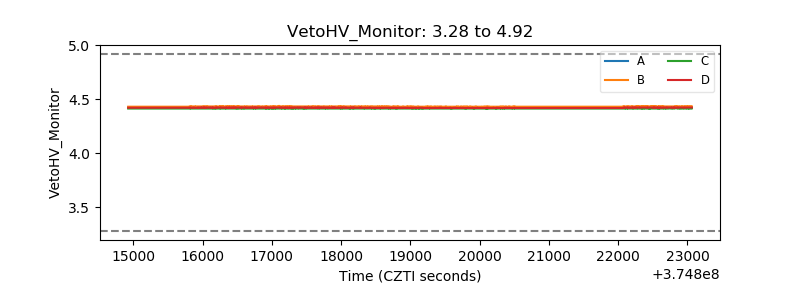 |
| Veto LLD | 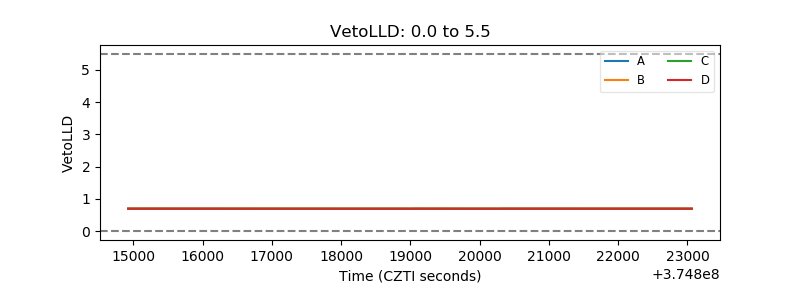 |
| Alpha Counter | 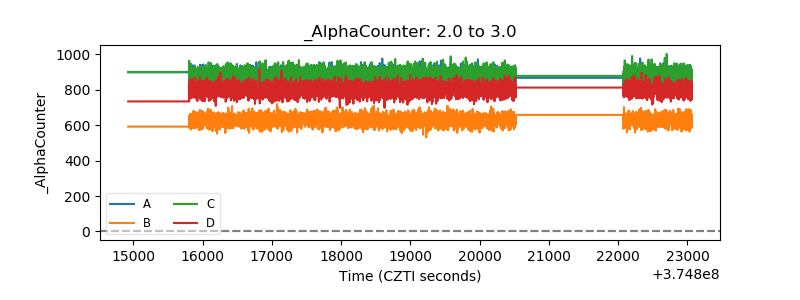 |
| _CPM_Rate | 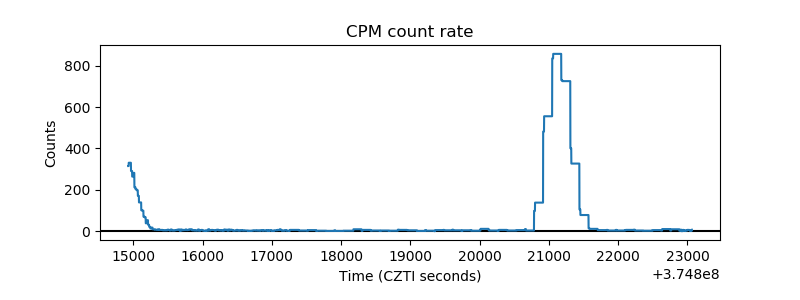 |
| CZT Counter | 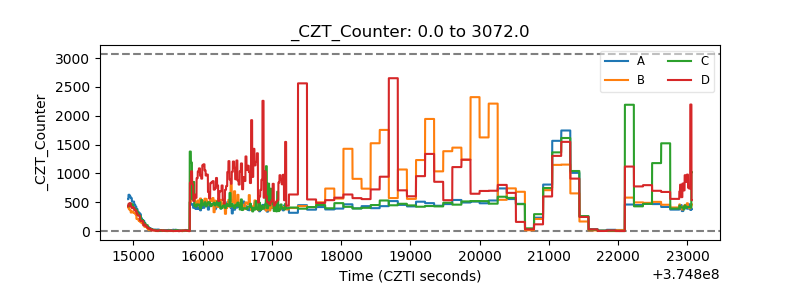 |
| +2.5 Volts monitor | 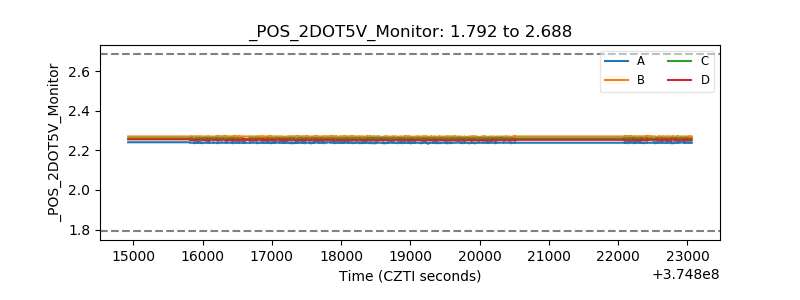 |
| +5 Volts monitor |  |
| _ROLL_ROT | 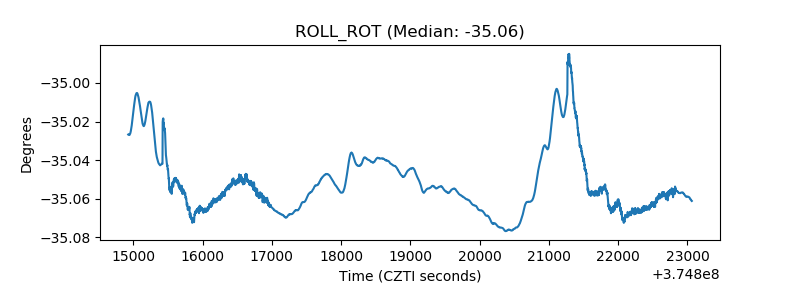 |
| _Roll_DEC | 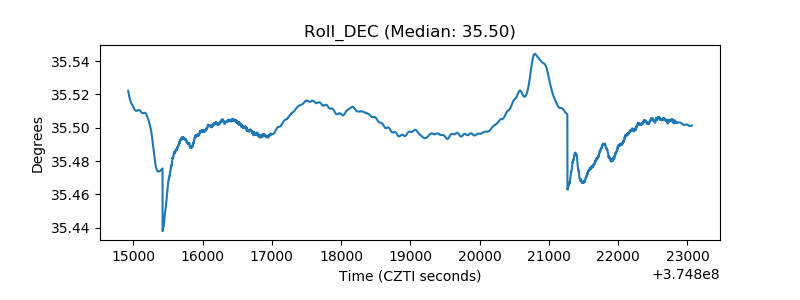 |
| _Roll_RA | 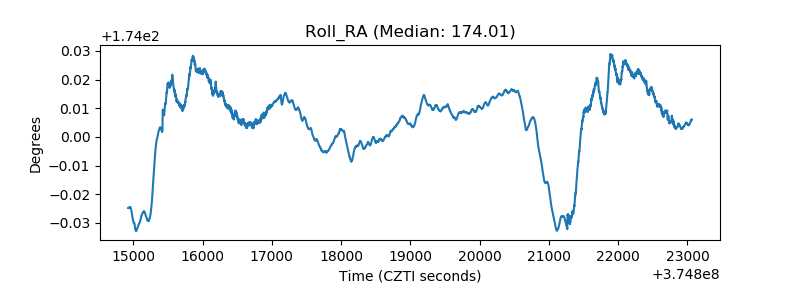 |
| Veto Counter | 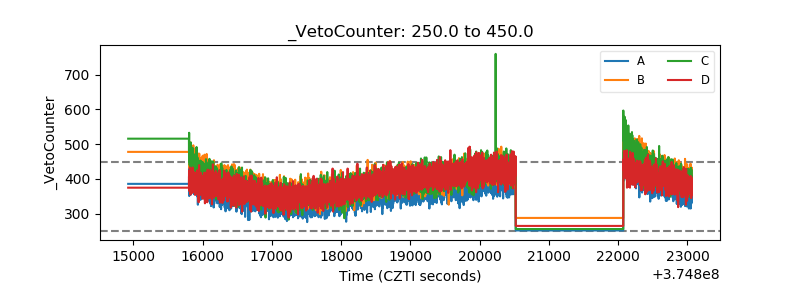 |