| Param | Original file | Final file |
|---|---|---|
| Filename | modeM0/AS1A11_080T02_9000004768_33187cztM0_level2.evt | modeM0/AS1A11_080T02_9000004768_33187cztM0_level2_quad_clean.evt |
| Size (bytes) | 462,957,120 | 72,360,000 |
| Size | 441.5 MB | 69.0 MB |
| Events in quadrant A | 2,548,327 | 459,609 |
| Events in quadrant B | 3,785,281 | 458,105 |
| Events in quadrant C | 2,741,554 | 454,722 |
| Events in quadrant D | 4,565,560 | 426,694 |
| Mode M9 | |||
|---|---|---|---|
| Quadrant | BADHDUFLAG | Total packets | Discarded packets |
| A | 0 | 20 | 0 |
| B | 0 | 20 | 0 |
| C | 0 | 20 | 0 |
| D | 0 | 21 | 0 |
| Mode SS | |||
|---|---|---|---|
| Quadrant | BADHDUFLAG | Total packets | Discarded packets |
| A | 0 | 114 | 0 |
| B | 0 | 114 | 0 |
| C | 0 | 114 | 0 |
| D | 0 | 114 | 0 |
| Mode M0 | |||
|---|---|---|---|
| Quadrant | BADHDUFLAG | Total packets | Discarded packets |
| A | 0 | 11243 | 3 |
| B | 0 | 14890 | 2 |
| C | 0 | 11840 | 2 |
| D | 0 | 17463 | 2 |
| Quadrant | Total seconds | Saturated seconds | Saturation percentage |
|---|---|---|---|
| A | 5600 | 5 | 0.089286% |
| B | 5600 | 246 | 4.392857% |
| C | 5600 | 37 | 0.660714% |
| D | 5600 | 92 | 1.642857% |
Noise dominated data is calculated using 1-second bins in cleaned event files. If a bin has >2000 counts, and if more than 50% of those come from <1% of pixels, then it is considered to be noise-dominated and hence unusable.
| Quadrant | # 1 sec bins | Bins with >0 counts | Bins with >2000 counts | High rate bins dominated by noise | Noise dominated (total time) | Noise dominated (detector-on time) | Marked lightcurve |
|---|---|---|---|---|---|---|---|
| A | 7271 | 5601 | 0 | 0 | 0.00% | 0.00% | 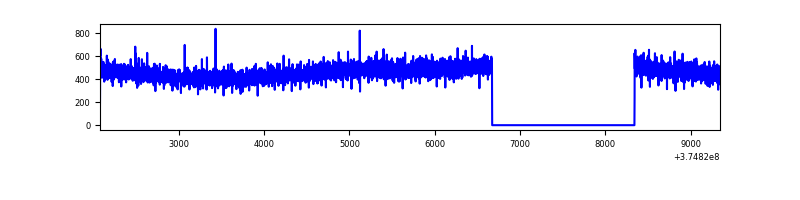 |
| B | 7271 | 5601 | 150 | 150 | 2.06% | 2.68% | 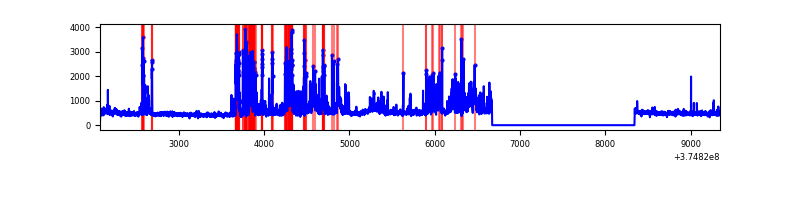 |
| C | 7271 | 5601 | 24 | 24 | 0.33% | 0.43% | 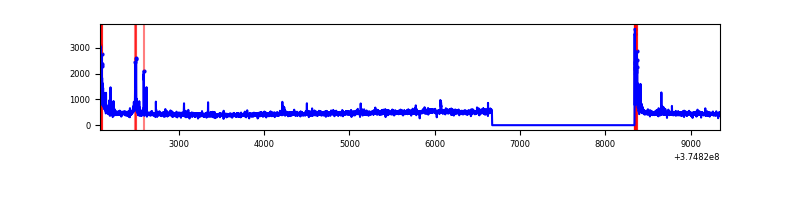 |
| D | 7271 | 5601 | 67 | 67 | 0.92% | 1.20% | 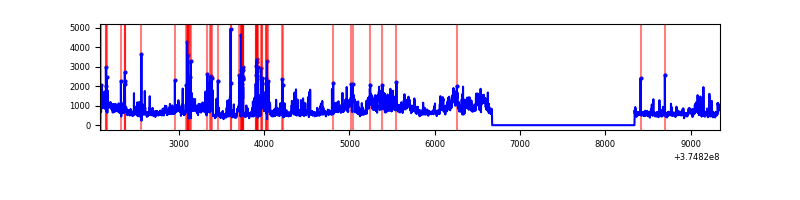 |
Top three noisy pixels from each quadrant. If the there are fewer than three noisy pixels in the level2.evt file, extra rows are filled as -1
| Pixel properties | Quadrant properties | ||||||
|---|---|---|---|---|---|---|---|
| Quadrant | DetID | PixID | Counts | Sigma | Mean | Median | Sigma |
| A | 13 | 254 | 9715 | 68.7 | 657 | 643 | 132.0 |
| A | 3 | 137 | 6059 | 41.01 | 657 | 643 | 132.0 |
| A | 13 | 6 | 5544 | 37.11 | 657 | 643 | 132.0 |
| B | 5 | 172 | 619780 | 5072.56 | 646 | 631 | 122.1 |
| B | 0 | 219 | 446909 | 3656.26 | 646 | 631 | 122.1 |
| B | 15 | 85 | 40508 | 326.7 | 646 | 631 | 122.1 |
| C | 0 | 10 | 134036 | 905.22 | 635 | 641 | 147.4 |
| C | 1 | 23 | 56891 | 381.72 | 635 | 641 | 147.4 |
| C | 7 | 221 | 35492 | 236.5 | 635 | 641 | 147.4 |
| D | 8 | 195 | 1267415 | 7407.84 | 628 | 614 | 171.0 |
| D | 7 | 223 | 219824 | 1281.87 | 628 | 614 | 171.0 |
| D | 10 | 203 | 197175 | 1149.42 | 628 | 614 | 171.0 |
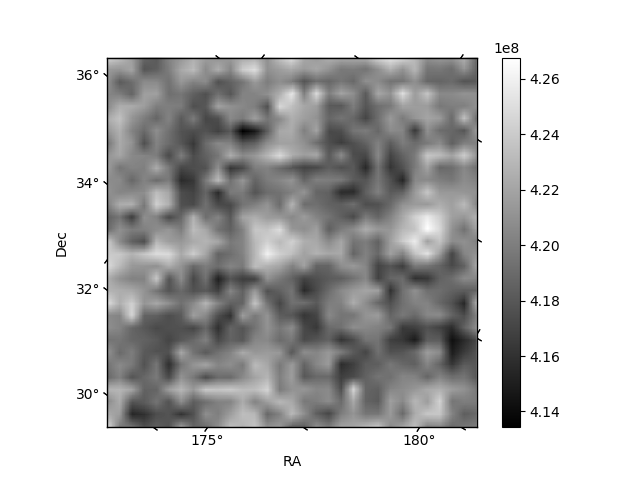
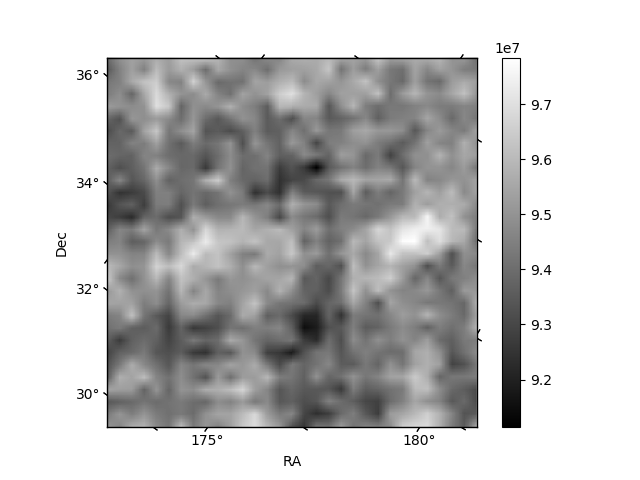
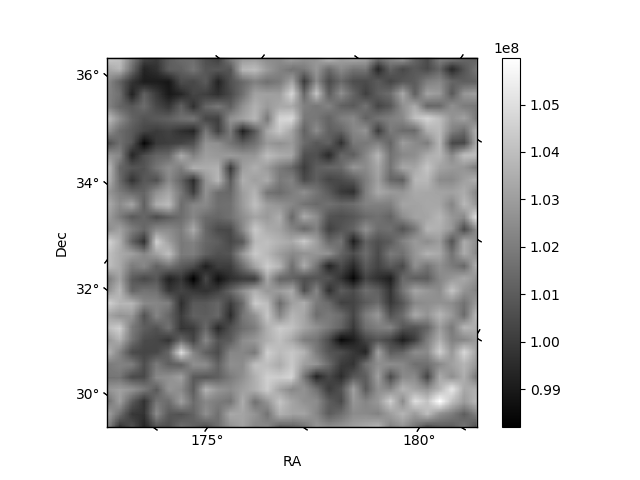
Histogram calculated using DETX and DETY for each event in the final _common_clean file
| Quadrant A | 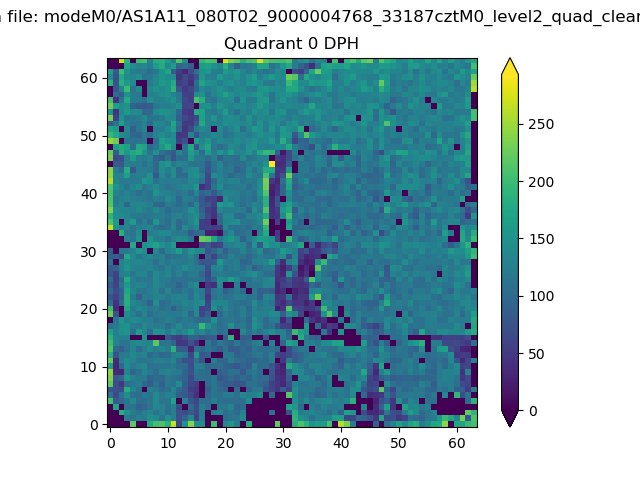 |
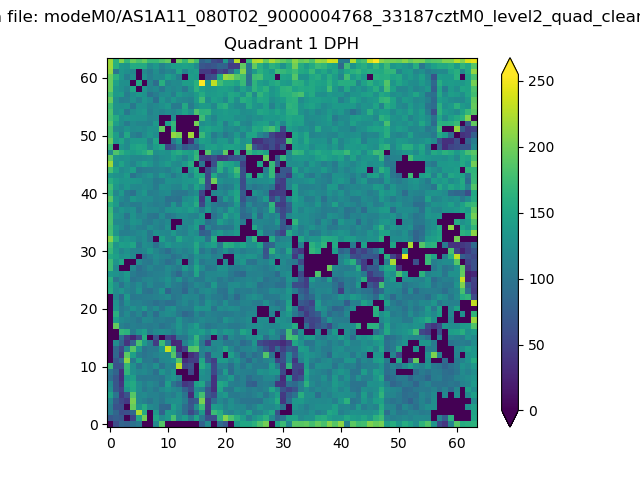 |
Quadrant B |
|---|---|---|---|
| Quadrant D | 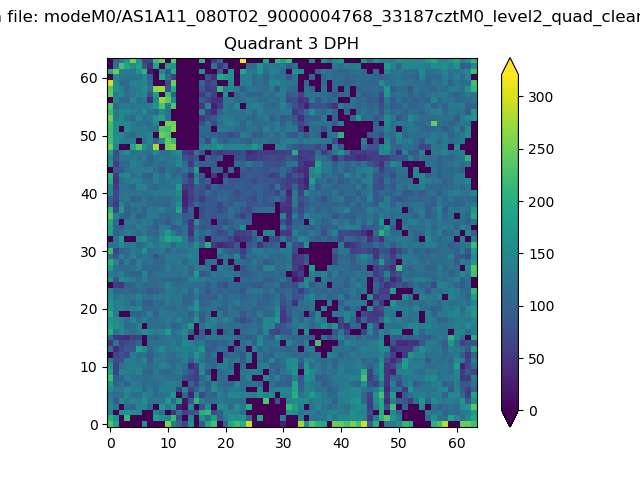 |
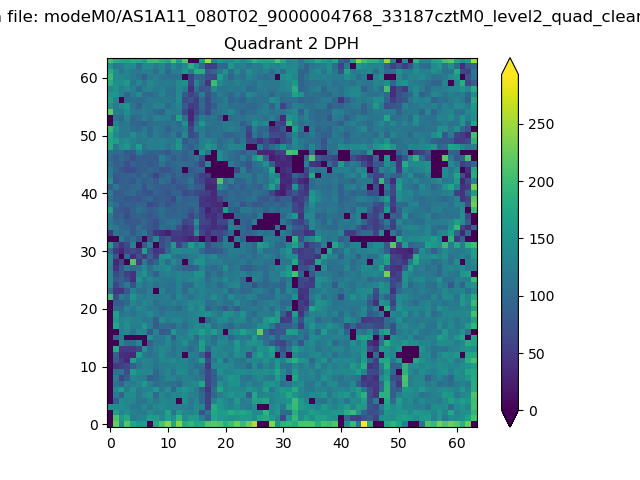 |
Quadrant C |
| Plot type | Count rate plots | Images |
|---|---|---|
| Comparison with Poisson distribution Blue bars denote a histogram of data divided into 1 sec bins. Red curve is a Poisson curve with rate = median count rate of data. |
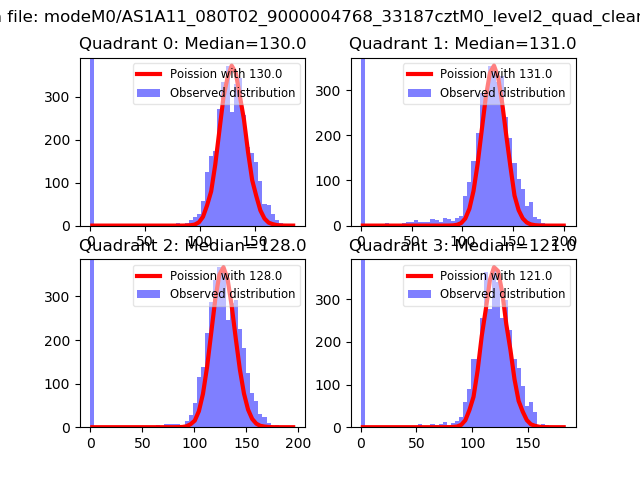 |
 |
| Quadrant-wise count rates Data is divided into 100 sec bins |
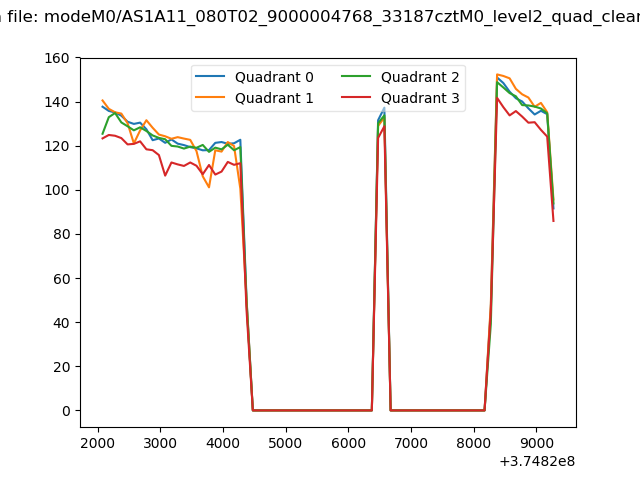 |
|
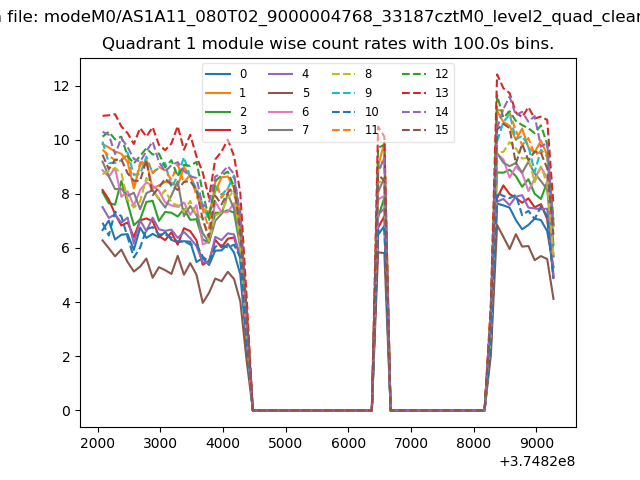
| Module-wise count rates for Quadrant A Data is divided into 100 sec bins |
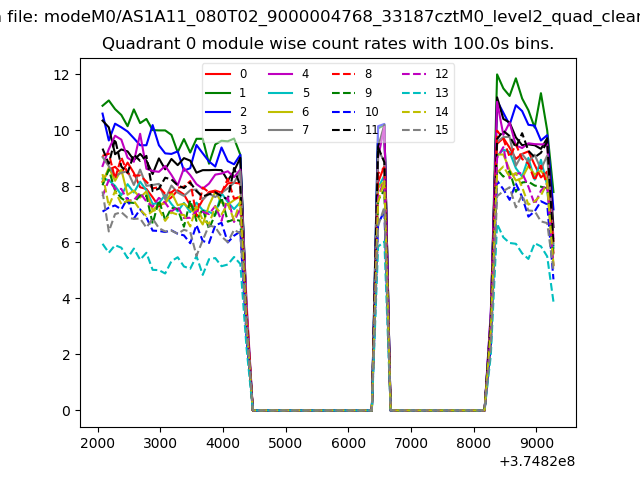 |
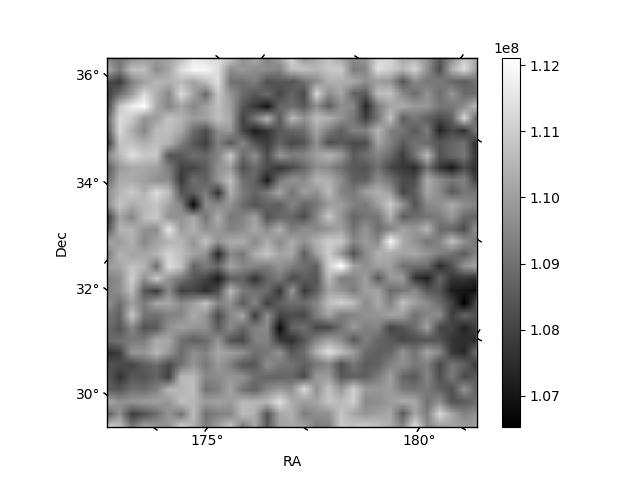 |
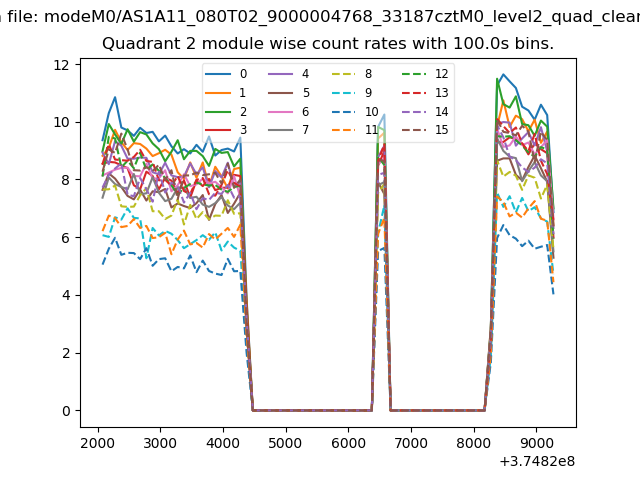
| Module-wise count rates for Quadrant B Data is divided into 100 sec bins |
 |
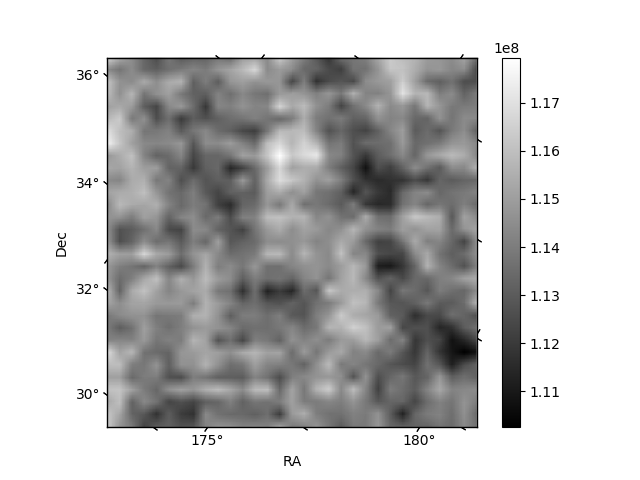 |
| Module-wise count rates for Quadrant C Data is divided into 100 sec bins |
 |
 |
| Module-wise count rates for Quadrant D Data is divided into 100 sec bins |
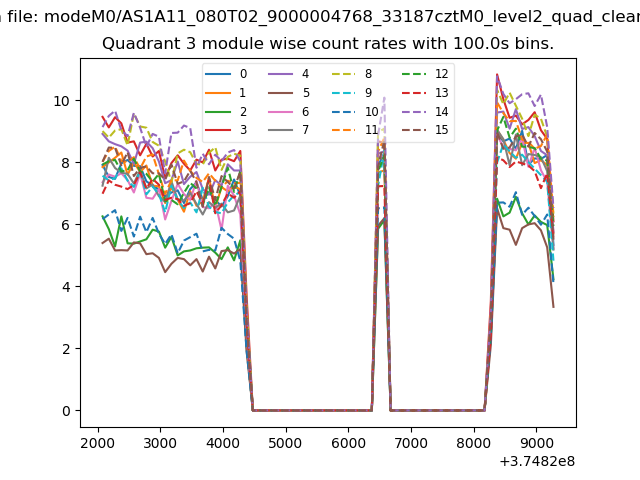 |
 |
| Parameter | Plot |
|---|---|
| CZT HV Monitor | 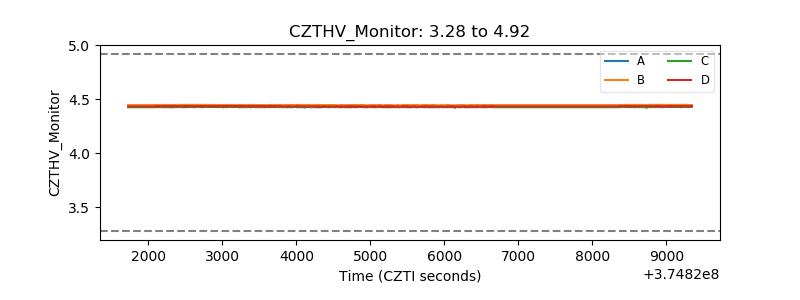 |
| D_VDD | 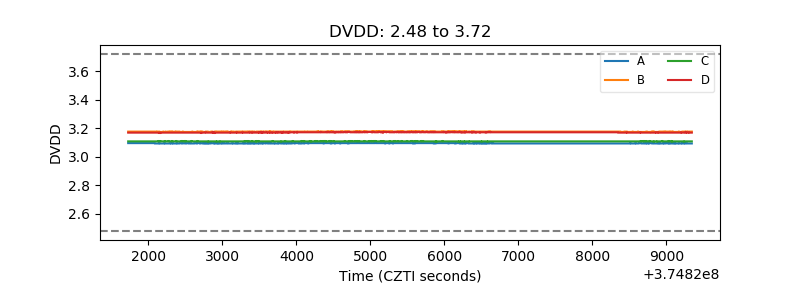 |
| Temperature 1 | 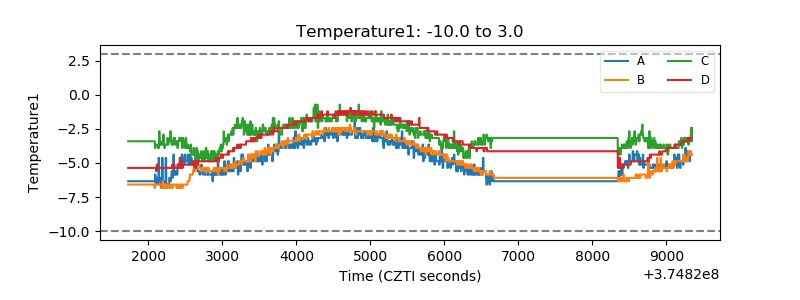 |
| Veto HV Monitor | 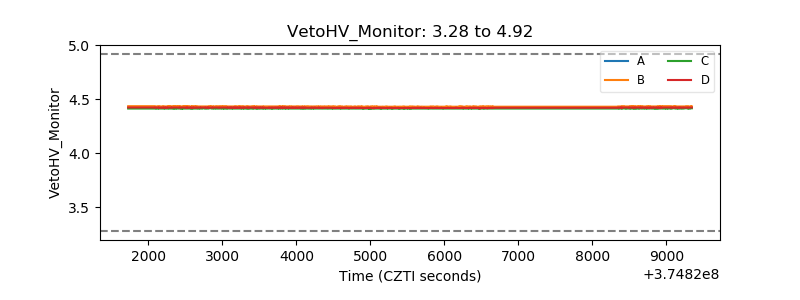 |
| Veto LLD | 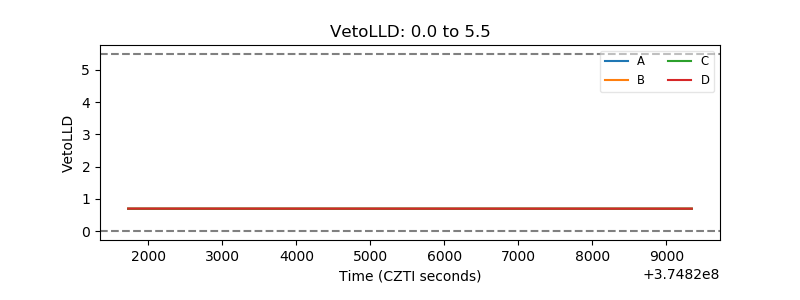 |
| Alpha Counter | 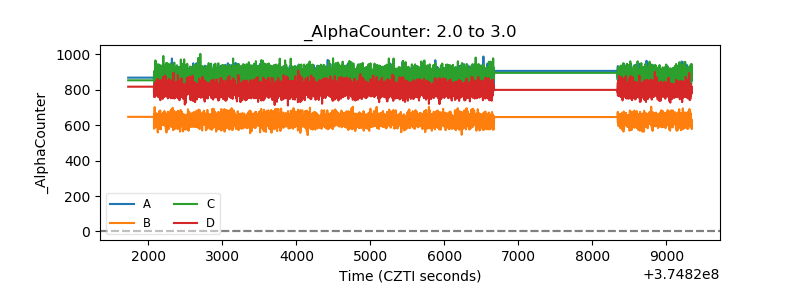 |
| _CPM_Rate | 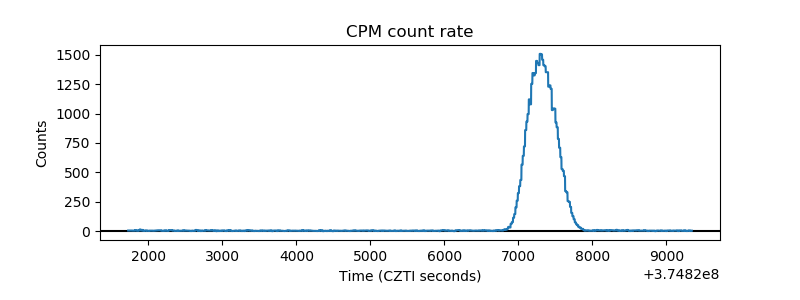 |
| CZT Counter | 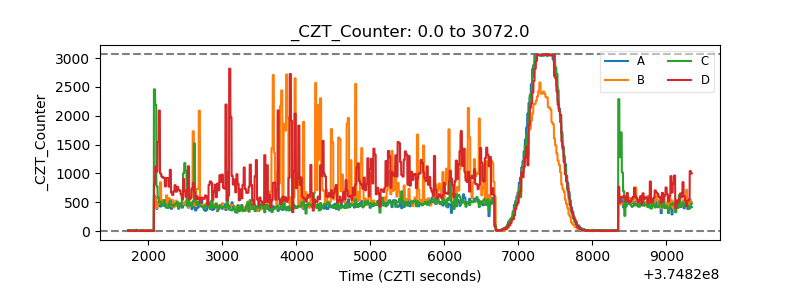 |
| +2.5 Volts monitor | 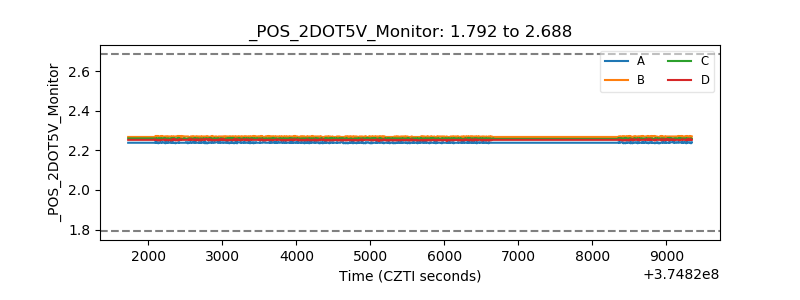 |
| +5 Volts monitor |  |
| _ROLL_ROT | 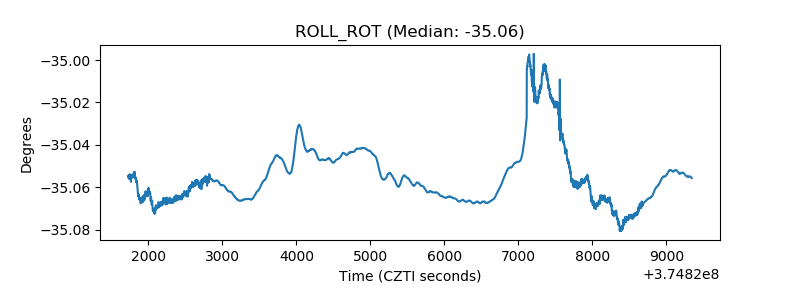 |
| _Roll_DEC | 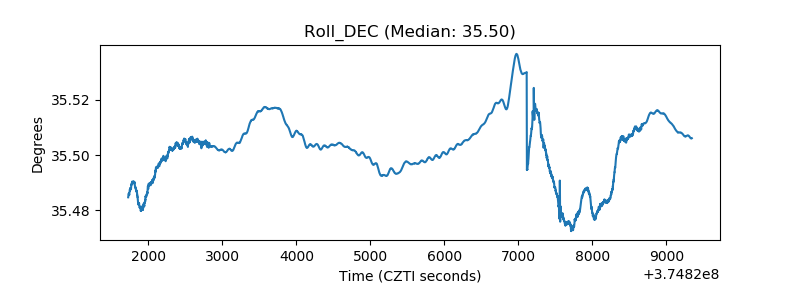 |
| _Roll_RA | 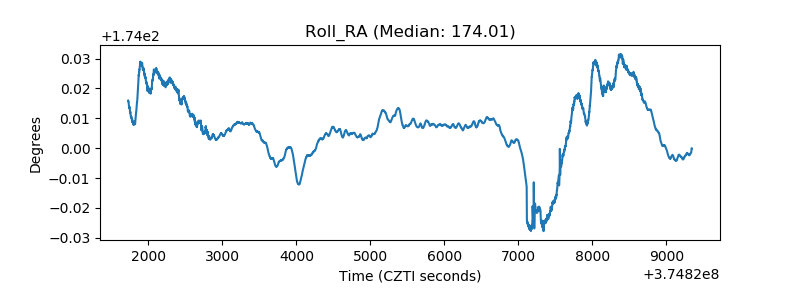 |
| Veto Counter | 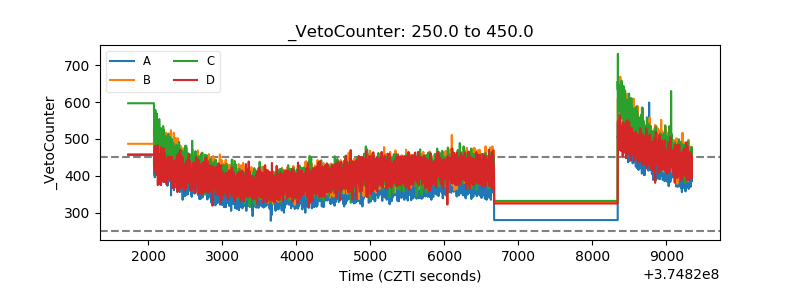 |