| Param | Original file | Final file |
|---|---|---|
| Filename | modeM0/AS1A11_080T02_9000004768_33189cztM0_level2.evt | modeM0/AS1A11_080T02_9000004768_33189cztM0_level2_quad_clean.evt |
| Size (bytes) | 459,031,680 | 72,288,000 |
| Size | 437.8 MB | 68.9 MB |
| Events in quadrant A | 2,549,920 | 460,180 |
| Events in quadrant B | 3,599,016 | 468,742 |
| Events in quadrant C | 2,733,678 | 457,718 |
| Events in quadrant D | 4,657,123 | 428,509 |
| Mode M9 | |||
|---|---|---|---|
| Quadrant | BADHDUFLAG | Total packets | Discarded packets |
| A | 0 | 21 | 0 |
| B | 0 | 21 | 0 |
| C | 0 | 21 | 0 |
| D | 0 | 22 | 0 |
| Mode SS | |||
|---|---|---|---|
| Quadrant | BADHDUFLAG | Total packets | Discarded packets |
| A | 0 | 108 | 0 |
| B | 0 | 108 | 0 |
| C | 0 | 108 | 0 |
| D | 0 | 108 | 0 |
| Mode M0 | |||
|---|---|---|---|
| Quadrant | BADHDUFLAG | Total packets | Discarded packets |
| A | 0 | 10813 | 3 |
| B | 0 | 13990 | 2 |
| C | 0 | 11485 | 2 |
| D | 0 | 17642 | 2 |
| Quadrant | Total seconds | Saturated seconds | Saturation percentage |
|---|---|---|---|
| A | 5342 | 6 | 0.112317% |
| B | 5342 | 183 | 3.425683% |
| C | 5342 | 55 | 1.029577% |
| D | 5342 | 153 | 2.864096% |
Noise dominated data is calculated using 1-second bins in cleaned event files. If a bin has >2000 counts, and if more than 50% of those come from <1% of pixels, then it is considered to be noise-dominated and hence unusable.
| Quadrant | # 1 sec bins | Bins with >0 counts | Bins with >2000 counts | High rate bins dominated by noise | Noise dominated (total time) | Noise dominated (detector-on time) | Marked lightcurve |
|---|---|---|---|---|---|---|---|
| A | 7163 | 5343 | 0 | 0 | 0.00% | 0.00% | 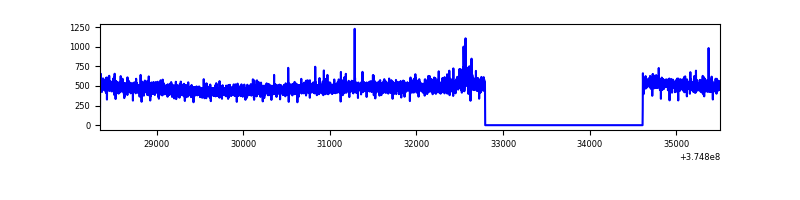 |
| B | 7163 | 5343 | 92 | 92 | 1.28% | 1.72% | 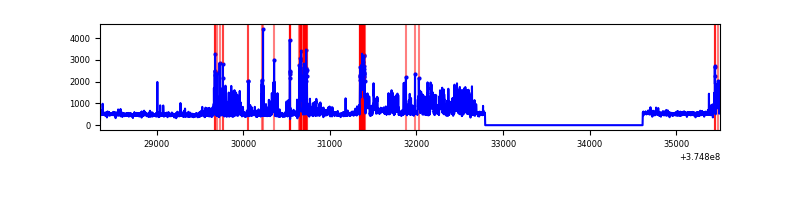 |
| C | 7163 | 5343 | 40 | 40 | 0.56% | 0.75% | 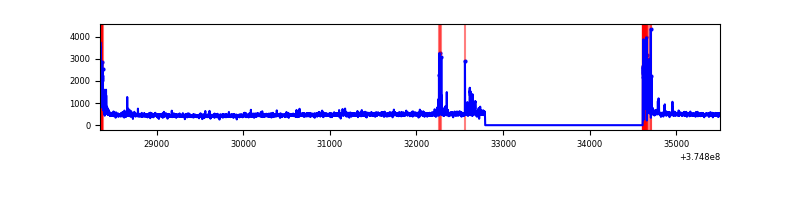 |
| D | 7163 | 5343 | 118 | 118 | 1.65% | 2.21% | 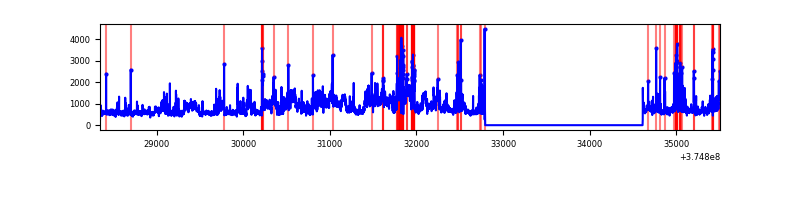 |
Top three noisy pixels from each quadrant. If the there are fewer than three noisy pixels in the level2.evt file, extra rows are filled as -1
| Pixel properties | Quadrant properties | ||||||
|---|---|---|---|---|---|---|---|
| Quadrant | DetID | PixID | Counts | Sigma | Mean | Median | Sigma |
| A | 0 | 31 | 14967 | 109.66 | 654 | 640 | 130.7 |
| A | 13 | 254 | 9455 | 67.47 | 654 | 640 | 130.7 |
| A | 13 | 6 | 8701 | 61.7 | 654 | 640 | 130.7 |
| B | 0 | 219 | 505294 | 4162.11 | 643 | 627 | 121.3 |
| B | 5 | 172 | 386305 | 3180.78 | 643 | 627 | 121.3 |
| B | 0 | 155 | 56040 | 457.0 | 643 | 627 | 121.3 |
| C | 0 | 10 | 162141 | 1126.35 | 629 | 636 | 143.4 |
| C | 15 | 208 | 27808 | 189.5 | 629 | 636 | 143.4 |
| C | 1 | 23 | 24555 | 166.81 | 629 | 636 | 143.4 |
| D | 8 | 195 | 1367791 | 8031.35 | 622 | 608 | 170.2 |
| D | 12 | 218 | 282402 | 1655.36 | 622 | 608 | 170.2 |
| D | 10 | 203 | 170680 | 999.07 | 622 | 608 | 170.2 |
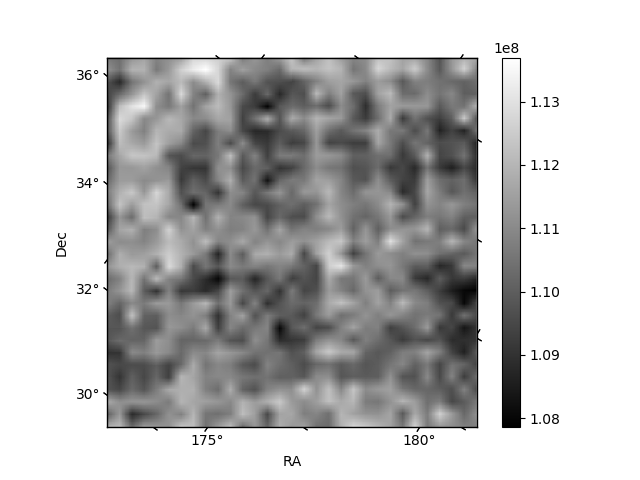
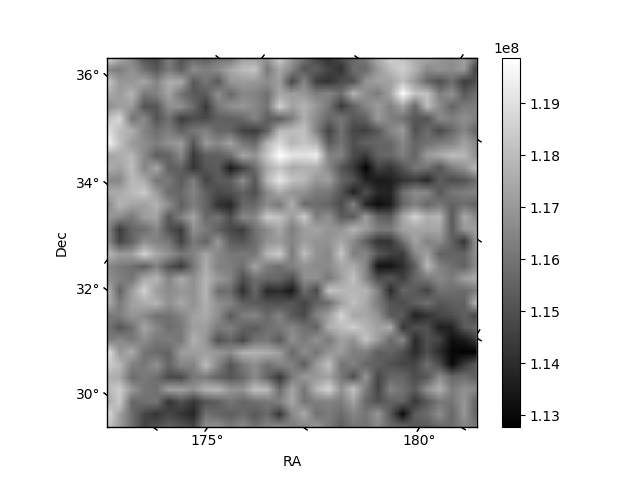
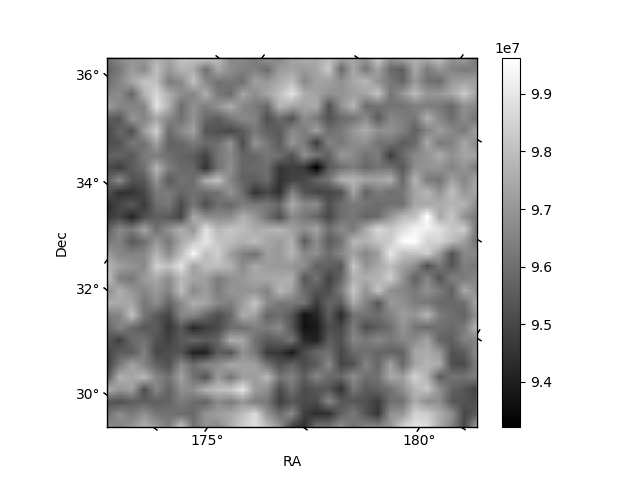
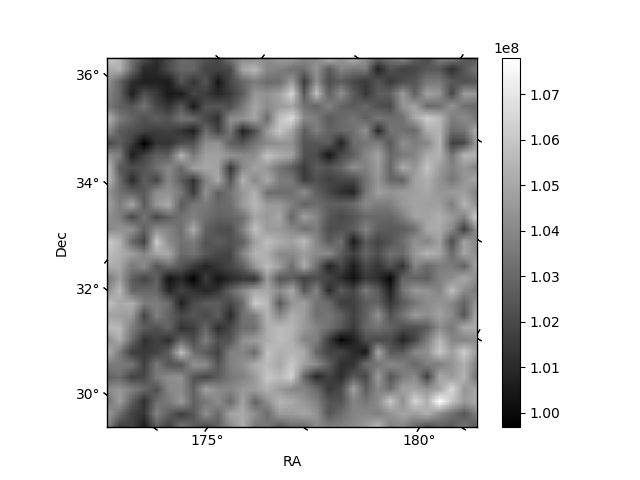
Histogram calculated using DETX and DETY for each event in the final _common_clean file
| Quadrant A | 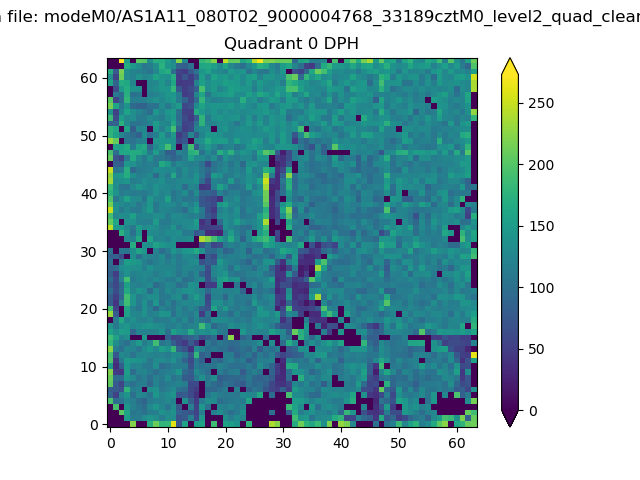 |
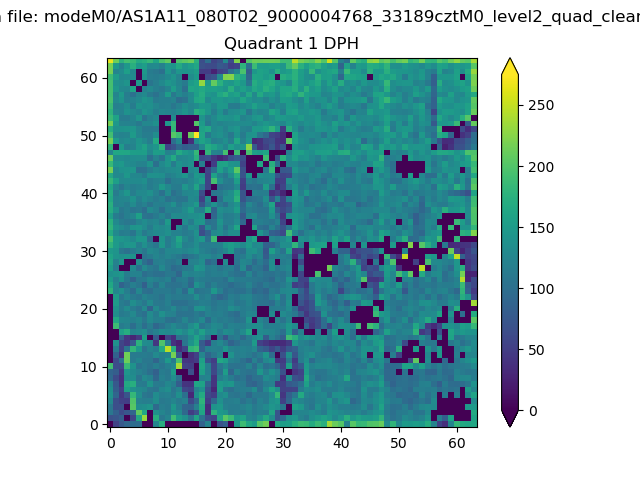 |
Quadrant B |
|---|---|---|---|
| Quadrant D |  |
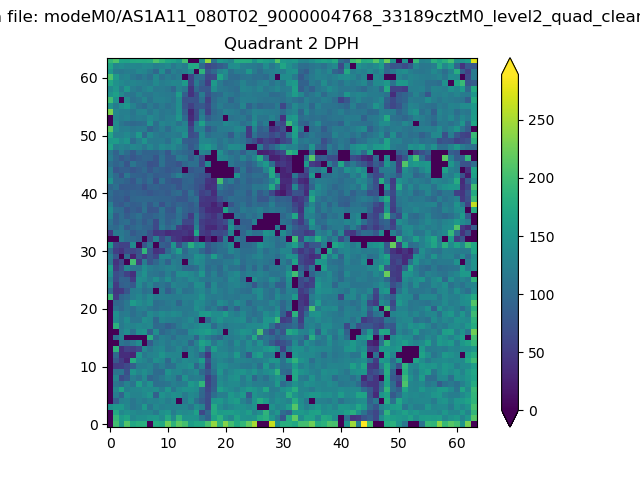 |
Quadrant C |
| Plot type | Count rate plots | Images |
|---|---|---|
| Comparison with Poisson distribution Blue bars denote a histogram of data divided into 1 sec bins. Red curve is a Poisson curve with rate = median count rate of data. |
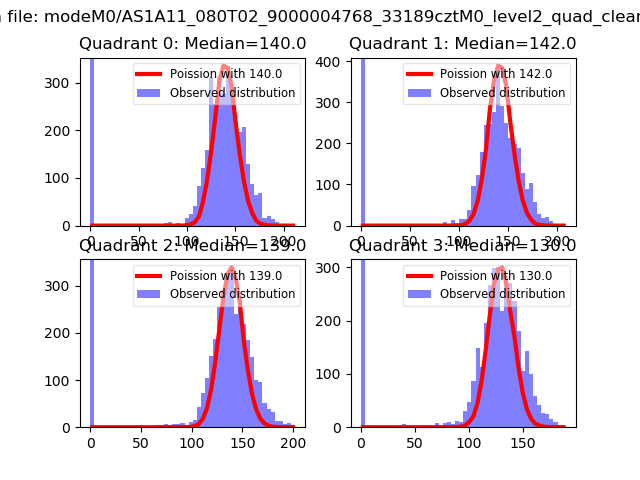 |
 |
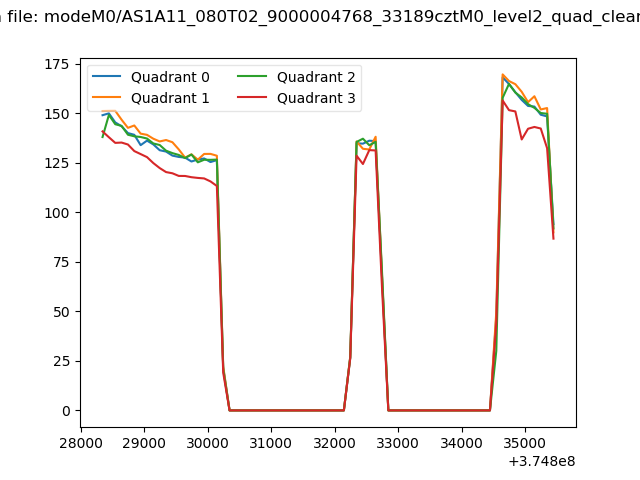
| Quadrant-wise count rates Data is divided into 100 sec bins |
 |
|
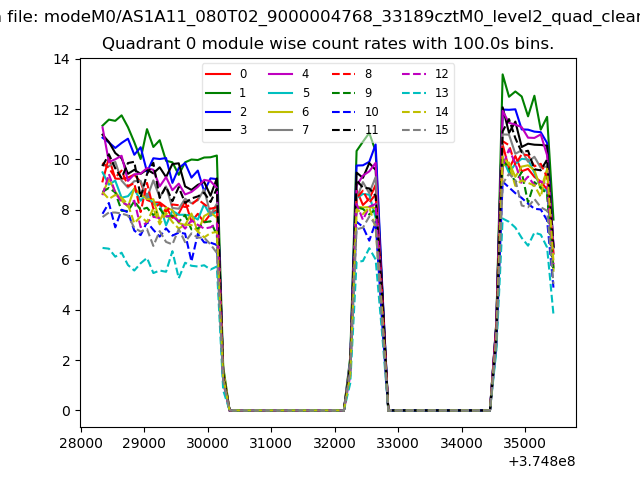
| Module-wise count rates for Quadrant A Data is divided into 100 sec bins |
 |
 |
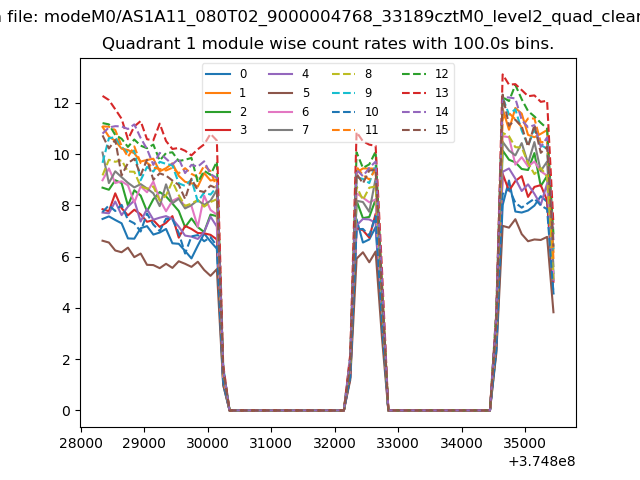
| Module-wise count rates for Quadrant B Data is divided into 100 sec bins |
 |
 |
| Module-wise count rates for Quadrant C Data is divided into 100 sec bins |
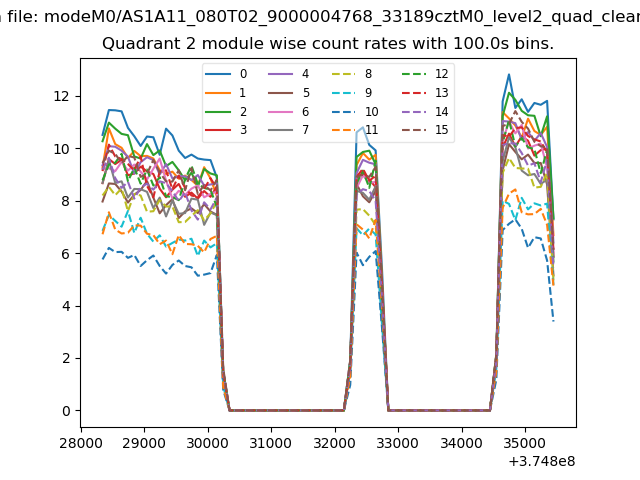 |
 |
| Module-wise count rates for Quadrant D Data is divided into 100 sec bins |
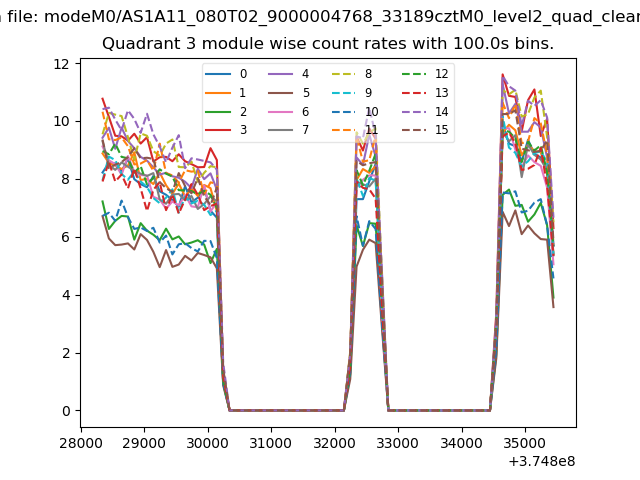 |
 |
| Parameter | Plot |
|---|---|
| CZT HV Monitor | 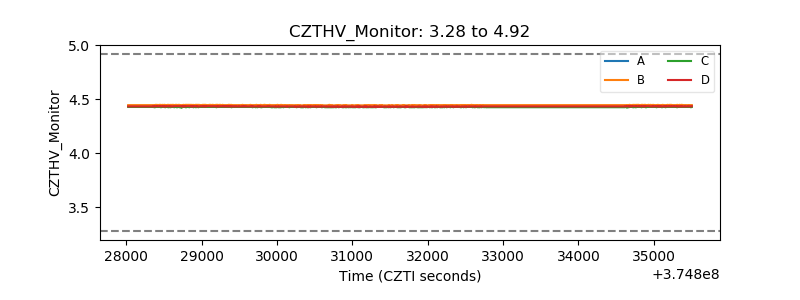 |
| D_VDD | 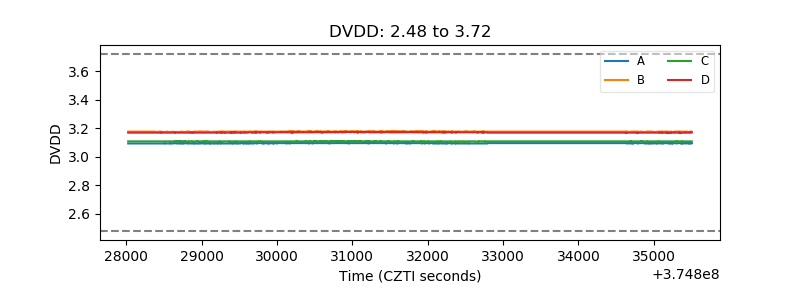 |
| Temperature 1 | 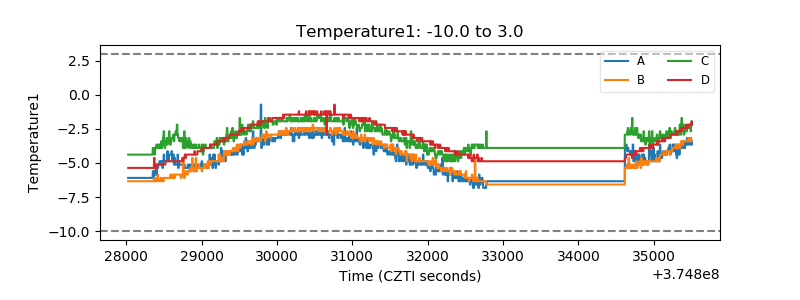 |
| Veto HV Monitor |  |
| Veto LLD | 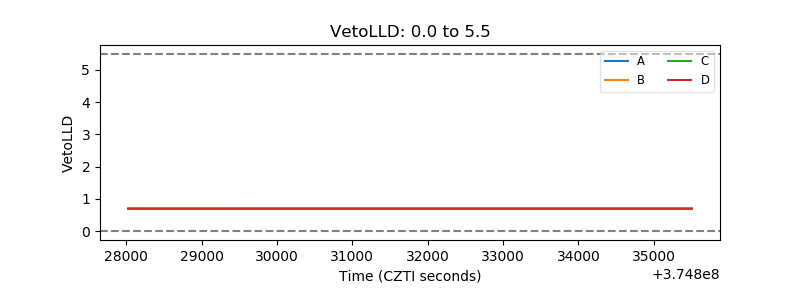 |
| Alpha Counter | 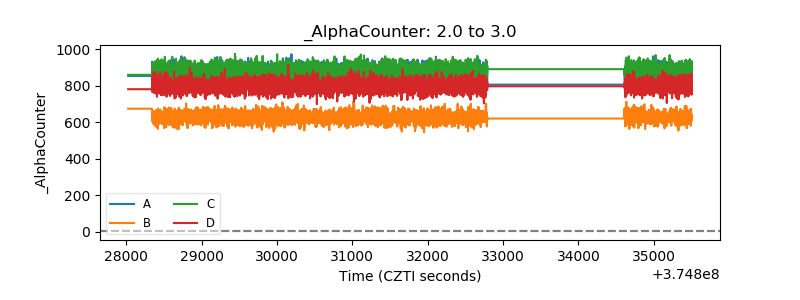 |
| _CPM_Rate | 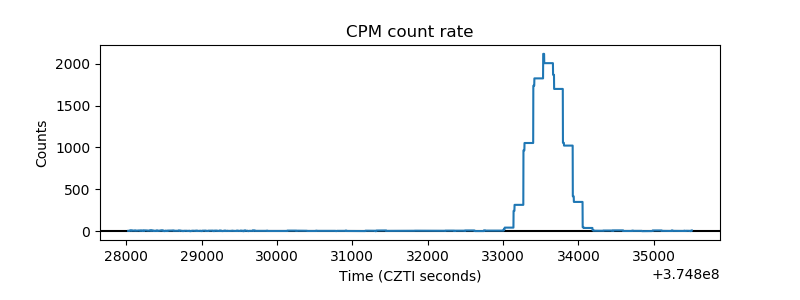 |
| CZT Counter | 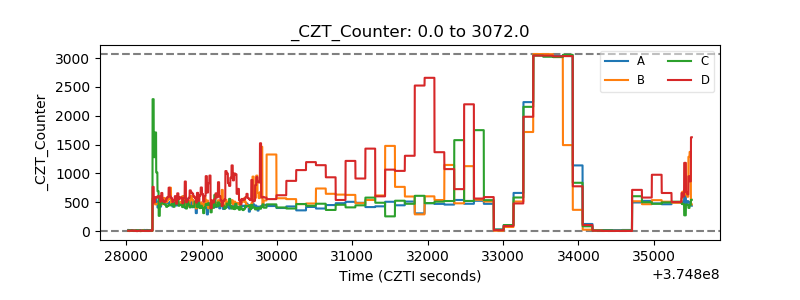 |
| +2.5 Volts monitor |  |
| +5 Volts monitor |  |
| _ROLL_ROT | 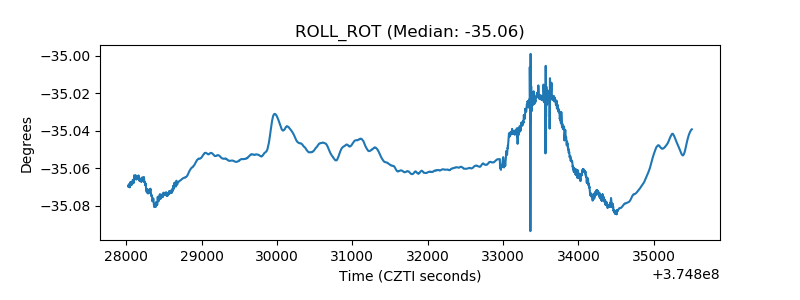 |
| _Roll_DEC | 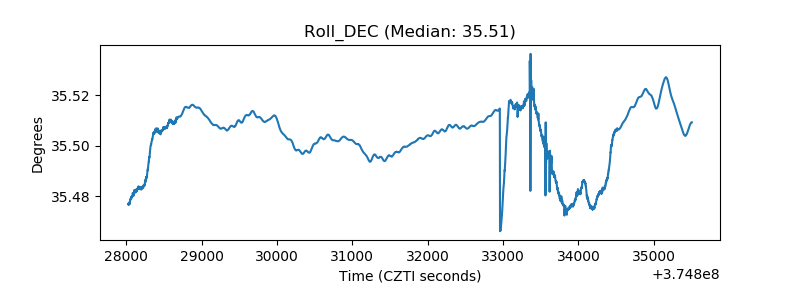 |
| _Roll_RA | 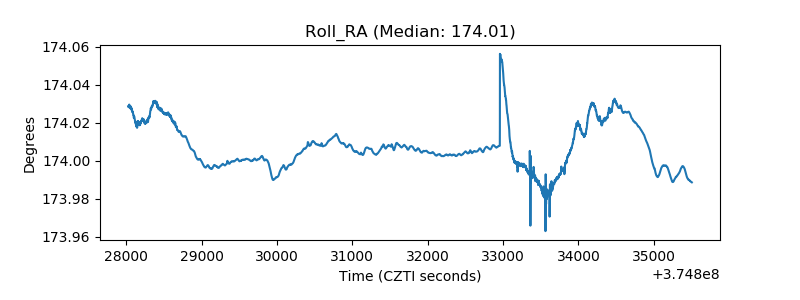 |
| Veto Counter | 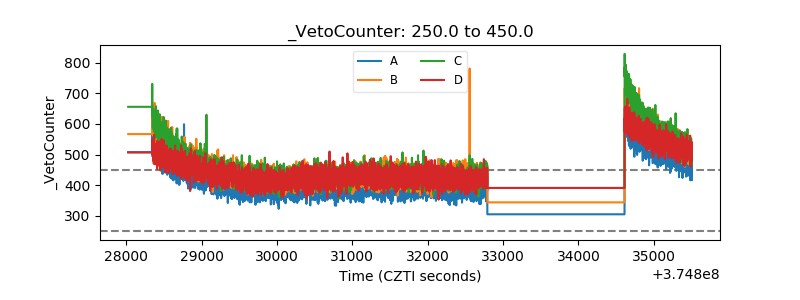 |