| Param | Original file | Final file |
|---|---|---|
| Filename | modeM0/AS1A11_080T02_9000004768_33193cztM0_level2.evt | modeM0/AS1A11_080T02_9000004768_33193cztM0_level2_quad_clean.evt |
| Size (bytes) | 644,832,000 | 50,454,720 |
| Size | 615.0 MB | 48.1 MB |
| Events in quadrant A | 2,602,774 | 300,190 |
| Events in quadrant B | 7,302,722 | 282,149 |
| Events in quadrant C | 4,639,020 | 291,972 |
| Events in quadrant D | 4,631,568 | 287,276 |
| Mode M9 | |||
|---|---|---|---|
| Quadrant | BADHDUFLAG | Total packets | Discarded packets |
| A | 0 | 31 | 0 |
| B | 0 | 31 | 0 |
| C | 0 | 31 | 0 |
| D | 0 | 32 | 0 |
| Mode SS | |||
|---|---|---|---|
| Quadrant | BADHDUFLAG | Total packets | Discarded packets |
| A | 0 | 106 | 0 |
| B | 0 | 106 | 0 |
| C | 0 | 106 | 0 |
| D | 0 | 106 | 0 |
| Mode M0 | |||
|---|---|---|---|
| Quadrant | BADHDUFLAG | Total packets | Discarded packets |
| A | 0 | 10663 | 2 |
| B | 0 | 25227 | 1 |
| C | 0 | 17124 | 1 |
| D | 0 | 17590 | 1 |
| Quadrant | Total seconds | Saturated seconds | Saturation percentage |
|---|---|---|---|
| A | 5221 | 8 | 0.153227% |
| B | 5221 | 1802 | 34.514461% |
| C | 5221 | 566 | 10.840835% |
| D | 5221 | 160 | 3.064547% |
Noise dominated data is calculated using 1-second bins in cleaned event files. If a bin has >2000 counts, and if more than 50% of those come from <1% of pixels, then it is considered to be noise-dominated and hence unusable.
| Quadrant | # 1 sec bins | Bins with >0 counts | Bins with >2000 counts | High rate bins dominated by noise | Noise dominated (total time) | Noise dominated (detector-on time) | Marked lightcurve |
|---|---|---|---|---|---|---|---|
| A | 7344 | 5222 | 0 | 0 | 0.00% | 0.00% | 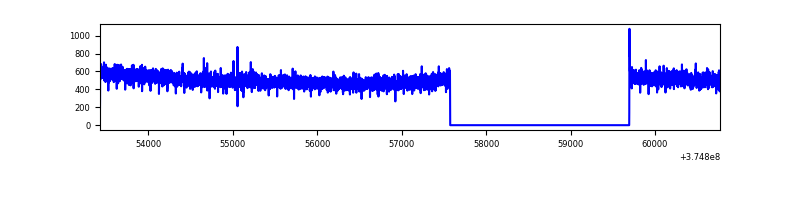 |
| B | 7344 | 5222 | 1433 | 1433 | 19.51% | 27.44% | 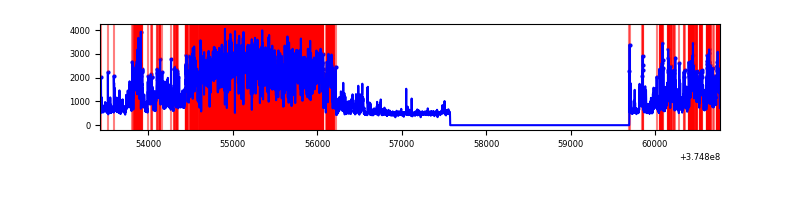 |
| C | 7343 | 5221 | 479 | 479 | 6.52% | 9.17% |  |
| D | 7344 | 5222 | 119 | 119 | 1.62% | 2.28% | 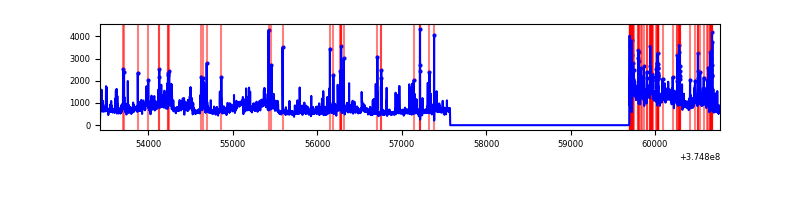 |
Top three noisy pixels from each quadrant. If the there are fewer than three noisy pixels in the level2.evt file, extra rows are filled as -1
| Pixel properties | Quadrant properties | ||||||
|---|---|---|---|---|---|---|---|
| Quadrant | DetID | PixID | Counts | Sigma | Mean | Median | Sigma |
| A | 13 | 6 | 10713 | 75.37 | 669 | 656 | 133.4 |
| A | 13 | 254 | 9975 | 69.84 | 669 | 656 | 133.4 |
| A | 3 | 137 | 5833 | 38.8 | 669 | 656 | 133.4 |
| B | 5 | 31 | 2083680 | 19266.93 | 581 | 568 | 108.1 |
| B | 5 | 15 | 1158850 | 10713.08 | 581 | 568 | 108.1 |
| B | 5 | 14 | 928880 | 8586.06 | 581 | 568 | 108.1 |
| C | 9 | 187 | 1203695 | 8406.08 | 627 | 633 | 143.1 |
| C | 0 | 10 | 439673 | 3067.68 | 627 | 633 | 143.1 |
| C | 1 | 23 | 264564 | 1844.15 | 627 | 633 | 143.1 |
| D | 8 | 195 | 1037430 | 6316.04 | 648 | 636 | 164.2 |
| D | 12 | 218 | 362512 | 2204.51 | 648 | 636 | 164.2 |
| D | 10 | 203 | 208437 | 1265.9 | 648 | 636 | 164.2 |
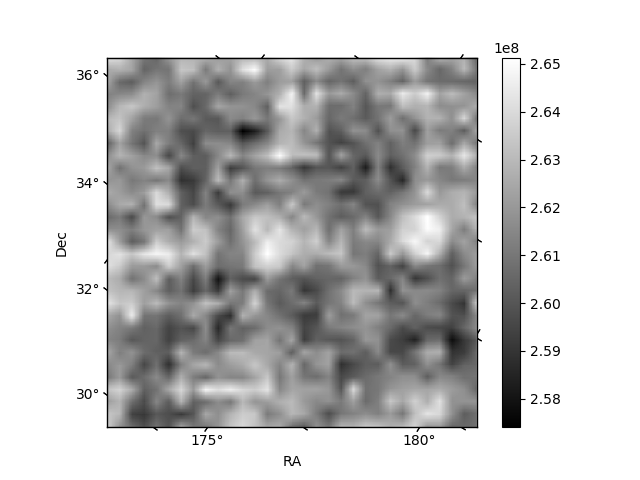
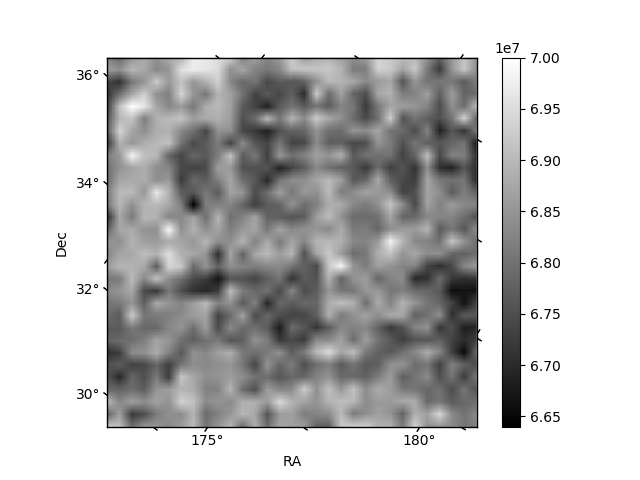
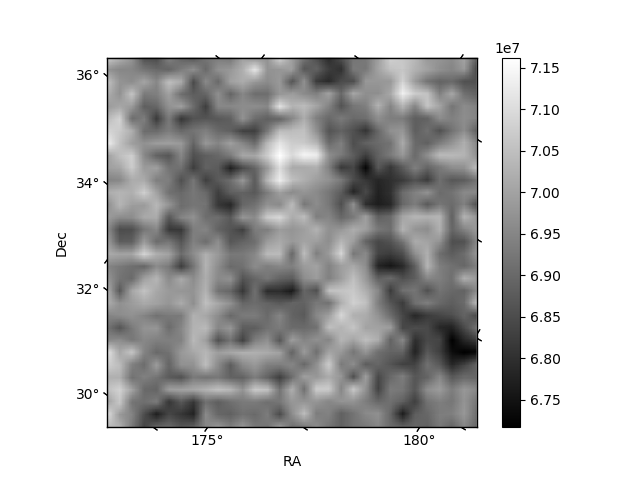
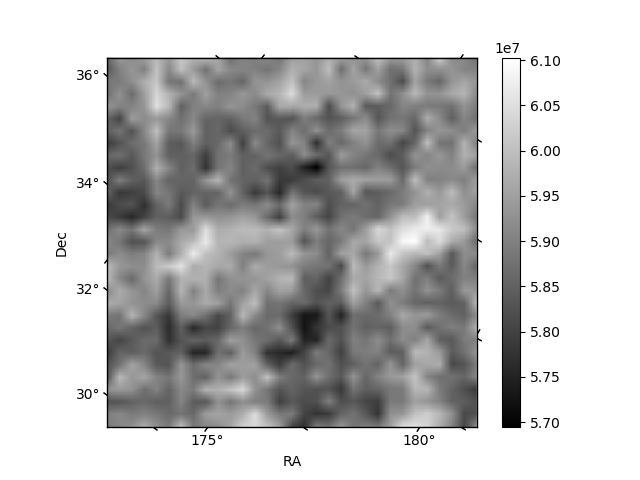
Histogram calculated using DETX and DETY for each event in the final _common_clean file
| Quadrant A | 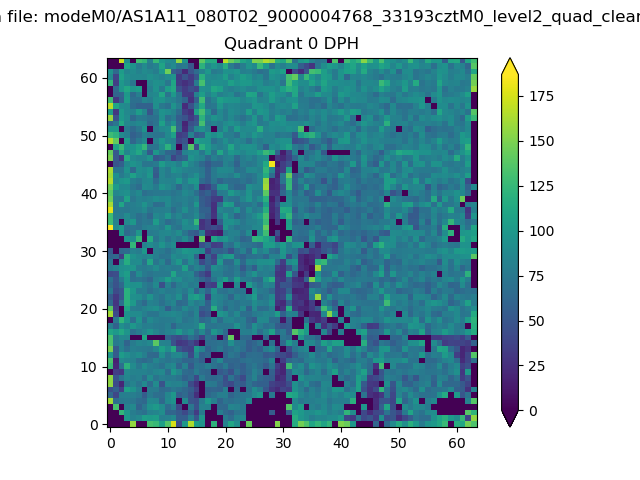 |
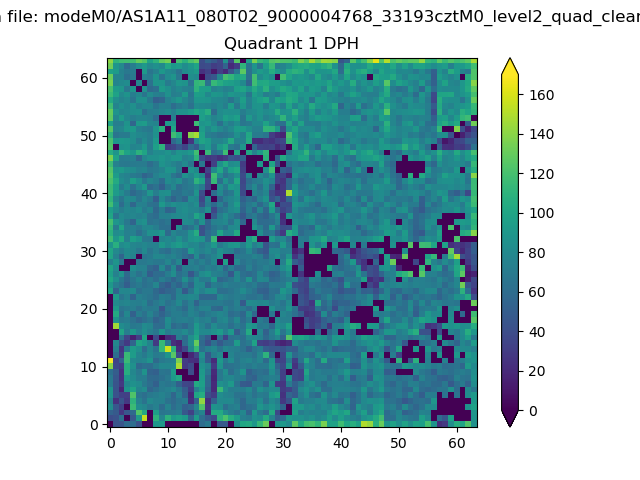 |
Quadrant B |
|---|---|---|---|
| Quadrant D | 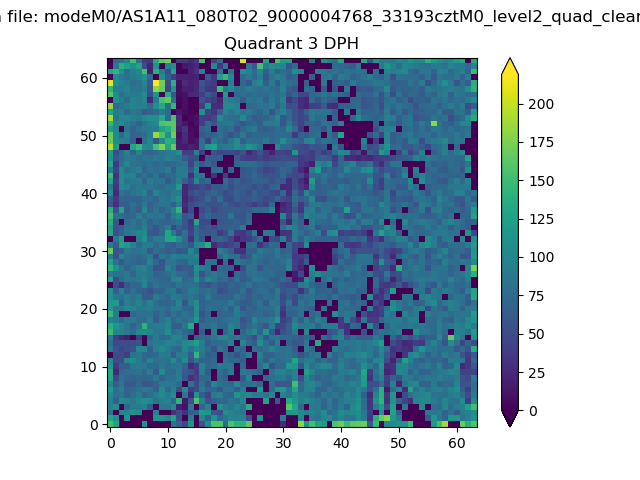 |
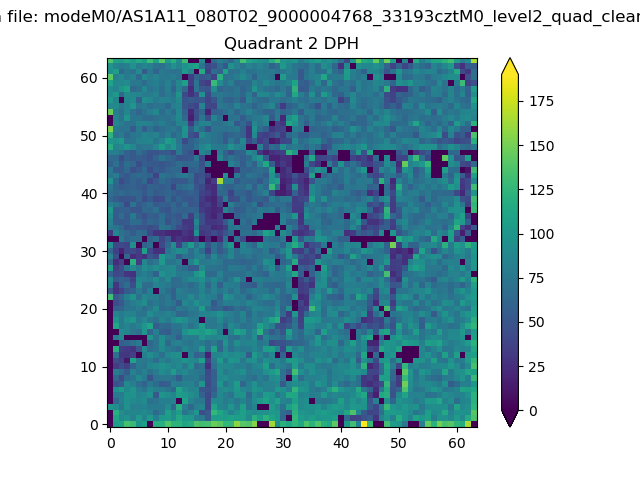 |
Quadrant C |
| Plot type | Count rate plots | Images |
|---|---|---|
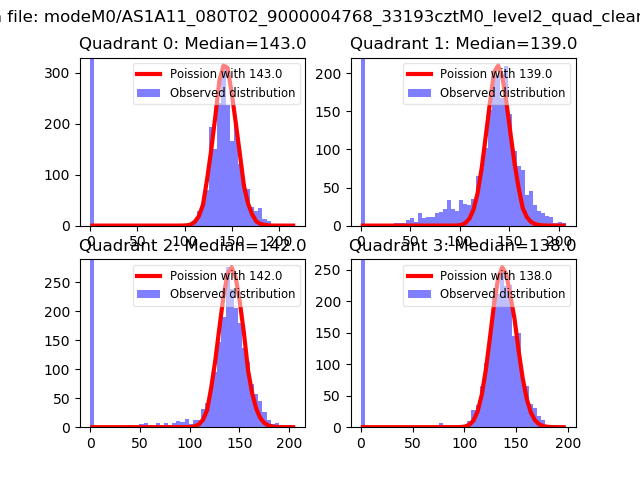
| Comparison with Poisson distribution Blue bars denote a histogram of data divided into 1 sec bins. Red curve is a Poisson curve with rate = median count rate of data. |
 |
 |
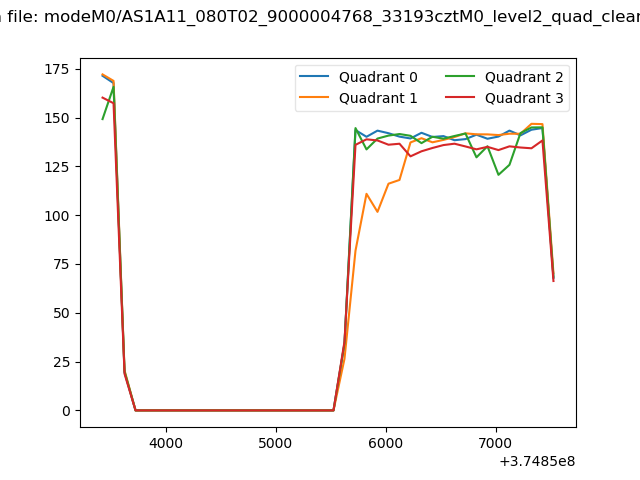
| Quadrant-wise count rates Data is divided into 100 sec bins |
 |
|
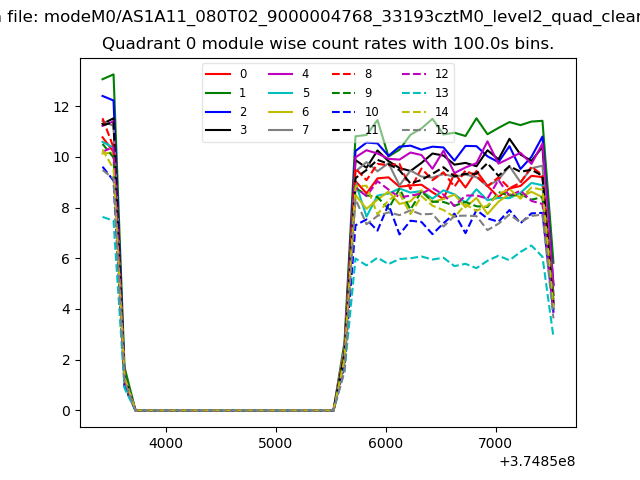
| Module-wise count rates for Quadrant A Data is divided into 100 sec bins |
 |
 |
| Module-wise count rates for Quadrant B Data is divided into 100 sec bins |
 |
 |
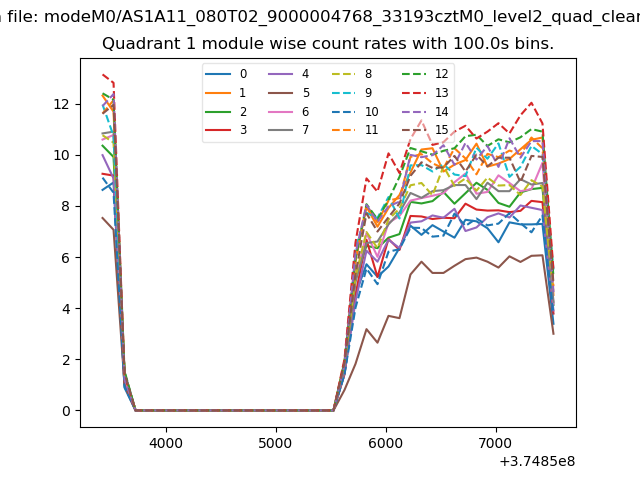
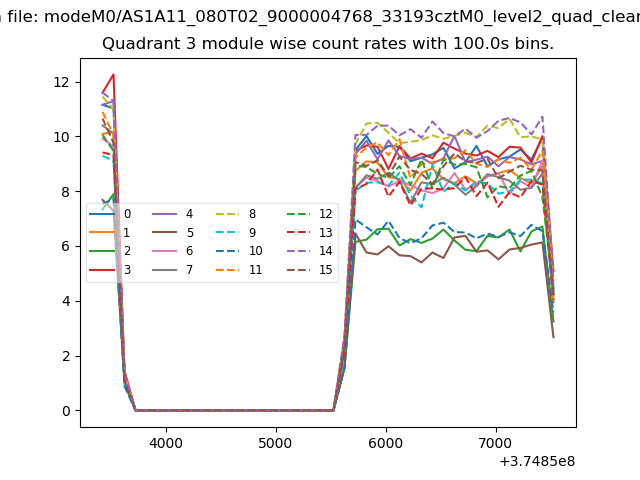
| Module-wise count rates for Quadrant C Data is divided into 100 sec bins |
 |
 |
| Module-wise count rates for Quadrant D Data is divided into 100 sec bins |
 |
 |
| Parameter | Plot |
|---|---|
| CZT HV Monitor |  |
| D_VDD | 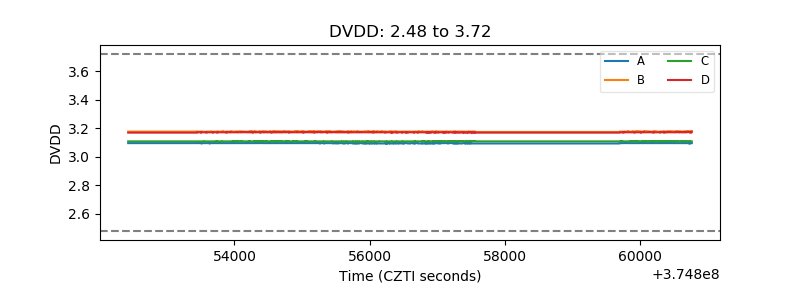 |
| Temperature 1 | 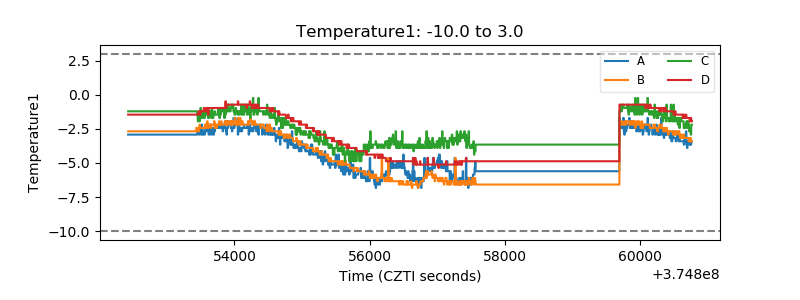 |
| Veto HV Monitor | 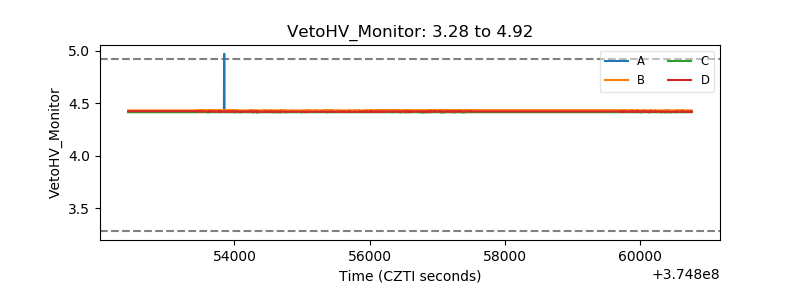 |
| Veto LLD | 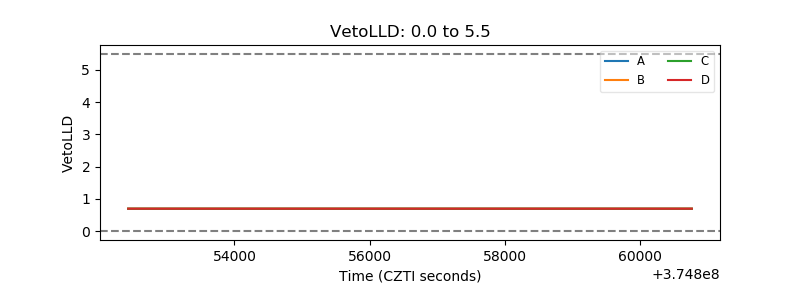 |
| Alpha Counter | 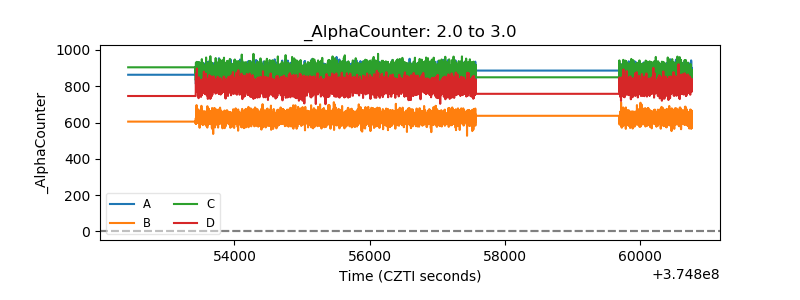 |
| _CPM_Rate | 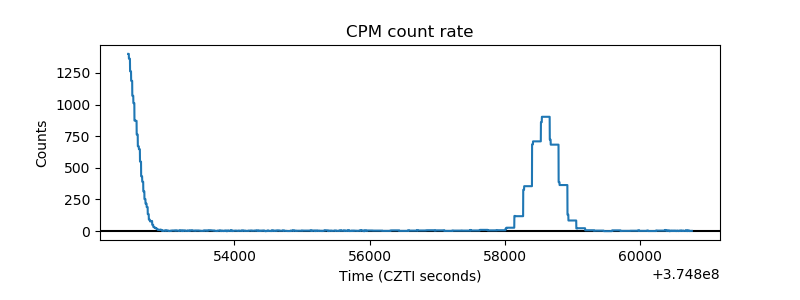 |
| CZT Counter | 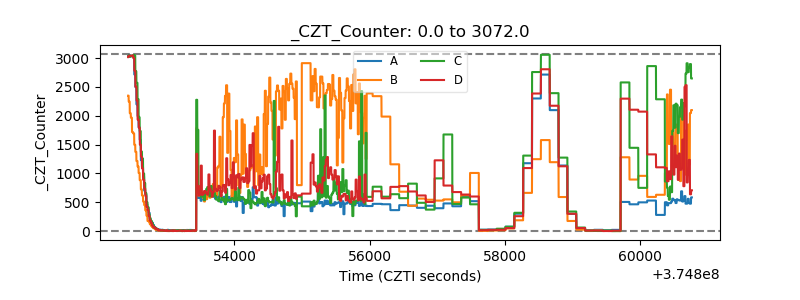 |
| +2.5 Volts monitor |  |
| +5 Volts monitor |  |
| _ROLL_ROT | 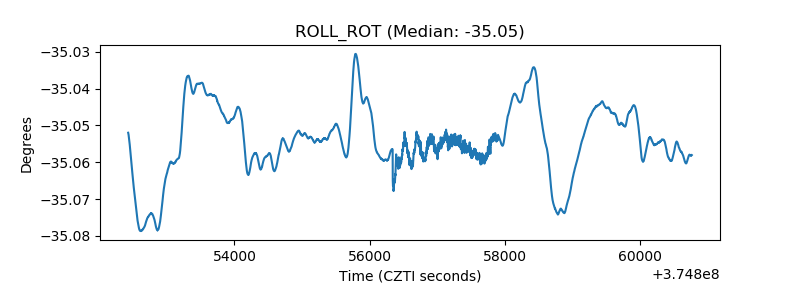 |
| _Roll_DEC | 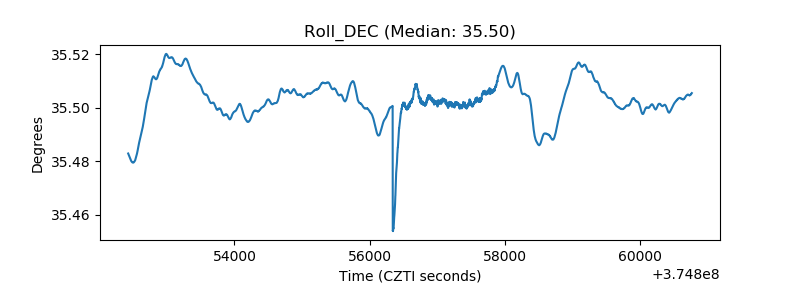 |
| _Roll_RA | 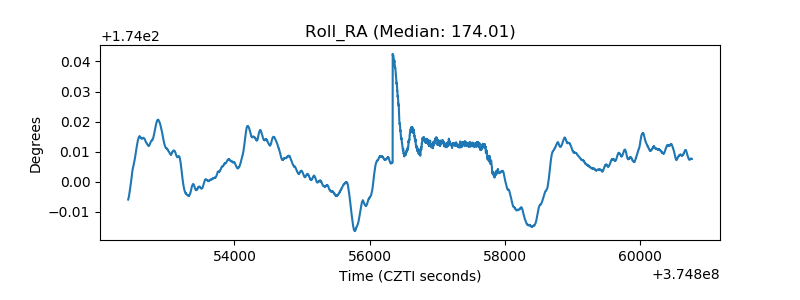 |
| Veto Counter | 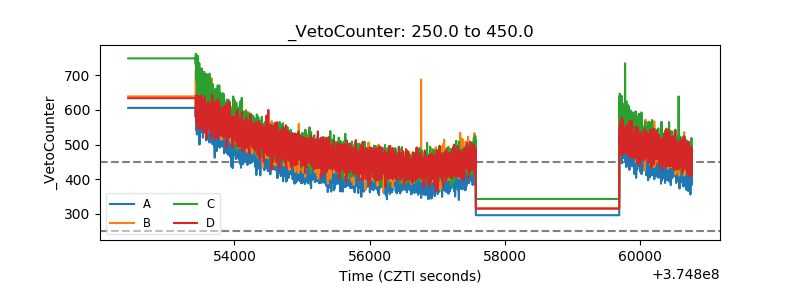 |